
Bitcoin
Bitcoin About To Mimic Japanese Stock Market’s Incredible Late 1980s Rally: Crypto Analyst

A popular crypto analyst thinks Bitcoin (BTC) is currently mirroring the Japanese stock market’s giant rally about four decades ago.
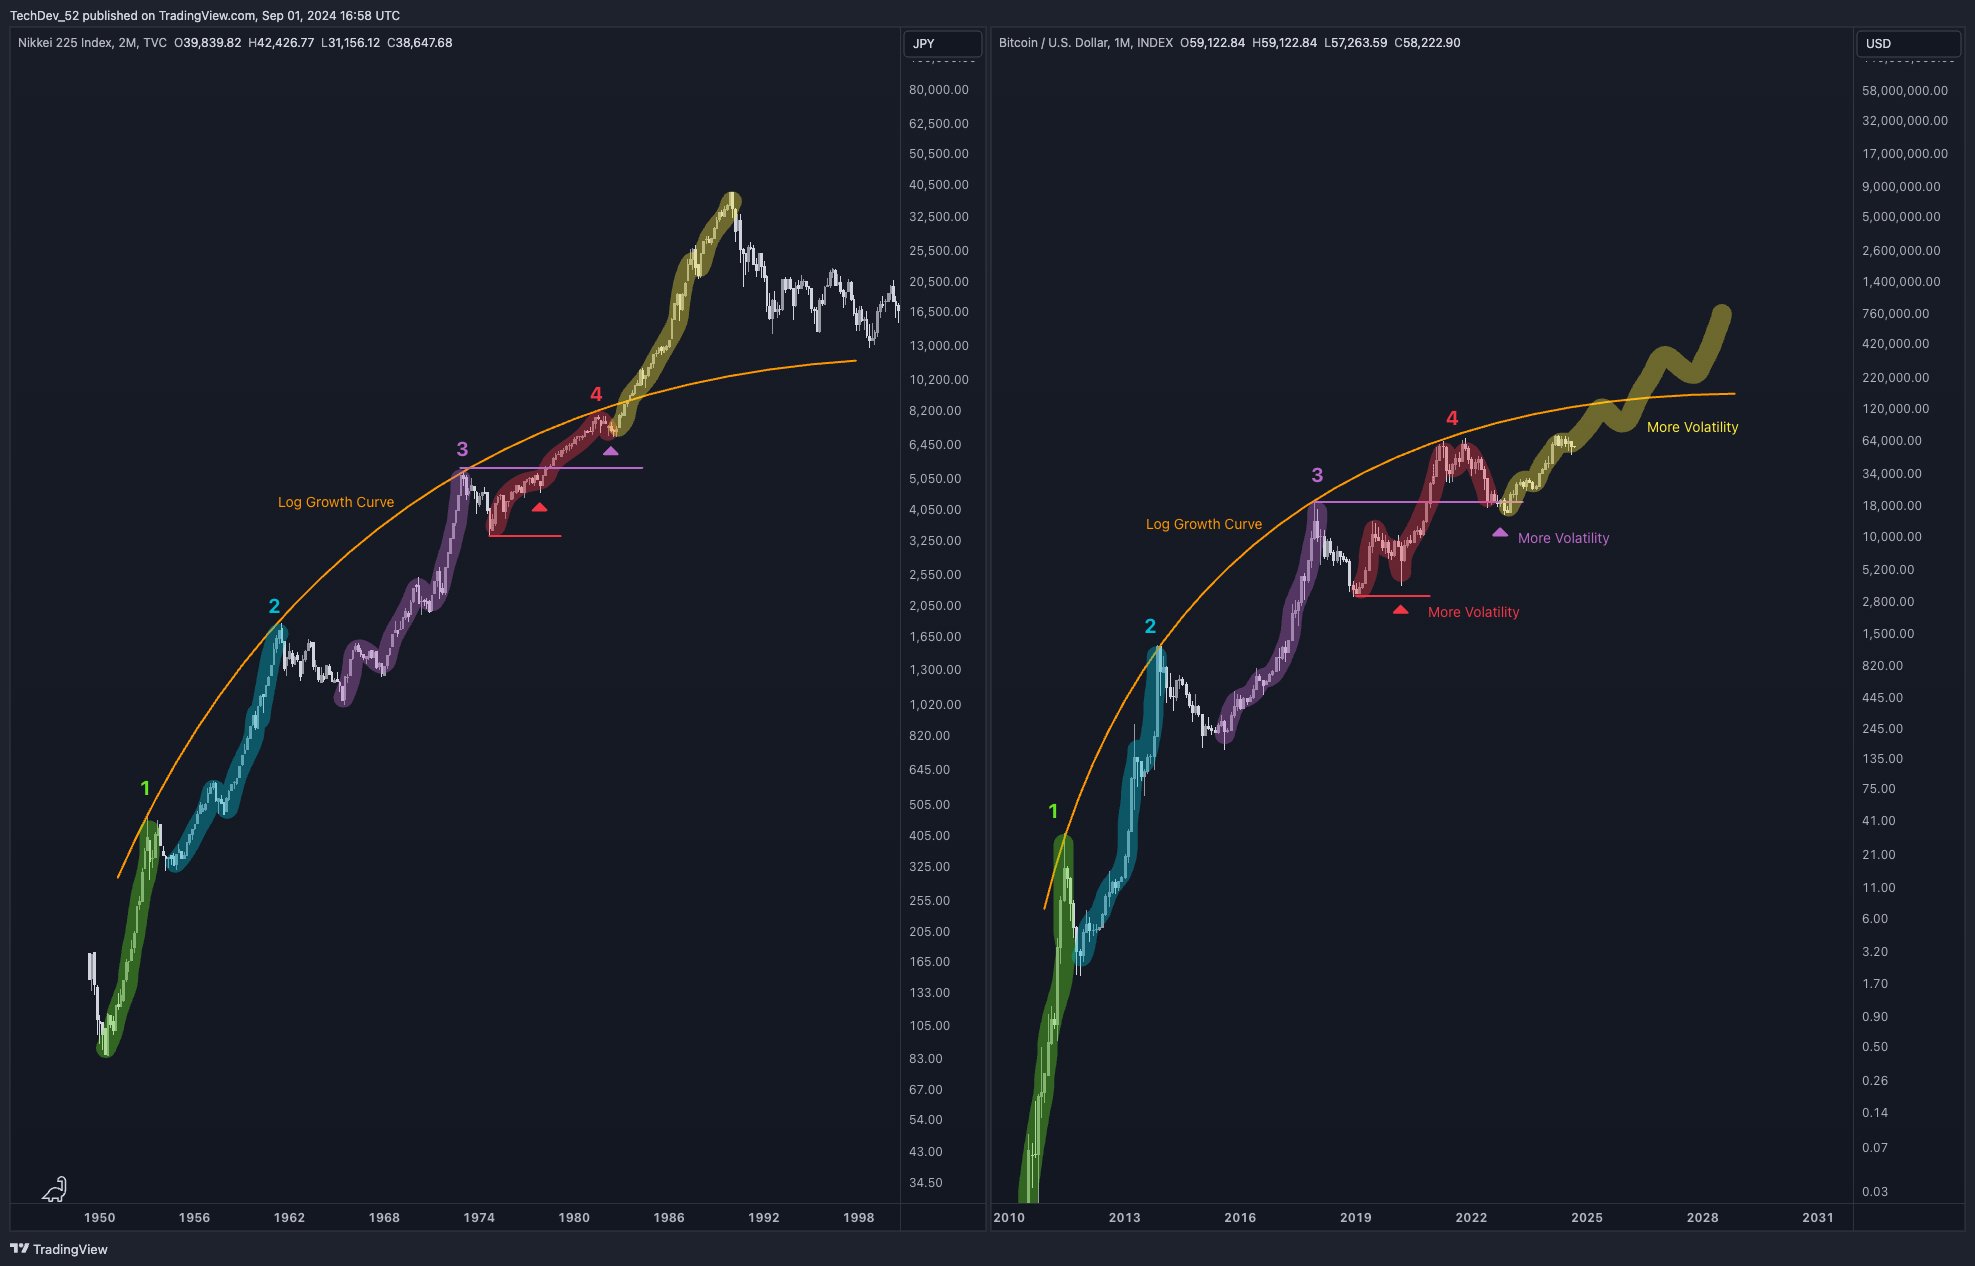
The pseudonymous analyst TechDev shares charts with his 467,400 followers on the social media platform X that compare BTC’s performance since 2010 with the performance of the Nikkei 225, a price-weighted index that tracks 225 blue-chip companies trading on the Tokyo Stock Exchange, between the years 1950 and 2000.
TechDev’s charts suggest Bitcoin could crack $760,000 sometime between 2028 and 2029 before witnessing a multi-year bear market.
The top-ranked crypto asset by market cap is trading at $59,621 at time of writing.
The analyst also shares a chart that has a line for Bitcoin’s price and a line that pits the Chinese 10-year bonds (CN10Y) against M2SL, the seasonally adjusted measure of money supply in the United States.
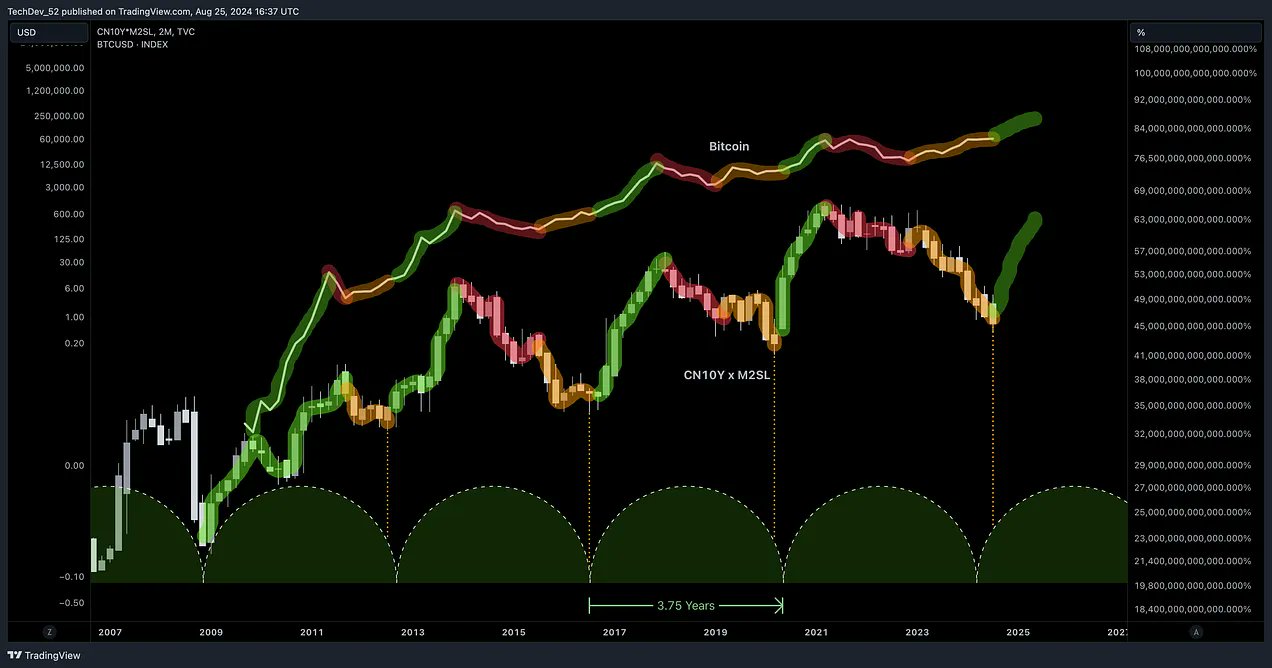
Based on the trader’s chart, he appears to suggest that an expansion in the CN10Y against M2SL would trigger big Bitcoin rallies.
Last month, TechDev noted in a newsletter that he was optimistic about the recent downturn in the crypto market.
“Obviously, there is extreme fear in the market. The last two weeks were filled with ‘told you’ comments from doomer bears – on a retest to $48,000 levels they previously said would never be reached the last time they were doom-posting at $25,000.
Exactly what I like to see. The fact that it came at a time when global macro conditions are pointing up makes it nothing more than two weeks of loud noise to me. More like the last six months.
It’s usually the case in all speculative markets, but the last two years have reflected this more than any other time in the crypto market – it doesn’t move up until X is scared absolutely shitless. That was the case at $15,000 after the FTX crash, at $20,000 after regional banks were failing, at $38,000 after the brutal post-ETF wick, and now.
What you’ll also recall is how much sentiment can whiplash in a couple of weeks. Expecting it again. All the while, the global cycle continues to point higher.”
Don’t Miss a Beat – Subscribe to get email alerts delivered directly to your inbox
Check Price Action
Follow us on X, Facebook and Telegram
Surf The Daily Hodl Mix
 

Disclaimer: Opinions expressed at The Daily Hodl are not investment advice. Investors should do their due diligence before making any high-risk investments in Bitcoin, cryptocurrency or digital assets. Please be advised that your transfers and trades are at your own risk, and any losses you may incur are your responsibility. The Daily Hodl does not recommend the buying or selling of any cryptocurrencies or digital assets, nor is The Daily Hodl an investment advisor. Please note that The Daily Hodl participates in affiliate marketing.
Generated Image: Midjourney
Source link


Bitcoin and open-source companies are some of the most exciting and innovative companies out there today. There are a handful of companies I personally think are going to exponentially grow as bitcoin increases in price and becomes a more established asset class, and if investing in them was available to non-accredited bitcoiners like me, it would be a no-brainer.
But today, that may have just changed. Timestamp, a new platform that allows accredited and nonaccredited investors to invest in Bitcoin and open-source companies, has officially launched. Timestamp promises users they can invest in Bitcoin companies with “low investment minimums” where users can review offerings, connect directly with the founders of these companies, and explore curated opportunities. Sounds pretty cool!
The idea of making investing in Bitcoin and open-source companies more accessible to plebs really interests me, and I feel that many other Bitcoiners would agree. After working in this industry for a few years, I’ve definitely noticed that finding funding to support open-source companies and projects can be pretty difficult. But a platform that allows a lot more people to join in on investing in and supporting these companies could really be a game changer.
At launch, users can now invest in the first batch of Bitcoin companies on the platform:
CASCDR — a suite of AI services payable in Bitcoin
Jippi — a gamified education app that helps Bitcoin beginners learn and earn
Lightning Bounties — a Github-integrated platform that rewards software developers with Bitcoin for their contributions
Shopstr — a global, decentralized marketplace built on Nostr
Sovereign — a wallet built for the Bitcoin standard
I’ll definitely be paying attention to what other companies are added to this platform in the future, and I think you should too.
Over three years ago, I asked Timestamp’s founder and CEO, Dr. Arman Meguerian, to speak with me on stage at the Bitcoin 2021 Conference in Miami, and he joined me for a great conversation on Bitcoin maximalism with a few other great Bitcoiners. I am really excited and happy to see him launch this company after building it quietly through the bear market these last couple years, and looking forward to seeing all they achieve!
This article is a Take. Opinions expressed are entirely the author’s and do not necessarily reflect those of BTC Inc or Bitcoin Magazine.
Source link


Donald Trump, President-elect of the United States, revealed holds $7.2 million in many cryptocurrencies. This is another proof that he is a pro-crypto.
According to data from Arkham Intelligence, on Nov. 25, the 47th President of the United States owned digital assets in cryptocurrencies worth about $7.2 million. He held $26 million in cryptocurrency on Jun. 6, but dropped just a few days after to $17 million.
His most significant hold on crypto is meme coin Trog (TROG), with 210 billion coins equal to $1.86 million. At the time of writing, TROG prices surged 343% from $0.000002008 to $0.000008914 in the past 24 hours.
The most exciting part is that he holds TROG bigger than Ethereum (ETH), with $1.7 million, and the average price of Ethereum is $3,401. WETH (WETH) became the third largest crypto held, with 478 WETH, which is equal to $1.63 million.
Another million holds on crypto is themed-coin of his name, TRUMP with 579k or equals to $1.03 million. He mostly holds meme coins, including GUA, TUA, PUPPIES, and CZAR. Among those on the top list, Bitcoin (BTC) was not on the list as the biggest crypto that he holds.
Trump’s movement on crypto
Although he was ever known as anti-crypto back then in 2021, when he was not re-elected as U.S. President, now he is one of the most significant figures in the crypto industry.
When entering this year’s election, he eventually became pro-crypto as he attended the Bitcoin Conference 2024 in Nashville. He shares the pro-crypto program if re-elected, which includes Bitcoin Strategic Reserve and is supported by numerous Republican senators to propose the idea to Congress.
Now, he has been re-elected to the White House and chosen several names for his cabinet, some of which are identified as pro-crypto, including Robert F. Kennedy Jr and Elon Musk. Trump also chose Scott Bessent as the Secretary of Treasury, who he called as the “most pro-crypto treasury we’ve ever seen,”.
Source link
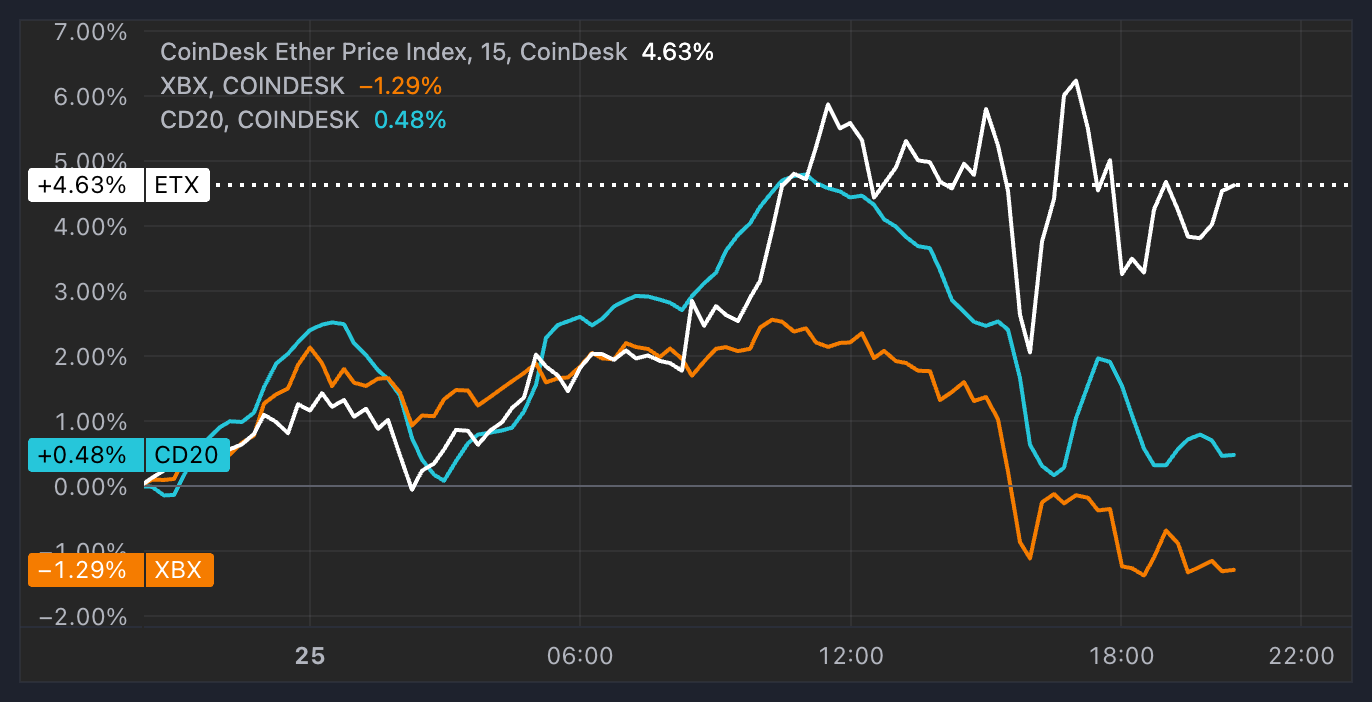
After a prolonged downtrend relative to bitcoin (BTC), Ethereum’s ether (ETH) is showing signs of a resurgence.
ETH, the second-largest cryptocurrency on the market, gained over 4% in the past 24 hours, while BTC lost 1.5% during the same time, dipping below $95,000 during the Monday session. ETH even outperformed the broad-market CoinDesk 20 Index, which was up 0.5%.
The outperformance happened as investors started to rotate capital to smaller, riskier cryptocurrencies over the weekend following the stall of bitcoin’s near-vertical surge since Donald Trump’s election victory. The ETH/BTC ratio, which measures ether’s strength vs. bitcoin, plummeted to as low as 0.0318 on Thursday, its weakest reading since March 2021, but the gague has gained 15% since to 0.3660 at press time.
“The market seems to be expecting BTC to trade sideways until December as attention shifts towards ETH in the near term,” digital asset hedge fund QCP said in a Monday note.
On the options markets, ETH risk reversals are heavily skewed in favor of frontend calls, meanwhile BTC calls seem to be more bid only from the end of December 2024 onwards, QCP noted. The positioning implies that traders anticipate ether to perform well in the short-term, while bitcoin could pick up pace next year. Risk reversal is a strategy that involves purchasing simultaneously a call option (bullish bet) and a put option (bearish bet) for a specific risk-reward profile.
ETH poised for a rebound vs. bitcoin
“We’re seeing some rotation from BTC to ETH coming from crypto-native hedge funds and family offices,” Joshua Lim from Arbelos Markets said.” Josh Lim, co-founder of crypto derivatives prime brokerage firm Arbelos Markets, said in a telegram message.
U.S.-listed spot ETH ETFs saw their first net inflows on Friday, led by $99 million allocation into BlackRock’s ETHA product, following six days of continuous outflows, data compiled by Farside Investors shows. Holders of ETHA include “the largest names in finance” including $80 billion hedge fund Millenium, analytics firm Kaiko said in a Monday report.
There could be more gains in store for ether against bitcoin in the coming period. The ETH/BTC ratio hit a key support level on Thursday and rebounded, while last week’s candle suggested a trend reversal, well-followed crypto trader Pentoshi noted.
“Quite possible the low is in here and that at least a short term reversal is coming,” Pentoshi said in an X post.
Bitcoin Stalls at $100K
Now extended far above its daily moving averages, bitcoin is likely trade sideways for a while as investors digest the steep rally since Donald Trump’s election victory, said Paul Howard, senior director at crypto trading firm Wincent.

“There is a significant sell wall at the psychological $100K level,” Howard told CoinDesk. “I would expect we oscillate around these levels until the new year. Staying market neutral and buying downside protection here is always a sensible risk reward,” he added.
Source link

Cardano eyes spot ETF entry as analyst foresees surge, Rollblock set to explode next

BTC Dips Below $95K, LDO Up 15%

Trader Warns of Potential XRP Correction, Says Dogecoin Trading at Most Likely Area To Expect Rejection

Meme Coins Die — Bloggers’ Advertising is Ineffective

Hashdex Files Second Amendment for Nasdaq Crypto Index US ETF Approval

Bitcoin Dips to $93,000 With $400 Million in Longs Rekt. Where to From Here?

You Can Now Invest In Bitcoin And Open-source Companies

Trump holds $7 million in crypto: Arkham Intelligence

John Deaton Calls Out Gary Gensler For Ties With Sam Bankman-Fried

Ethereum’s ETH Outperforms as Bitcoin (BTC) Price Recoils Off $100K Sell Wall

Safegcd’s Implementation Formally Verified

US detaining Bitcoin mining equipment at border: report

Robinhood Lists Dogwifhat, WIF Price To $5?

MicroStrategy Adds 55,500 More BTC To Its Portfolio For $5.4 Billion

Newmarket Capital Launches Battery Finance, Bitcoin-Collateralized Loan Strategy
182267361726451435
Why Did Trump Change His Mind on Bitcoin?

Top Crypto News Headlines of The Week

New U.S. president must bring clarity to crypto regulation, analyst says

Ethereum, Solana touch key levels as Bitcoin spikes

Bitcoin Open-Source Development Takes The Stage In Nashville

Will XRP Price Defend $0.5 Support If SEC Decides to Appeal?

Bitcoin 20% Surge In 3 Weeks Teases Record-Breaking Potential

Ethereum Crash A Buying Opportunity? This Whale Thinks So

Shiba Inu Price Slips 4% as 3500% Burn Rate Surge Fails to Halt Correction

‘Hamster Kombat’ Airdrop Delayed as Pre-Market Trading for Telegram Game Expands

Washington financial watchdog warns of scam involving fake crypto ‘professors’

Citigroup Executive Steps Down To Explore Crypto
Mostbet Güvenilir Mi – Casino Bonus 2024

Bitcoin flashes indicator that often precedes higher prices: CryptoQuant

 2 months ago
182267361726451435

 Donald Trump4 months ago
Why Did Trump Change His Mind on Bitcoin?
 24/7 Cryptocurrency News3 months ago
Top Crypto News Headlines of The Week
 News3 months ago
New U.S. president must bring clarity to crypto regulation, analyst says
 Bitcoin4 months ago
Ethereum, Solana touch key levels as Bitcoin spikes
 Opinion4 months ago
Bitcoin Open-Source Development Takes The Stage In Nashville
 Price analysis4 months ago
Will XRP Price Defend $0.5 Support If SEC Decides to Appeal?
 Bitcoin4 months ago
Bitcoin 20% Surge In 3 Weeks Teases Record-Breaking Potential
