
Bitcoin
Bitcoin Fear & Greed Index Crashes To Lowest Level Since March, Why This Is Good News
The cryptocurrency market is in a tense mood after Bitcoin lost important price levels this week, and investor sentiment has taken a beating. This caused the Bitcoin Fear & Greed Index to plunge by 16 points in a single day, sinking to 28 yesterday, its lowest level since March. At the time of writing, the index has recovered slightly to 33, but it still in the Fear zone. This may unsettle many investors, but history shows that fearful conditions may be blessings in disguise for Bitcoin investors.
Related Reading
Bitcoin Fear & Greed Index Drops To 28
This week has been tough for many cryptocurrencies, especially Bitcoin. Bitcoin, which started the week above $115,000, entered into an extended decline that saw it break below $110,000, which in turn led to liquidations of over $1 billion worth of positions across the industry. This move also saw Ethereum break below $4,000, alongside altcoins likes XRP, Solana extending to the downside.
Taken together, these moves erased the cautious optimism of last week, when the index sat at a neutral level of 48. Instead, Bitcoin’s Fear and Greed Index fell to as low as 28, which is a dramatic 16 point plunge in a single day.
This crash in the Bitcoin Fear and Greed Index shows just how fast sentiment can reverse when important price thresholds fail to hold. However, while the fearful mood might appear to be a bearish hint, these conditions could be an opportunity for long-term traders. The Fear and Greed Index has historically been a contrarian indicator, with extreme fear levels typically appearing before significant rebounds.
Earlier in March, when the index last reached similar depths, Bitcoin was trading at a relative low around $83,000. Today, even after breaking below 30 on the index again, Bitcoin is about $27,000 higher than it was in March.
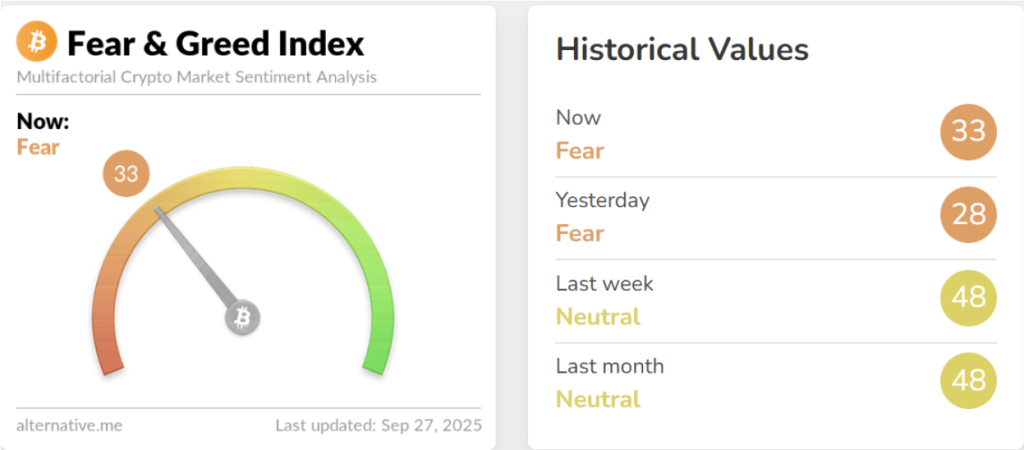
Bitcoin Fear And Greed Index. Source: Alternative.me
Constructive Outlook For The Coming Weeks
The broader takeaway from this sentiment shift is that the crypto market may be closer to its next recovery phase than many expect. The index’s slight rebound to 33 today from yesterday’s low of 28 shows that some traders are already positioning for a turnaround. For one, Bitcoin’s current prices could give savvy investors the chance to accumulate Bitcoin at discount prices.
Bitcoin rarely sustains rallies in conditions of overwhelming greed. Instead, consolidations and corrections reset sentiment and make room for healthier growth. For instance, crypto analyst Michael Pizzino said in a post on X, that the most recent fear could be the turning point Bitcoin and crypto has been waiting for.
Related Reading
In this sense, the fearful environment may be setting the stage for Bitcoin, Ethereum, and other altcoins to build bullish momentum once selling pressure eases.
Now, the most important thing is for the Bitcoin price to reestablish itself above $110,000. At the time of writing, Bitcoin is trading at $109,220.
Featured image from Unsplash, chart from TradingView
Source link


Bitcoin blasted through $116,000 with a 3% daily gain even as the U.S. government officially entered shutdown, its first since 2018. The political stalemate over health-care funding has 750,000 federal workers on furlough and could cost about $400 million per day, yet risk assets shook off early nerves.
Related Reading
Crypto’s total market cap rose 3% to $4.09T, with Bitcoin leading and dominance climbing from 57% to 59%, a structure analysts say tends to produce more durable rallies than altcoin-led surges.
Gold’s sprint to fresh records near $3,875–$3,895/oz underlined the flight-to-safety backdrop, but BTC’s two-day rebound from $112,000 suggests buyers are treating macro uncertainty as a dip-buying opportunity.
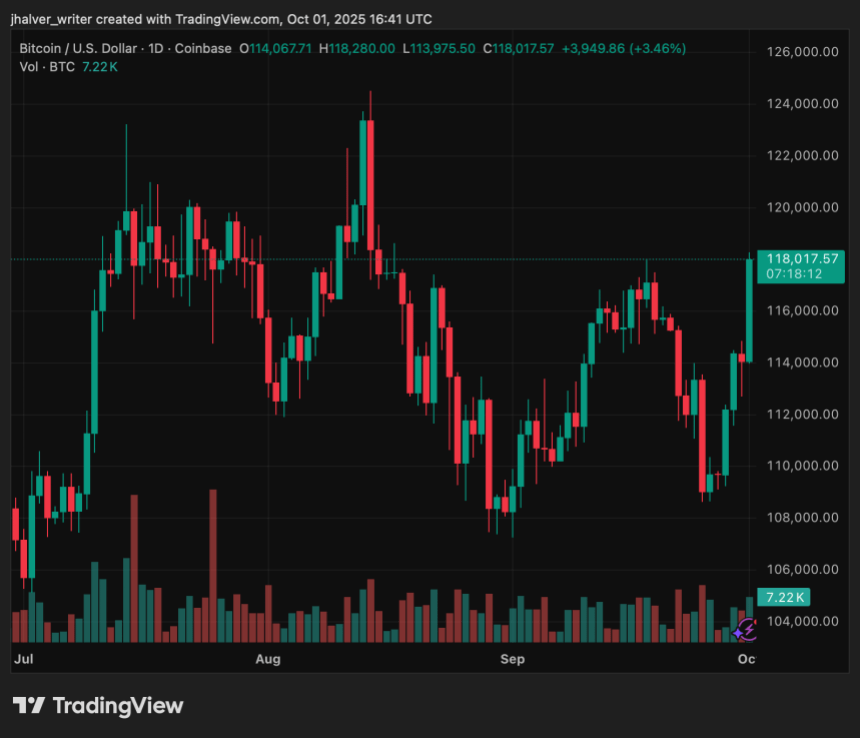
BTC's price trends to the upside on the daily chart. Source: BTCUSD on Tradingview
Bitcoin ETF Inflows, “Uptober” Tailwinds, and a Bull-Flag Setup
Fueling the rally, U.S. spot Bitcoin ETFs attracted $3.53 billion in net inflows in September, topped by $429.9 million on Sept. 30 (BlackRock, Ark, Fidelity leading).
On-chain and derivatives data indicate healthy conditions as leverage resets after the decline, funding levels normalize, and open interest remains steady, allowing BTC to resume its upward trend.
Technical analysts point to a multi-week bull flag with the price now pushing against the upper boundary, mirroring patterns seen before previous impulsive moves. Seasonality also favors the market, with “Uptober” traditionally showing strong performance after a positive September close.
Telegram’s Pavel Durov even revived long-term optimism, reaffirming a $1 million BTC target driven by fixed supply versus money printing, sentiment often seen during mid-cycle expansions.
Bitcoin’s Key Levels to Watch Out
In the near term, Bitcoin resistance is around $117,500. A clear reclaim and daily close above this level could pave the way toward $119,300–$120,300, with a psychological target near $ 120,000.
Order-book heatmaps indicate significant short liquidity between $118,000 and $119,000 (about $7 billion), which could trigger a squeeze if this level is broken.
On the downside, bulls aim to defend the $114,800–$115,200 zone first, then the $112,000 pivot identified before the bounce; below that, there’s a larger liquidity pocket at $107,000–$108,000 (roughly $8 billion in long liquidations).
Related Reading
Analysts MN van de Poppe, Ted Pillows, and Daan Crypto Trades all agree on the same strategy: hold $112,000, break above $117,500, and then let momentum push toward new highs into Q4.
Cover image from ChatGPT, BTCUSD chart from Tradingview
Source link

Stocks printed fresh records and gold is on a tear crossing $3,900, but the last leg higher in traditional markets left bitcoin behind.
The largest crypto, often touted as digital gold, has been stuck in a $100,000–$120,000 range for nearly three months after setting new highs in July and August.
The lag fits a pattern. Over the past couple of years, gold and bitcoin have taken turns: when gold breaks out, bitcoin tends to consolidate; when gold cools, BTC often resumes the advance.
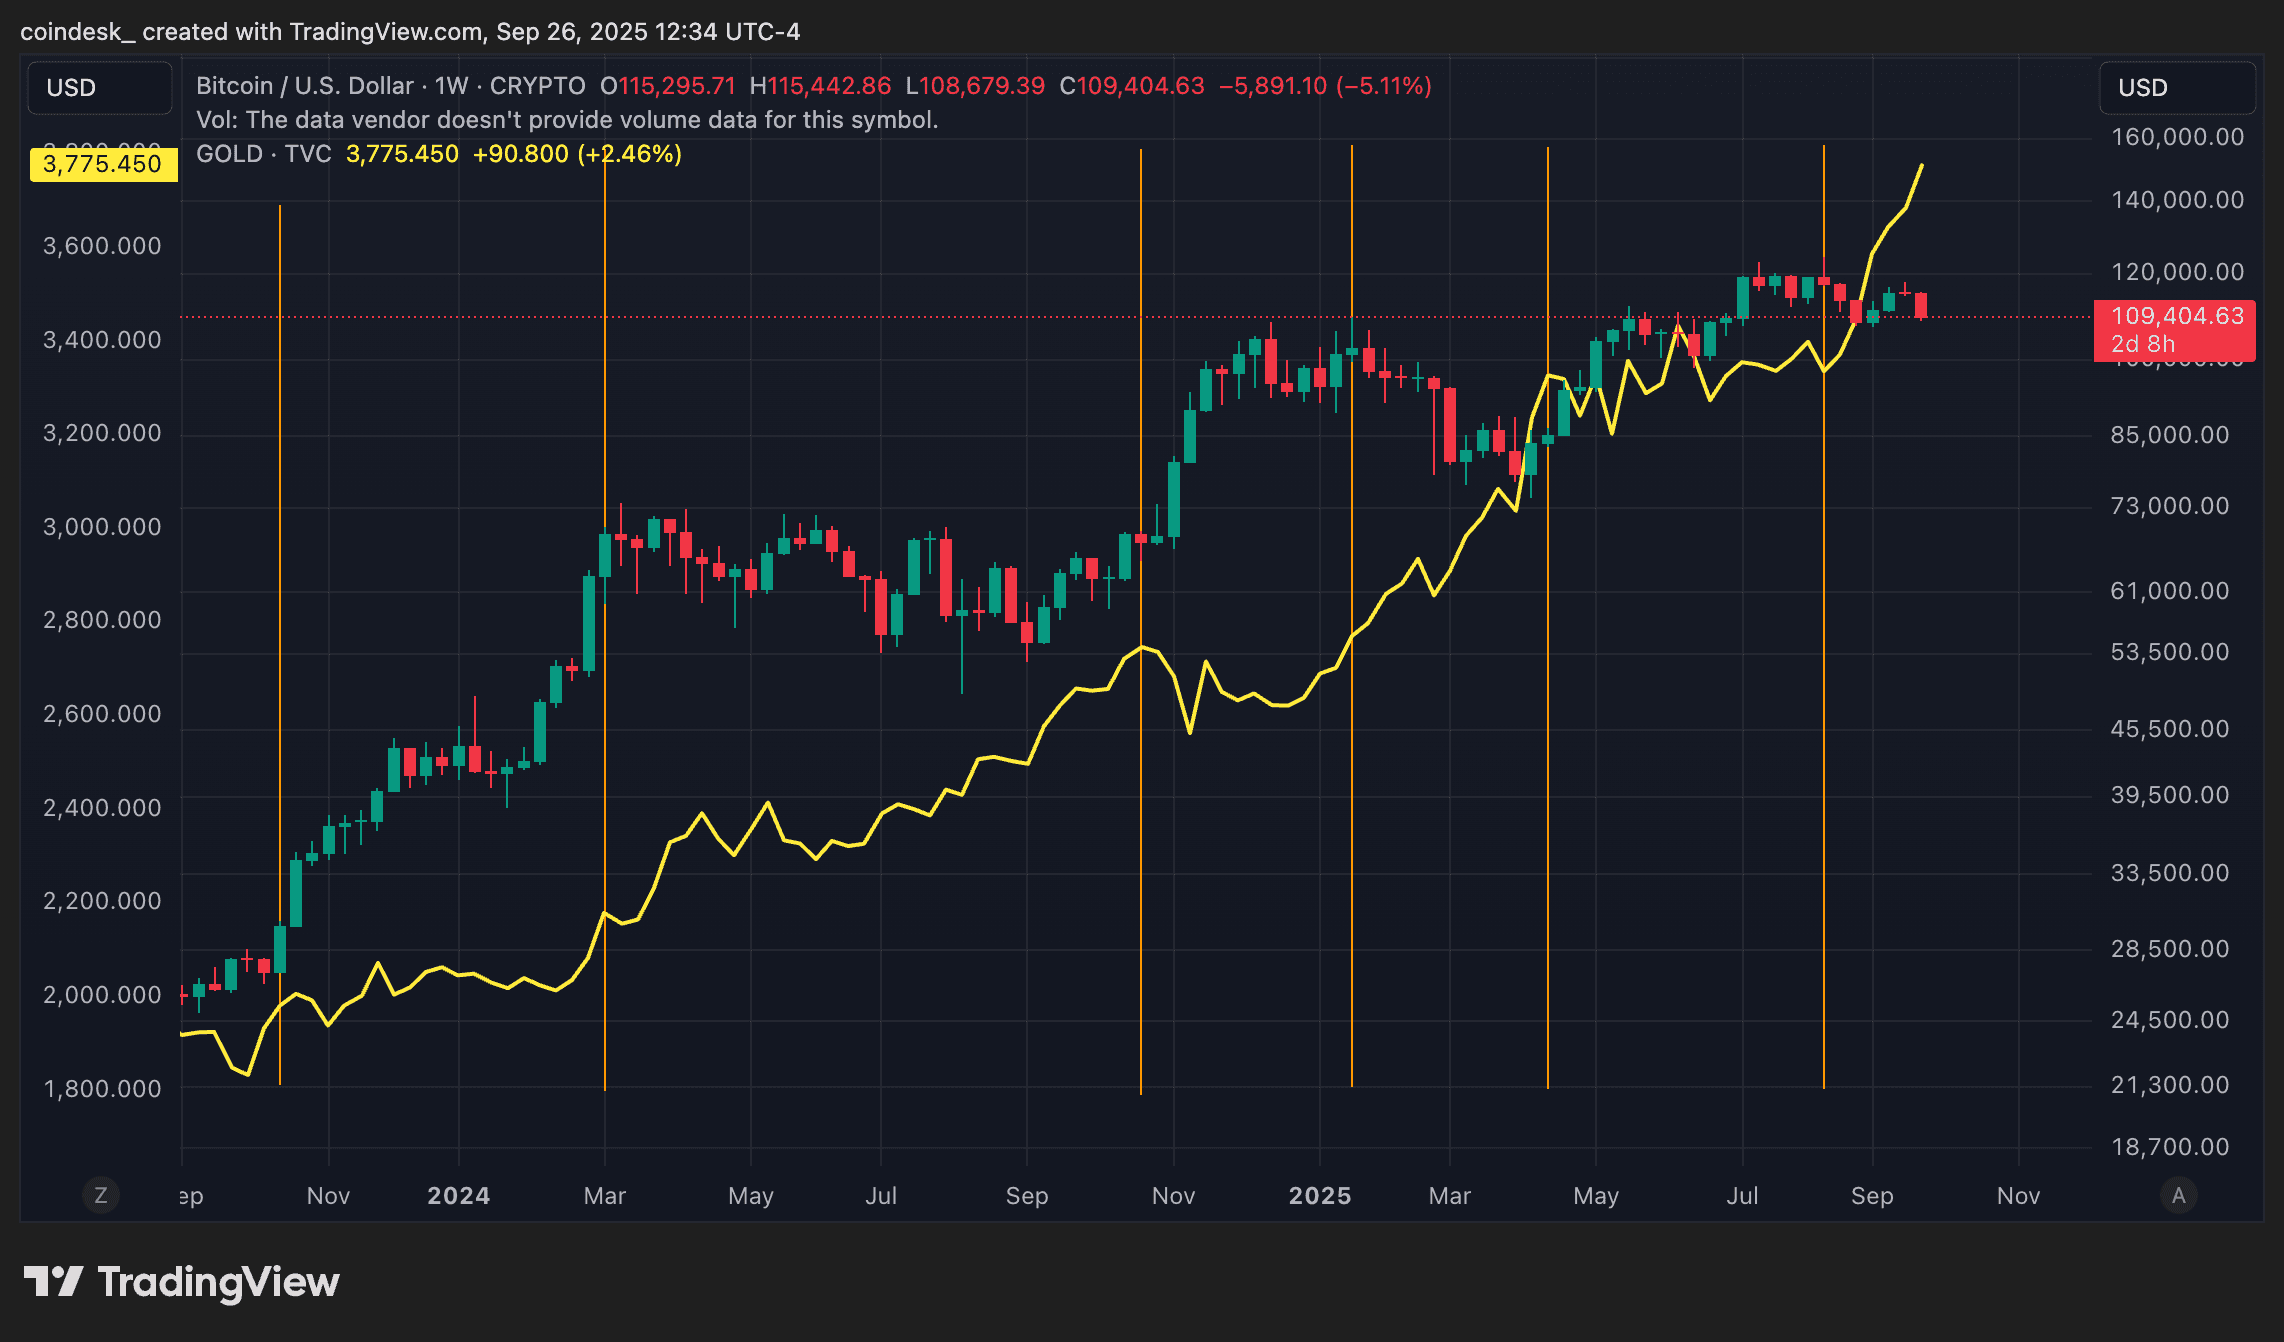
From January into April, BTC plunged about 30% while gold kicked off its next leg, rising roughly 28% to $3,500 at the height of the global tariff tantrum. Gold then stalled into August, and bitcoin took the baton, rallying about 60% from trough to peak to notch fresh records.
Bitcoin to catch up when gold tires
“Gold likes low rates and a weak economy, whereas bitcoin likes them firm,” said Charlie Morris, chief investment officer at ByteTree, in a recent report. “Because bitcoin likes a super strong economy, and low rates are associated with economic slumps.” He added that the BTC–gold relationship is loose: the 90-day correlation has averaged around 0.1 — “basically zero.”
Right now, gold is in a lockout rally toward $4,000, up about 17% across a seven-week winning streak. Bitcoin, meanwhile, is still ranging below $120,000.
If the recent rhythm holds, a pause in gold, or even a sideways drift, could be the tell for BTC’s next break out of the range and another run at records.
“The good news for bitcoin is that sooner or later, gold will get tired,” Morris said.
Source link


Swedish Lawmakers Propose National Bitcoin Reserve

Ethereum and BMNR Rallies as BitMine Drops $1B on ETH, Analyst Hails “Most Bullish Setup Yet”

BBVA Teams With SGX FX to Launch Retail Crypto Trading in Europe

Bitcoin To $120K To Trigger ‘Quick’ Breakout To $150K: Charles Edwards

How Tether Plans To Dominate The US Stablecoin Market

Pendle expands DeFi offerings to Plasma with 5 yield markets

What the Government Shutdown Means for Pending Crypto ETFs

Avalanche Treasury Seals $675M Deal With Mountain Lake to Build $1B AVAX Vehicle

‘Tokenization is Going to Eat the Entire Financial System’ Says Robinhood CEO

Bitcoin Hits Seven-Week High As Crypto Markets Surge In Oct

Bitcoin Surges Past $116K Despite U.S. Government Shutdown: Is $120K Next?

Best crypto hardware wallets 2025

Bitcoin Miners’ Market Cap Soared in September to Record High
DEPIN Project Spacecoin Executes First Blockchain Transaction in Low Earth Orbit

When Could Bitcoin (BTC) Price Break New Record Highs? Watch Out for Gold

Pi Network coin to $10? 4 catalysts that may make it possible

Arthur Hayes, Murad’s Prediction For Meme Coins, AI & DeFi Coins For 2025

3 Voting Polls Show Why Ripple’s XRP Price Could Hit $10 Soon

Expert Sees Bitcoin Dipping To $50K While Bullish Signs Persist

Bitcoin Could Rally to $80,000 on the Eve of US Elections

Aptos Leverages Chainlink To Enhance Scalability and Data Access

The Future of Bitcoin: Scaling, Institutional Adoption, and Strategic Reserves with Rich Rines

Institutional Investors Go All In on Crypto as 57% Plan to Boost Allocations as Bull Run Heats Up, Sygnum Survey Reveals

Crypto’s Big Trump Gamble Is Risky

Sonic Now ‘Golden Standard’ of Layer-2s After Scaling Transactions to 16,000+ per Second, Says Andre Cronje

Has The Bitcoin Price Already Peaked?

Ripple-SEC Case Ends, But These 3 Rivals Could Jump 500x

I’m Grateful for Trump’s Embrace of Bitcoin

Is A Bitcoin Supercycle Imminent?

A16z-backed Espresso announces mainnet launch of core product
 Markets7 months ago
Pi Network coin to $10? 4 catalysts that may make it possible
 24/7 Cryptocurrency News11 months ago
Arthur Hayes, Murad’s Prediction For Meme Coins, AI & DeFi Coins For 2025
 Ripple Price7 months ago
3 Voting Polls Show Why Ripple’s XRP Price Could Hit $10 Soon
 Bitcoin9 months ago
Expert Sees Bitcoin Dipping To $50K While Bullish Signs Persist
 Bitcoin11 months ago
Bitcoin Could Rally to $80,000 on the Eve of US Elections
 24/7 Cryptocurrency News9 months ago
Aptos Leverages Chainlink To Enhance Scalability and Data Access
 Bitcoin8 months ago
The Future of Bitcoin: Scaling, Institutional Adoption, and Strategic Reserves with Rich Rines
 Bitcoin11 months ago
Institutional Investors Go All In on Crypto as 57% Plan to Boost Allocations as Bull Run Heats Up, Sygnum Survey Reveals
