
Bitcoin
Bitcoin Indicator Signals ‘Shift To Bullish Territory’ – Can BTC Break Past $65,000?
Bitcoin has experienced a significant price surge since Tuesday, following the Federal Reserve’s announcement of a 50 bps interest rate cut. This move pushed BTC past the critical $62,000 mark, a psychological level that has become a turning point for investor sentiment. With Bitcoin now testing local supply, market participants are closely watching for further upside potential.
Related Reading
As the price continues to push higher, analysts are pointing to crucial data indicating a potential shift in Bitcoin’s trend after months of downtrend price action. Glassnode metrics reveal a notable trend change, suggesting BTC may be entering bullish territory once again. This resurgence is drawing increased attention from both retail and institutional investors as they evaluate whether Bitcoin’s rally has staying power or if the market will face resistance at higher levels.
With renewed momentum, the coming days will be critical in determining if Bitcoin can sustain this upward trajectory and fully break out of its previous bearish phase.
Bitcoin Signals A Bullish Return
Bitcoin investors have seen sentiment shift dramatically from fearful to hopeful in just a few days. Following the Federal Reserve’s rate cut announcement on Wednesday, Bitcoin surged over 8%, breaking critical levels and testing local supply. This sudden price action has sparked renewed optimism in the broader crypto market, giving investors hope for a fresh start after months of bearish price movement.
Prominent crypto analyst Ali Martinez has shared valuable insights on X, drawing attention to key data from Glassnode that suggests a significant shift in Bitcoin’s price trend. Specifically, Ali highlights the Market Value to Realized Value (MVRV) ratio, which tracks the difference between BTC’s market price and its actual value.
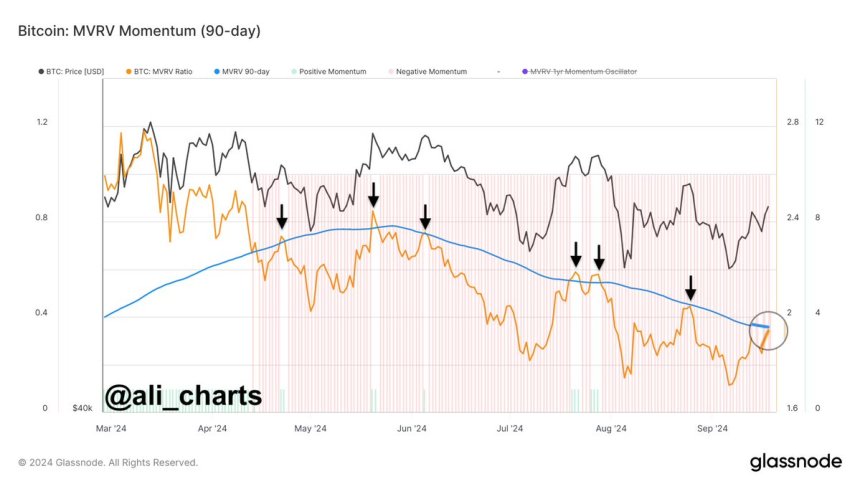
The MVRV ratio, which had been in a downtrend since April, is now rising, signaling that Bitcoin may be regaining strength. Ali notes that the MVRV is a critical indicator for assessing momentum, and the current upward trend hints at a potential return to bullish territory.
Related Reading
The analyst further explains that if the MVRV can close above its 90-day moving average, it would confirm a stronger bullish outlook for Bitcoin. Given the aggressive price surge and the increasing demand reflected in recent price action, this scenario seems increasingly likely. Investors are now watching closely, as Bitcoin’s next moves could mark the beginning of a new bull phase.
Technical Levels To Watch
Bitcoin (BTC) is trading at $63,024 after days of consistent “only up” price action since hitting local lows. The price recently broke above the daily 200 exponential moving average (EMA) at $59,350 and is now testing the critical daily 200 moving average (MA) at $63,954.
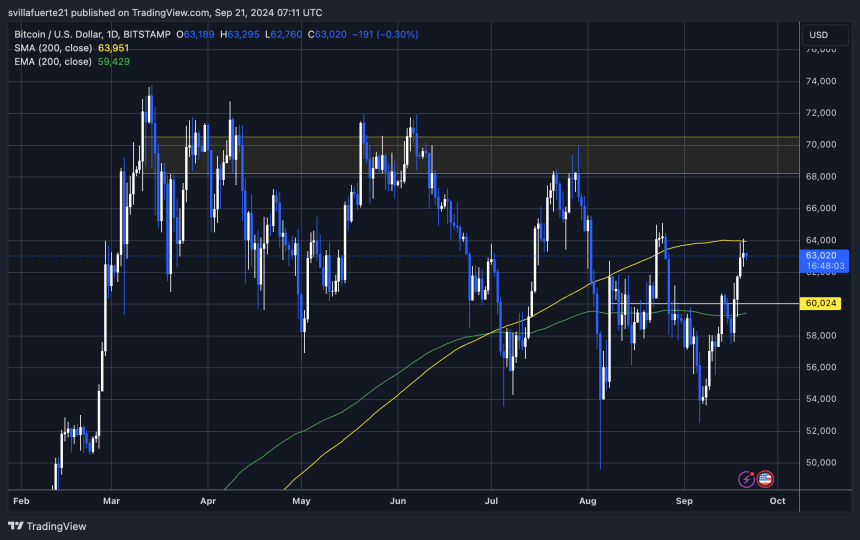
This daily 200 MA is a key long-term indicator, signaling overall market strength. If Bitcoin can reclaim this level as support, it would likely trigger a significant price surge, bolstering the bullish outlook.
Related Reading
For bulls to maintain momentum, the next target would be around this critical level, with a potential push toward $65,000, a price last tested in late August. However, should BTC fail to hold above $60,000 in the coming days, investors may see a retracement to lower demand levels. The ability to stay above key support zones will determine the next phase of price action.
Featured image from Dall-E, chart from TradingView
Source link


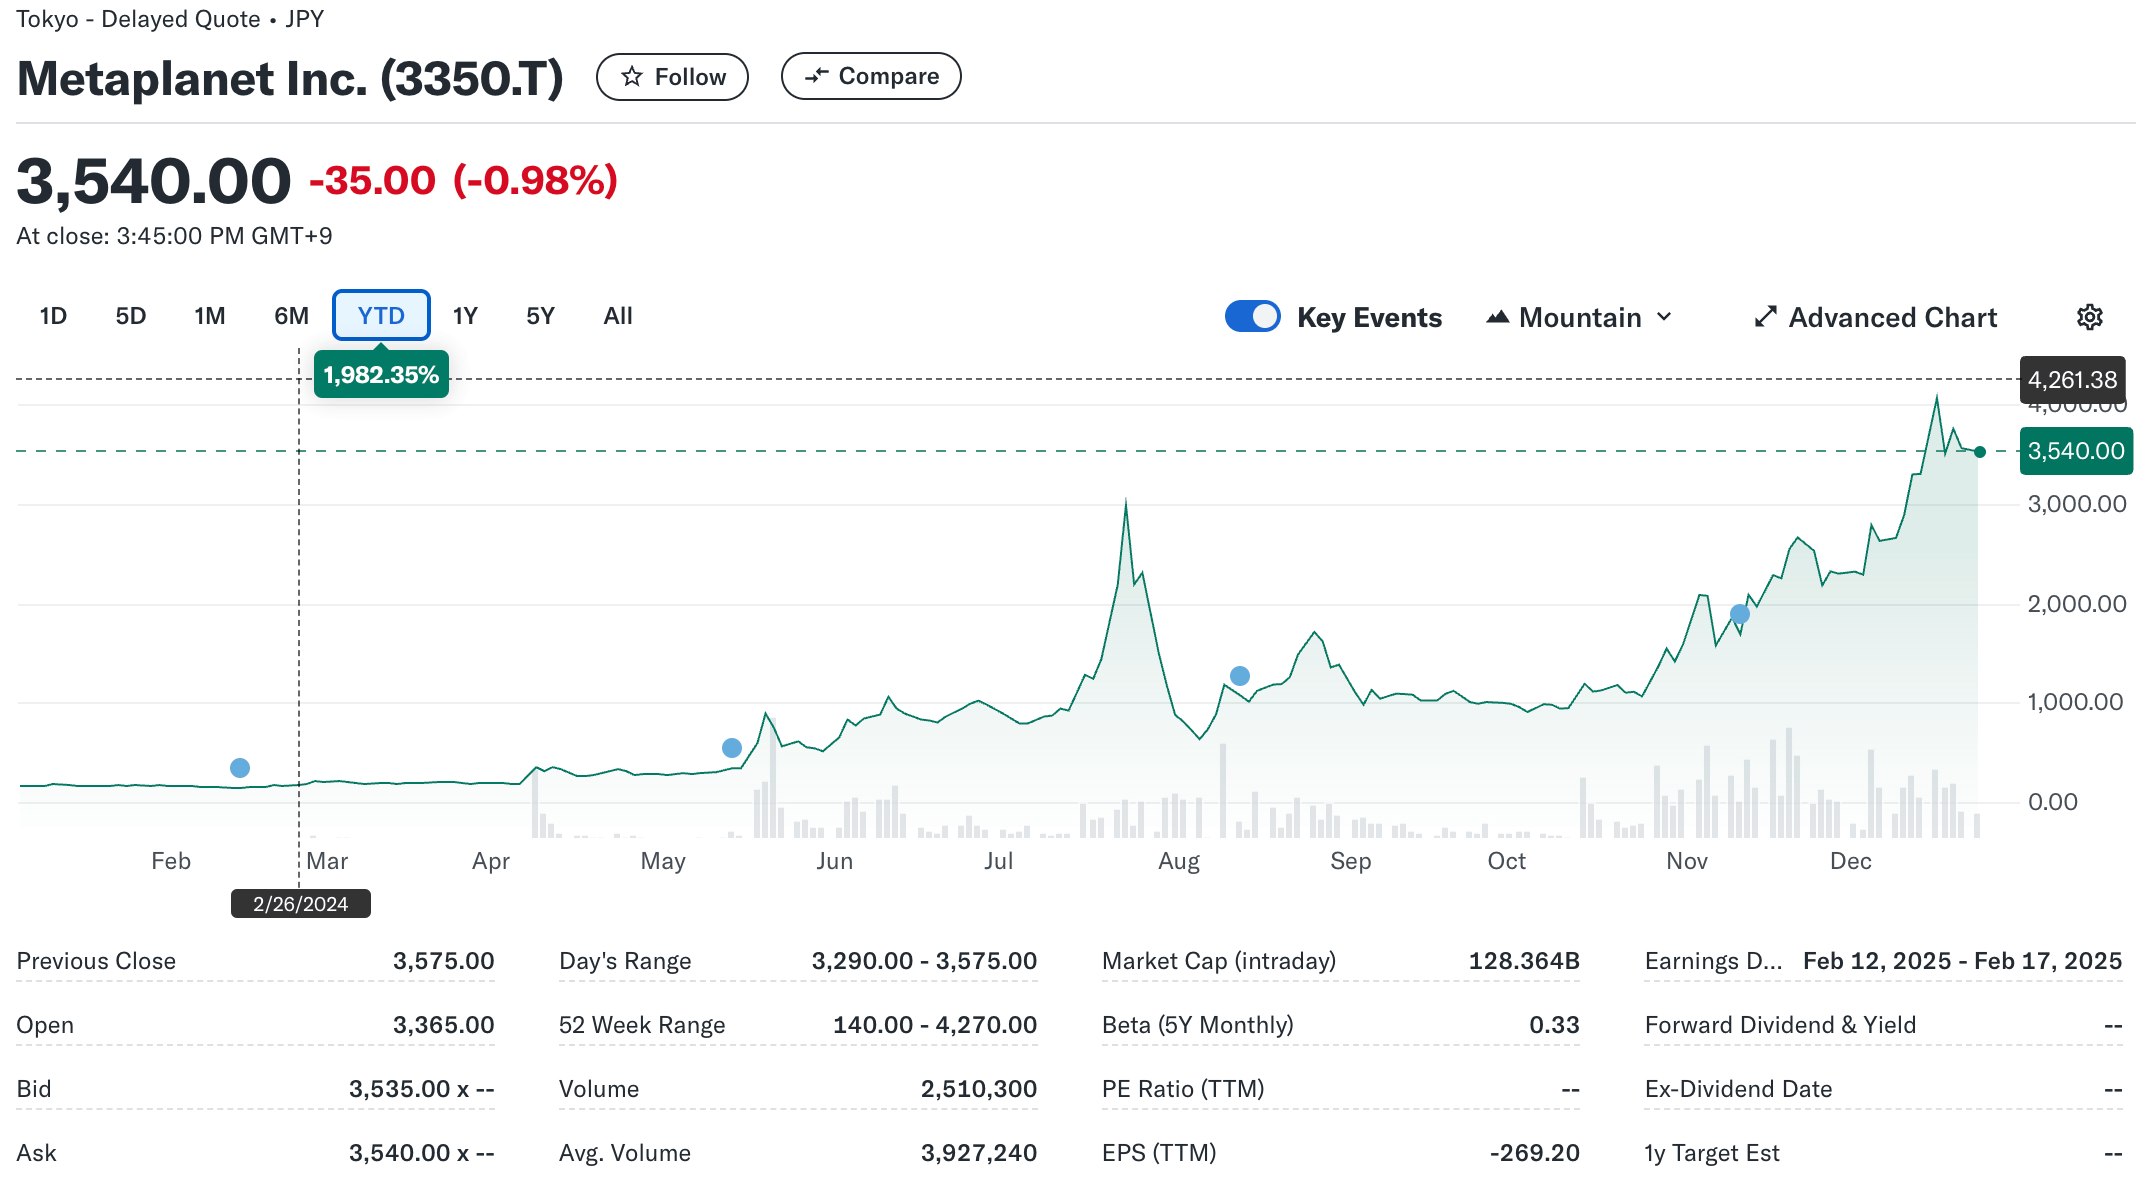
Japan-based early-stage investment firm Metaplanet continues its Bitcoin (BTC) buying spree. The company announced today that it has purchased 619.7 BTC for $61 million – including fees and other expenses – making it the firm’s largest Bitcoin acquisition to date.
Metaplanet Increases BTC Holdings To 1,762
The recent crypto market downturn from its all-time highs (ATH) does not appear to bother Metaplanet, as the Tokyo-listed firm made its largest BTC purchase to date, buying 619.7 BTC worth $ 61 million at an average price of around $96,000.
Related Reading
To recall, Metaplanet started buying BTC earlier this year in May with a purchase of 97.9 BTC. Since then, the company has purchased BTC every month, barring September, and crossed the 1,000 BTC milestone in November. The latest acquisition has pushed Metaplanet’s total Bitcoin holdings to 1,762, bought at an average price of $75,600 per BTC.
Notably, this $61 million purchase is nearly double the value of Metaplanet’s previous largest acquisition, which occurred in November and was worth close to $30 million. The company’s consistent BTC accumulation has earned it the nickname “Asia’s MicroStrategy,” in reference to the US-based business intelligence firm known for its aggressive Bitcoin buying strategy.
It is worth highlighting that today’s BTC purchase comes a week after Metaplanet raised $60.6 million through two tranches of bond issuance for the purpose of “accelerating BTC purchases.” Metaplanet’s latest purchase also makes its BTC reserves the 12th-largest among publicly listed firms globally.
According to Metaplanet’s official announcement, its BTC Yield – a proprietary metric used to measure the performance of its Bitcoin acquisition strategy – stood at 310% from October 1 to December 23. The firm emphasized that this strategy is designed to be “accretive to shareholders.”
Despite today’s significant BTC purchase, Metaplanet’s stock price saw little movement, closing at $22.5, down 0.98% for the day. However, on a year-to-date basis, the company’s stock has surged by an astounding 1,982%, reflecting the long-term benefits of its Bitcoin-centric strategy.
Bitcoin Supply Crunch To Hasten Adoption?
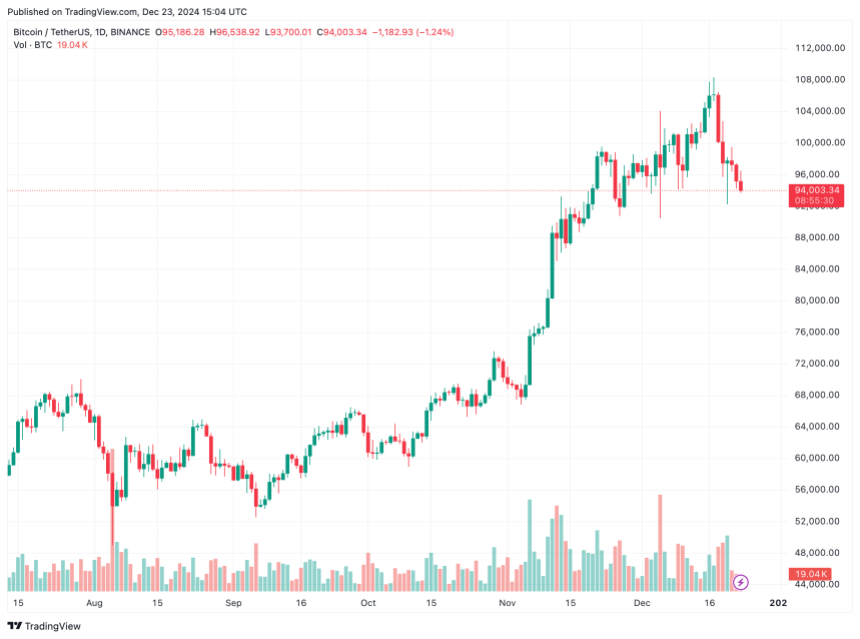
With Bitcoin’s total maximum supply capped at 21 million, the digital asset has solidified its reputation as an inflation-resistant store of value. A recent report highlights that BTC supply on crypto exchanges has hit multi-year lows, indicating that holders are increasingly withdrawing BTC from exchanges, reducing circulating supply and potentially driving prices higher.
Related Reading
Bitcoin’s scarcity has triggered an unofficial race among corporations – and possibly even governments. For instance, Bitcoin mining firm Hut 8 recently purchased 990 BTC for $100 million, increasing its total holdings to over 10,000 BTC. Similarly, MARA, another Bitcoin mining company, acquired 703 BTC earlier this month, bringing its total holdings to 34,794 BTC.
Speculations surrounding a potential US strategic Bitcoin reserve are further strengthening BTC’s supply crunch narrative, which may fast-track its adoption. At press time, BTC trades at $94,003, down 1.5% in the past 24 hours.
Featured image from Unsplash, charts from Yahoo! Finance and Tradingview.com
Source link
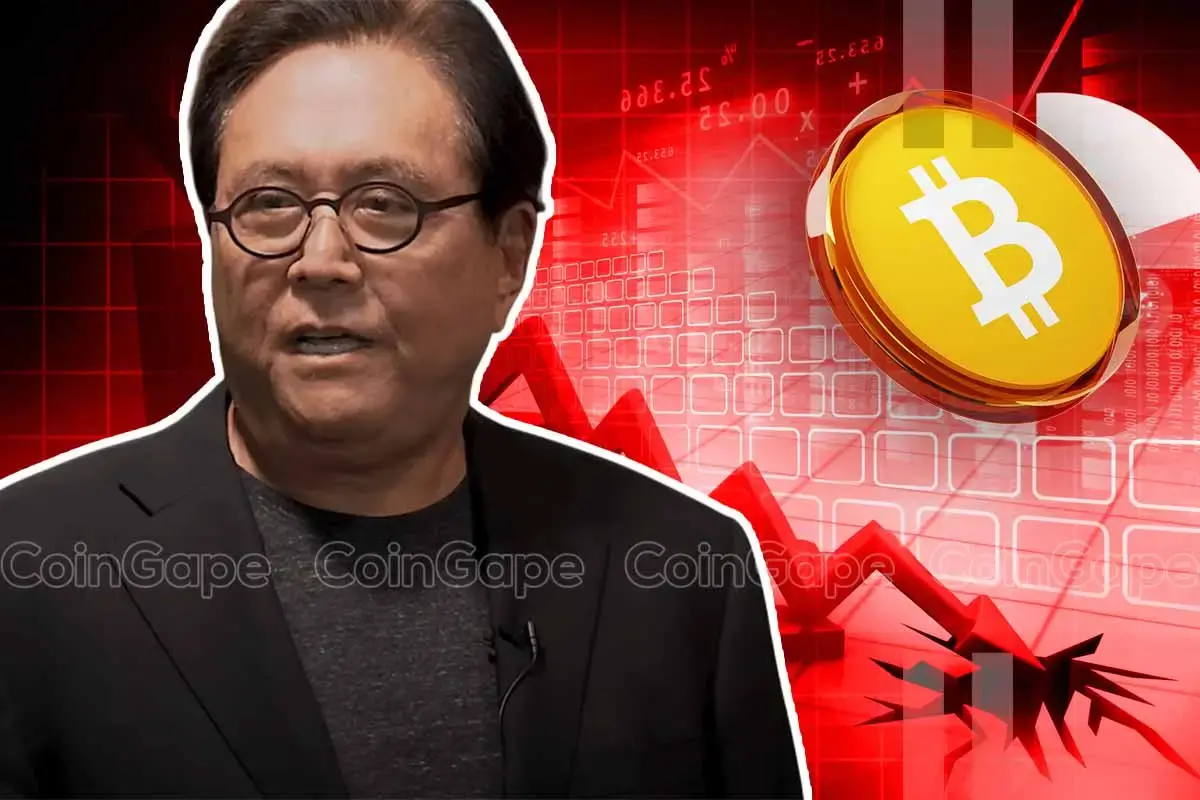
Rich Dad Poor Dad author Robert Kiyosaki has issued a stark warning while hinting towards an economic depression ahead. In a recent X post, the renowned author said that the global market crash has already started, as he predicted earlier, which indicates that the financial market might enter a “depression” phase. Notably, this comes as the crypto market records immense volatility, sparking concerns over what’s next for Bitcoin (BTC).
Robert Kiyosaki Hints At Economic Depression Ahead
Robert Kiyosaki, in a recent X post, has revealed a stark warning of a looming economic depression. The Rich Dad Poor Dad author warned that a global market crash has already begun, citing Europe, China, and the U.S. as regions facing significant downturns.
In his post, Kiyosaki urged caution, advising individuals to safeguard their finances and maintain their jobs. “Global crash has started. Europe, China, USA going down. Depression ahead?” he asked while emphasizing the enduring value of assets like gold, silver, and Bitcoin. He added, “For many people, crashes are the best times to get rich.”
This warning aligns with Kiyosaki’s earlier prediction of what he called the “biggest crash in history.” Earlier this month, he encouraged his followers to prepare for financial turmoil, stating, “Please be proactive and get rich… before the BOOMER’s go BUST.”
However, this recent comment from Robert Kiyosaki indicates his sustained confidence in BTC. As the crypto market faces heightened volatility, Bitcoin could emerge as a hedge against traditional market instability, he noted. Besides, it also indicates that the flagship crypto, alongside gold and silver, might continue to gain traction amid this economic turmoil.
What’s Next For BTC?
Bitcoin price today has continued its volatile trading, losing nearly 1.5% over the last 24 hours to $95,323. The crypto touched a high and low of $97,260 and $93,690 in the last 24 hours, showcasing the highly volatile scenario in the market.
In addition, the US Spot Bitcoin ETF also recorded significant outflow, with BlackRock Bitcoin ETF witnessing its largest outflux since its launch. This has weighed on the investors’ sentiment, sparking concerns over a waning institutional interest.
However, despite that, many experts remained confident on the asset’s future trajectory. For context, in a recent X post, Peter Brandt shared a new BTC price target, indicating his confidence in the digital asset.
On the other hand, institutions like Metaplanet have also continued to boost their BTC holdings. These moves indicates that the institutions, as well as many investors, are bullish towards the long-term potential of the crypto. Besides, as Robert Kiyosaki said, the recent dip also provides a buying opportunity to investors, which might further boost Bitcoin to its new ATH ahead.
Rupam Roy
Rupam is a seasoned professional with three years of experience in the financial market, where he has developed a reputation as a meticulous research analyst and insightful journalist. He thrives on exploring the dynamic nuances of the financial landscape. Currently serving as a sub-editor at Coingape, Rupam’s expertise extends beyond conventional boundaries. His role involves breaking stories, analyzing AI-related developments, providing real-time updates on the crypto market, and presenting insightful economic news.
Rupam’s career is characterized by a deep passion for unraveling the complexities of finance and delivering impactful stories that resonate with a diverse audience.
Disclaimer: The presented content may include the personal opinion of the author and is subject to market condition. Do your market research before investing in cryptocurrencies. The author or the publication does not hold any responsibility for your personal financial loss.
Source link


Tokyo-listed Metaplanet has purchased another 9.5 billion yen ($60.6 million) worth of Bitcoin, pushing its holdings to 1,761.98 BTC.
Metaplanet, a publicly traded Japanese company, has acquired 619.7 Bitcoin as part of its crypto treasury strategy, paying an average of 15,330,073 yen per (BTC), with a total investment of 9.5 billion yen.
According to the company’s latest financial disclosure, Metaplanet’s total Bitcoin holdings now stand at 1,761.98 BTC, with an average purchase price of 11,846,002 yen (~$75,628) per Bitcoin. The company has spent 20.872 billion yen in total on Bitcoin acquisitions, the document reads.
The latest purchase is the largest so far for the Tokyo-headquartered company and comes just days after Metaplanet issued its 5th Series of Ordinary Bonds via private placement with EVO FUND, raising 5 billion yen (approximately $32 million).
The proceeds from this issuance, as disclosed earlier, were allocated specifically for purchasing Bitcoin. These bonds, set to mature in June 2025, carry no interest and allow for early redemption under specific conditions.
Metaplanet buys dip
The company also shared updates on its BTC Yield, a metric used to measure the growth of Bitcoin holdings relative to fully diluted shares. From Oct. 1 to Dec. 23, Metaplanet’s BTC Yield surged to 309.82%, up from 41.7% in the previous quarter.
Bitcoin itself has seen strong performance this year, climbing 120% and outperforming assets like the Nasdaq 100 and S&P 500 indices. However, it has recently pulled back from its all-time high of $108,427, trading at $97,000 after the Federal Reserve indicated only two interest rate cuts in 2025.
Despite the retreat, on-chain metrics indicate that Bitcoin is still undervalued based on its Market Value to Realized Value (MVRV-Z) score, which stands at 2.84 — below the threshold of 3.7 that historically signals an asset is overvalued.
Source link

Solaxy presale raises $4.5M for Solana Layer 2 solution

Elon Musk xAI Secures $6B To Boost Generative AI Expansion: Details

Metaplanet Bitcoin Reserves Grow With Fresh $61 Million Purchase

Investors turn to Lightchain AI 3000x potential after PEPE drop

Moonpay In Talks To Acquire Coinbase Commerce Rival Helio

The Satoshi Papers Explores The Role Of The State In A Post-Bitcoin World: An Interview With Natalie Smolenski

Stablecoin Issuer Tether Invests $775,000,000 Into YouTube Rival Rumble

Solana L2 Sonic includes TikTok users in airdrop

5 Tokens Ready For A 20X After Solana ETF Approval
Solana beats Ethereum in a key metric 3 months in a row

SCENE’s 2024 Person of the Year: Iggy Azalea

BTC Risks Falling To $20K If This Happens

Most Layer 2 solutions are still struggling with scalability

Here’s why Stellar Price Could Go Parabolic Soon

Perp-Focused HyperLiquid Experiences Record $60M in USDC Net Outflows
182267361726451435
Why Did Trump Change His Mind on Bitcoin?

Top Crypto News Headlines of The Week

New U.S. president must bring clarity to crypto regulation, analyst says

Will XRP Price Defend $0.5 Support If SEC Decides to Appeal?

Bitcoin Open-Source Development Takes The Stage In Nashville

Ethereum, Solana touch key levels as Bitcoin spikes

Bitcoin 20% Surge In 3 Weeks Teases Record-Breaking Potential

Ethereum Crash A Buying Opportunity? This Whale Thinks So

Shiba Inu Price Slips 4% as 3500% Burn Rate Surge Fails to Halt Correction

Washington financial watchdog warns of scam involving fake crypto ‘professors’

‘Hamster Kombat’ Airdrop Delayed as Pre-Market Trading for Telegram Game Expands

Citigroup Executive Steps Down To Explore Crypto
Mostbet Güvenilir Mi – Casino Bonus 2024

NoOnes Bitcoin Philosophy: Everyone Eats

 3 months ago
182267361726451435

 Donald Trump5 months ago
Why Did Trump Change His Mind on Bitcoin?
 24/7 Cryptocurrency News4 months ago
Top Crypto News Headlines of The Week
 News4 months ago
New U.S. president must bring clarity to crypto regulation, analyst says
 Price analysis4 months ago
Will XRP Price Defend $0.5 Support If SEC Decides to Appeal?
 Opinion5 months ago
Bitcoin Open-Source Development Takes The Stage In Nashville
 Bitcoin5 months ago
Ethereum, Solana touch key levels as Bitcoin spikes
 Bitcoin5 months ago
Bitcoin 20% Surge In 3 Weeks Teases Record-Breaking Potential

✓ Share: