Bitcoin
Bitcoin Poised For A Q2 Recovery? Analyst Points 2017 Similarities
Published
3 days agoon
By
admin
Reason to trust

Strict editorial policy that focuses on accuracy, relevance, and impartiality
Created by industry experts and meticulously reviewed
The highest standards in reporting and publishing
Strict editorial policy that focuses on accuracy, relevance, and impartiality
Morbi pretium leo et nisl aliquam mollis. Quisque arcu lorem, ultricies quis pellentesque nec, ullamcorper eu odio.
As Bitcoin (BTC) attempts to reclaim the $84,000 barrier again, the flagship crypto risks closing the Month in red numbers. Some analysts suggest that BTC’s Q2 performance could mimic its 2017 rally.
Related Reading
Bitcoin Retests $84,000
A week ago, Bitcoin saw a star-of-week pump to retest the $88,000-$89,000 resistance zone. The flagship cryptocurrency surged to a two-week high of $88,765, hovering between the $85,000 to $88,000 price range for most of the week.
However, as the weekend approached, BTC lost its range, falling to $84,000 on Friday and continuing to dip over the next two days. Bitcoin saw an 8.2% weekly drop during the early Monday hours, hitting $81,278 before recovering.
After hitting its lowest price in two weeks, the largest crypto by market capitalization bounced from the range lows, nearing the key $84,000 barrier again. This zone has been a crucial resistance level since Bitcoin lost its post-November breakout range a month ago.
Since then, BTC has failed to maintain this level for significant periods. Amid the market correction, trader Daan Crypto Trades noted that Bitcoin has created another CME Gap, becoming the fifth consecutive week that a gap has been created due to price movement during the weekend, with all the previous ones being closed “relatively quickly.”
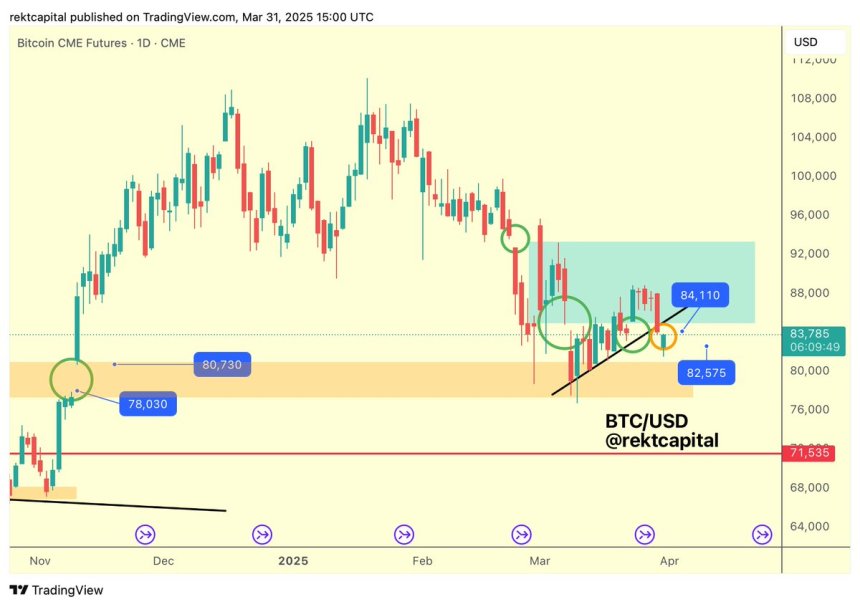
This week’s CME gap, between $82,500 and $84,100, was almost filled after this morning’s rally. However, analyst Rekt Capital pointed out, “BTC will need to rally more than that to try to seriously challenge for a reclaim of the recently lost Higher Low,” at around $85,000.
BTC To Consolidate For Longer?
Ted Pillows suggested BTC’s performance could see a Q2 recovery based on its 2017 price action. The analyst highlighted that during US president Donald Trump’s first term, Bitcoin’s “real rally” didn’t start until 2017’s second quarter.
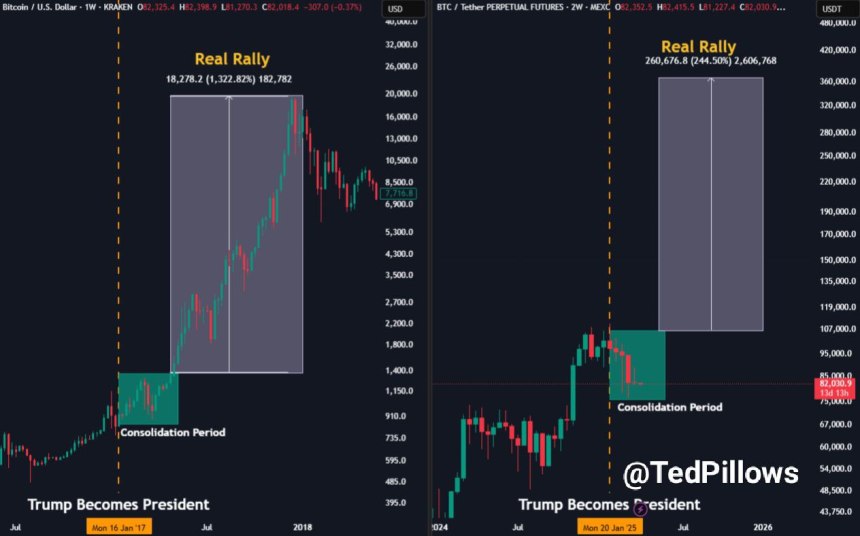
Per the post, “BTC’s real gains during Trump’s first presidency started after Q1 2027. For the first two months, BTC just consolidated in a range similar to now.” Then, it started to gain momentum in April, pumping from $1,400 to $20,000 until December 2017.
Ted considers that if Bitcoin continues to follow its 2017 path, it could see a massive rally toward a new all-time high (ATH) later this year. It’s worth noting that Q2 has historically been mostly favorable for BTC, CoinGlass data shows.
Meanwhile, Rekt Capital also suggested that Bitcoin will likely continue consolidating a little bit longer after the recent price correction. The analyst pointed out that BTC failed to confirm its breakout from its triangular market structure.
He previously explained that, over the past six weeks, BTC has been consolidating between the two biggest bull market Exponential Moving Averages (EMAs), the 21-week and 50-week EMAs, in a “very similar fashion to mid-2021.”
Related Reading
The analyst added that in mid-2021, “Bitcoin didn’t break from this similar triangular market structure right away either, upside-wicking towards and into the 21-week EMA but ultimately rejecting from there to experience additional consolidation between the two EMAs.”
This could suggest that the flagship crypto “is sentenced to a bit more consolidation between the two EMAs” before attempting to “kickstart an uptrend continuation towards the Re-Accumulation Range Low of $93,500.”
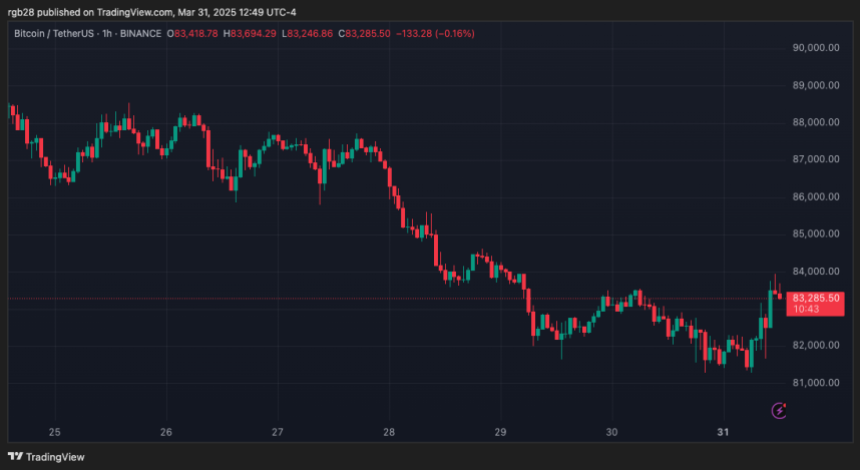
As of this writing, Bitcoin is trading at $83,297, a 1% increase in the daily timeframe.
Featured Image from Unsplash.com, Chart from TradingView.com
Source link
You may like


Crypto Trader Says Dogecoin Is at a Critical ‘Make-or-Break’ Level, Updates Outlook on Solana and Avalanche


Bitcoin Covenants: CHECKSIGFROMSTACK (BIP 348)


Illinois State Senator’s Bill Seeks to Claw Back $163 Million Lost to Crypto Fraud


Here’s why Bitcoin, altcoins, and the stock market continued falling on Friday


Bitcoin Falls Back to $83K, XRP, SOL, DOGE Surrender Gains as China Announces 34% Tariffs on All U.S. Goods


BTC Holds $84K, ATOM & FIL Become Top Gainers
Altcoin
Here’s why Bitcoin, altcoins, and the stock market continued falling on Friday
Published
4 hours agoon
April 4, 2025By
admin

Bitcoin, altcoins, and the stock market continued their downward trend on Friday as the trade war between the U.S. and China escalated.
Bitcoin (BTC) price dropped to $82,000, erasing some of the gains made during the Asian and European markets. Ethereum (ETH) dropped below $1,800, while the market cap of all coins fell to $2.64 trillion.
The stock market’s performance was even worse as futures tied to the Dow Jones, S&P 500, and Nasdaq 100 indices plunged by over 3%. This means that these blue-chip indices have all moved into a correction.
Trade war escalates
Bitcoin, altcoins, and equities declined after China announced its retaliatory measures against the U.S. In a statement, Beijing said it would impose a 34% tariff on all goods imported from the U.S.
In addition, China will restrict exports of certain rare earth minerals, halt sorghum imports from U.S. companies, and add 11 American firms to its unreliable entity list.
These measures mark the most significant response to Donald Trump’s Liberation Day tariffs. Other countries, especially those in Europe, have called for negotiations to prevent the trade war from expanding.
Trump and senior officials have warned that the U.S. will deliver reciprocal tariffs on any country that retaliates. They’ve urged trading partners to lower their tariffs and non-tariff barriers instead.
Therefore, Bitcoin, altcoins, and the stock market are falling as these actions lead to higher odds of a recession. Polymarket data shows that traders have boosted their recession odds to 56%. Companies like Goldman Sachs and PIMCO have also boosted their recession odds.
These fears have pushed market sentiment into extreme territory. The CNN Money Fear and Greed Index dropped to 6, the lowest reading since the onset of the COVID-19 pandemic.
Investor pessimism intensified after billionaire and former Bond King Bill Gross warned against buying the dip. He said:
“Investors should not try to ‘catch a falling knife. This is an epic economic and market event similar to 1971 and the end of the gold standard except with immediate negative consequences.”
Bitcoin, altcoins, and the stock market fall after NFP data
Markets also weakened after the U.S. released the latest nonfarm payrolls (NFP) report. The data showed that unemployment rose to 4.2% in March, up from 4.1% in February.
The economy added 228,000 jobs, beating analysts’ median forecast of 137,000. However, the manufacturing sector, which Trump aims to protect with his tariff policy, created just 1,000 jobs.
These figures will likely have minimal impact on the Federal Reserve, which remains focused on inflation and GDP growth.
Meanwhile, the bond market is signaling expectations of lower interest rates. The 10-year Treasury yield fell to 3.89%, while the 30-year and 2-year yields declined to 4.38% and 3.5%, respectively. If the Fed cuts rates, it would likely be bullish for Bitcoin, altcoins, and the broader stock market.
Source link
Bitcoin
Bitcoin Falls Back to $83K, XRP, SOL, DOGE Surrender Gains as China Announces 34% Tariffs on All U.S. Goods
Published
6 hours agoon
April 4, 2025By
admin

Risk sentiment worsened during the European hours Friday after China announced retaliatory tariffs on all goods, responding to Trump’s Wednesday decision to boost the overall levy on Chinese goods to 54%.
Bitcoin, the leading cryptocurrency by market value, fell by $1,600 to $83,000, erasing the early rise to $84,600, CoinDesk data shows. Other tokens like XRP, ETH, SOL and DOGE also reversed early gains to trade largely flat on the day.
Meanwhile, futures tied to the S&P 500 and Nasdaq fell over 2% amid escalating global trade tensions.
“China’s response is not only negative for the U.S. but it is also impacting the global outlook,” ForexLive’s analyst Justin Low wrote in a market update.
Source link
APT
Analysts Eye 20% Breakout If This Level Is Reclaimed
Published
8 hours agoon
April 4, 2025By
admin
Reason to trust

Strict editorial policy that focuses on accuracy, relevance, and impartiality
Created by industry experts and meticulously reviewed
The highest standards in reporting and publishing
Strict editorial policy that focuses on accuracy, relevance, and impartiality
Morbi pretium leo et nisl aliquam mollis. Quisque arcu lorem, ultricies quis pellentesque nec, ullamcorper eu odio.
Amid the market retrace, Aptos (APT) has seen an 8% decline in the past 24 hours, falling below a key support zone for the second time this week. Despite the correction, some analysts consider that the cryptocurrency could be poised for a breakout soon.
Related Reading
Aptos Loses Macro Range Lows
During the March retraces, Aptos fell below a crucial support level for the first time since August 2024 but recovered 24% near the end of the month. However, APT followed the rest of the market and dumped 11% to close the March below key levels.
Analyst Rekt Capital noted that APT closed last month below its Macro Range Low of $5.44 for the first time. The cryptocurrency has been trading within the $5.45-$17 price range since 2023, retesting the range lows two times before.
Historically, “APT tends to develop bases here in the form of downside wicks for three-month periods,” he explained, adding that the cryptocurrency seems to be developing a third three-month base, with the difference that it has closed below this range for the first time in the monthly timeframe.
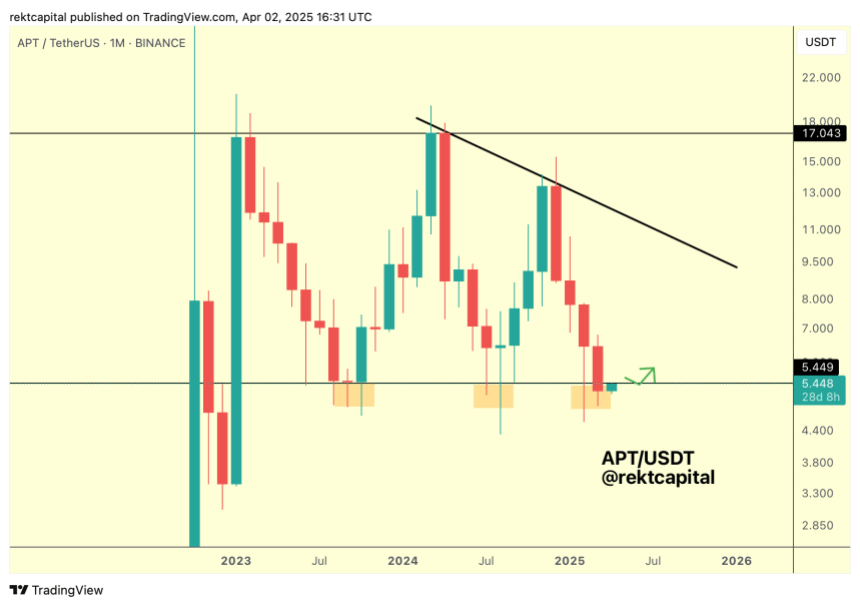
Following this performance, Aptos will need to reclaim the $5.44 level as support “to end this Monthly close as a downside deviation” and “avoid a bearish retest here.”
Previously, the analyst suggested that holding this level could reverse ATP’s price action in the coming months, as it has done with the other clusters. Additionally, he pointed out the previous consolidations included a “downside wicking below support.”
In his recent analysis, Rekt Capital considers that APT’s daily bullish divergence “is still something worth watching” as the cryptocurrency’s Relative Strength Index (RSI) continues to form Higher Lows despite the recent downside deviation, and its price “is trying to transition away from Lower Lows into a new Higher Low.”
According to the analyst, “a clear market structure is developing here, and a breakout from it would validate the Bull Div and set APT up for a reclaim of the Macro Range Low of $5.44,” which is key for a bullish rally.
APT To Reclaim $6.5 Resistance?
Analyst Sjuul from AltCryptoGems highlighted Aptos’ strength amid the market volatility, which saw Bitcoin (BTC) drop from $88,000 to $81,000 in the past 24 hours. APT dropped from the $5.40 mark to the $4.95 support.
The analyst considers that a retest of the local range lows could be necessary before the cryptocurrency aims for the next crucial level, as the current price zone has been tested many times.
Related Reading
Moreover, a reclaim of the $5.44 range could see the APT surge another 20% to the $6.5 resistance lost two months ago. Another market watcher suggested that Aptos is “showing potential for a bullish breakout as it trades within a descending channel.”
Per the chart, the cryptocurrency has been trading within a descending channel since early February, testing the channel’s lower and upper boundaries throughout March. “After testing the lower trendline, it may be finding support, and a break above the upper resistance will signal a significant rally,” the analyst concluded.
As of this writing, Aptos trades at $5.02, a 16.1% decline in the weekly timeframe.
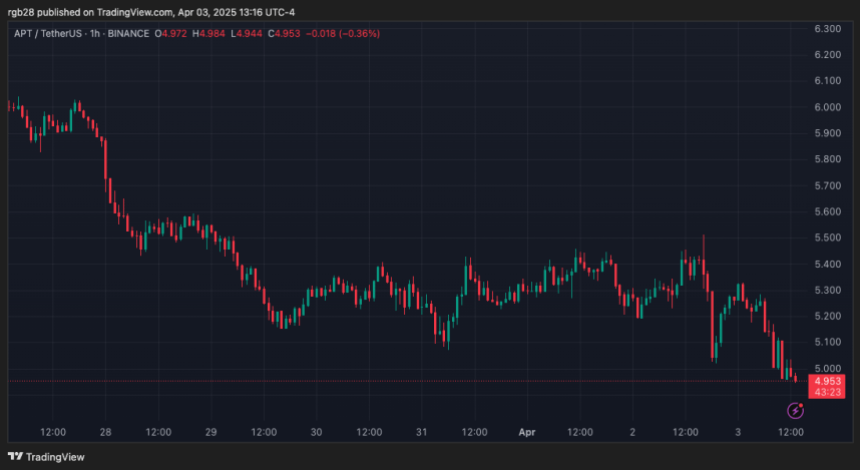
Featured Image from Unsplash.com, Chart from TradingView.com
Source link

Crypto Trader Says Dogecoin Is at a Critical ‘Make-or-Break’ Level, Updates Outlook on Solana and Avalanche

Bitcoin Covenants: CHECKSIGFROMSTACK (BIP 348)

Illinois State Senator’s Bill Seeks to Claw Back $163 Million Lost to Crypto Fraud

Here’s why Bitcoin, altcoins, and the stock market continued falling on Friday

Bitcoin Falls Back to $83K, XRP, SOL, DOGE Surrender Gains as China Announces 34% Tariffs on All U.S. Goods

BTC Holds $84K, ATOM & FIL Become Top Gainers

Analysts Eye 20% Breakout If This Level Is Reclaimed

AI and blockchain — A match made in heaven

‘We’re Still in Danger Territory’: Crypto Analyst Unveils Bearish Setup for Bitcoin – Here Are His Targets

Bitcoin Startups Raised Nearly $1.2 Billion

Illinois to End Lawsuit Against Coinbase Over Staking Program: Report

Justin Sun takes legal action against FDUSD issuer
Not a Meme! DePIN Can Take Crypto Mainstream

Cardano Price Can Clinch $1 As It Eyes Bounce From New Support Zone

Glassnode Finds XRP Is Retail’s Top Pick This Cycle

Arthur Hayes, Murad’s Prediction For Meme Coins, AI & DeFi Coins For 2025

Expert Sees Bitcoin Dipping To $50K While Bullish Signs Persist

Aptos Leverages Chainlink To Enhance Scalability and Data Access

Bitcoin Could Rally to $80,000 on the Eve of US Elections

Sonic Now ‘Golden Standard’ of Layer-2s After Scaling Transactions to 16,000+ per Second, Says Andre Cronje

Institutional Investors Go All In on Crypto as 57% Plan to Boost Allocations as Bull Run Heats Up, Sygnum Survey Reveals

Crypto’s Big Trump Gamble Is Risky

Ripple-SEC Case Ends, But These 3 Rivals Could Jump 500x

Has The Bitcoin Price Already Peaked?

A16z-backed Espresso announces mainnet launch of core product

Xmas Altcoin Rally Insights by BNM Agent I

Blockchain groups challenge new broker reporting rule

The Future of Bitcoin: Scaling, Institutional Adoption, and Strategic Reserves with Rich Rines

Trump’s Coin Is About As Revolutionary As OneCoin

Is $200,000 a Realistic Bitcoin Price Target for This Cycle?
Trending

 24/7 Cryptocurrency News5 months ago
Arthur Hayes, Murad’s Prediction For Meme Coins, AI & DeFi Coins For 2025

 Bitcoin3 months ago
Expert Sees Bitcoin Dipping To $50K While Bullish Signs Persist

 24/7 Cryptocurrency News3 months ago
Aptos Leverages Chainlink To Enhance Scalability and Data Access

 Bitcoin5 months ago
Bitcoin Could Rally to $80,000 on the Eve of US Elections

 Altcoins2 months ago
Sonic Now ‘Golden Standard’ of Layer-2s After Scaling Transactions to 16,000+ per Second, Says Andre Cronje

 Bitcoin5 months ago
Institutional Investors Go All In on Crypto as 57% Plan to Boost Allocations as Bull Run Heats Up, Sygnum Survey Reveals

 Opinion5 months ago
Crypto’s Big Trump Gamble Is Risky

 Price analysis5 months ago
Ripple-SEC Case Ends, But These 3 Rivals Could Jump 500x


