
Analyst
Bitcoin Price Retests Bullish Channel At $65,000, Analyst Reveals What’s Next

Crypto analyst MMBT Trader has revealed that the Bitcoin price is retesting a bullish channel at the $65,000 price level. He further mentioned what market participants should expect if the flagship crypto holds above or breaks below this bullish channel.
Bitcoin Price Retesting $65,000 And What Could Come Next
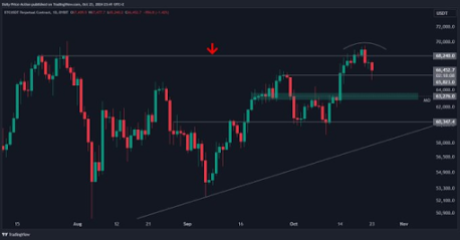
MMBT Trader mentioned in a TradingView post that the $65,000 support zone is now the major daily support, and market participants can expect a valid retest of the channel breakout. The analyst claimed that if the Bitcoin price holds this support, investors can expect a “heavy pump”, which could lead to a new all-time high (ATH).
Related Reading
However, if the Bitcoin price fails to hold the $65,000 bullish channel, such a breakout to the downside would lead to a free fall to the $60,000 support level. MMBT Trader even suggested the possibility of BTC retesting $50,000 if it fails to hold above $65,000. Meanwhile, a breakdown means that the flagship crypto could range for a while before it makes another attempt to break its ATH at $73,000.
Analyst Justin Bennett also recently highlighted the $65,800 range as the first test for the Bitcoin price. He had also indicated that BTC could drop to around $63,000 if it fails to hold above this level. However, a successful hold above this price range would invalidate his trade setup.
The Bitcoin price has so far held well above $65,000 since it again reclaimed $67,000 after the price crash two days ago. However, Bennett indicated that BTC isn’t yet in the clear despite the bounce on October 23. He claimed there is no confirmed bottom as long as the flagship crypto is below $68,200.
BTC Needs A Weekly Close Above This Level
In an X post, crypto analyst Rekt Capital mentioned that a weekly close above $66,200 would be confirmed as a successful retest. He noted that the flagship crypto was showing promising signs so far, having already produced a wick below the $66,200 price level and returned above it.
Related Reading
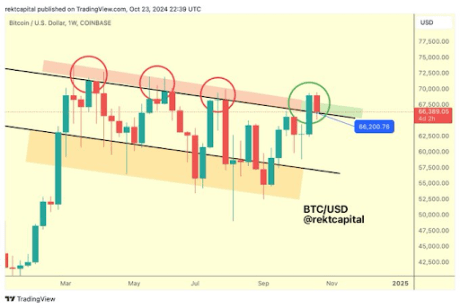
His accompanying chart showed that the Bitcoin price drop below $66,200 before the weekly close could lead to further breakdown below the $60,000 support level.
Meanwhile, bear analyst CrediBULL Crypto predicted that the Bitcoin price could retest the $68,000 range to “bait in some final longs” before it suffers a “rug pull” to the $60,000 support level. The analyst is one of those who believe that it is still too soon to call for a new ATH for BTC based on his belief that the flagship crypto still needs to retest the lower range.
At the time of writing, the Bitcoin price is trading at around $67,000, up in the last 24 hours, according to data from CoinMarketCap.
Featured image created with Dall.E, chart from Tradingview.com
Source link


The Bitcoin price has dropped below the $100,000 psychological level and is now holding between the $96,000 and $98,000 range. Crypto analyst Ali Martinez provided insights into why Bitcoin could be holding well within this range.
Why The Bitcoin Price Is Holding Steady Between $96,000 And $98,000
In an X post, Ali Martinez noted that one of the most important support levels for the Bitcoin price is between $98,830 and $95,830, where 1.09 wallets bought over 1.16 million BTC. This explains why Bitcoin is holding steady between $96,000 and $98,000 as investors who bought between this level continue to provide huge support for the flagship crypto.
Related Reading
As Martinez suggested, it is important for these holders to continue to hold steady as a wave of sell-offs could send the Bitcoin price tumbling even below $90,000. The flagship crypto dropped below $100,000 following the Federal Reserve Jerome Powell’s recent speech, in which he hinted at a hawkish stance from the US Central Bank.
This sparked a massive wave of sell-offs, as a Hawkish Fed paints a bearish picture for risk assets like Bitcoin. However, despite the Bitcoin price drop below, most Bitcoin holders remain in profit, which is a positive for the flagship crypto. IntoTheBlock data shows that 86% of Bitcoin holders are in the money, 4% are out of the money, and 9% are at the money.
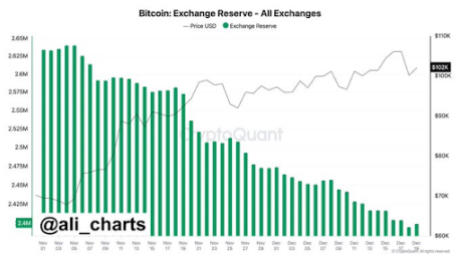
These Bitcoin holders still seem bullish on the leading crypto as they continue to accumulate more BTC. In an X post, Ali Martinez stated that so far in December, 74,052 BTC have been withdrawn from exchanges, and this trend doesn’t seem to be slowing down.
Traders Anticipate A Bullish Reversal
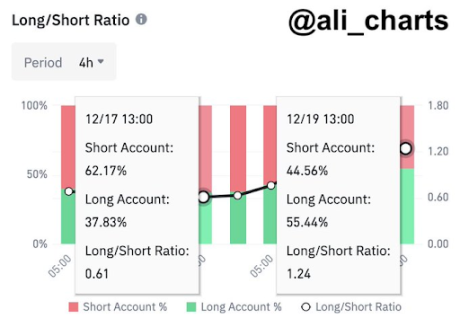
Ali Martinez suggested that crypto traders anticipate a bullish reversal for the Bitcoin price from its current level. This came as he revealed that traders on Binance nailed the top, with 62.17% shorting Bitcoin while it was trading at $108,000. Now, Martinez stated that sentiment has flipped, with 55.44% of these trading now longing dips below $96,000.
Related Reading
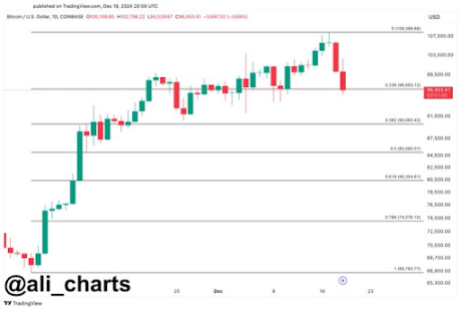
Meanwhile, it is crucial for the Bitcoin price to hold this $96,000, as Martinez warned that if BTC loses this support, it could drop below $90,000. The analyst stated that based on the Fibonacci level, if Bitcoin loses $96,000, the next point of focus becomes $90,000 and $85,000. Meanwhile, from a bullish perspective, crypto analyst Justin Bennett suggested that the $110,000 target is still in focus for the Bitcoin price.
At the time of writing, the Bitcoin price is trading at around $97,000, down over 3% in the last 24 hours, according to data from CoinMarketCap.
Featured image created with Dall.E, chart from Tradingview.com
Source link

The Ethereum price could face some turbulence, as Justin Sun, the founder of Tron (TRX), has unstaked a whopping $209 million from Lido Finance, a liquid decentralized staking platform for Ethereum. Compared to top cryptocurrencies like Bitcoin (BTC) and Dogecoin (DOGE), the Ethereum price has had a relatively muted performance, skyrocketing to $4,000 before consolidating and struggling to move higher. With the possibility of more sell-offs, Ethereum could see its price crashing down if Sun decides to dump more coins.
Justin Sun Dumps ETH
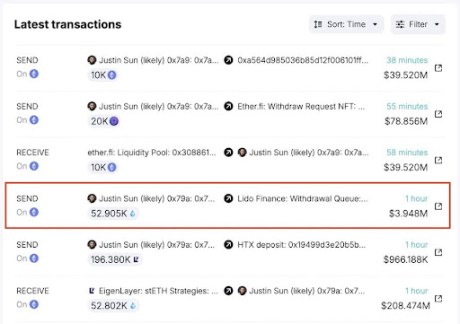
New reports from Spot On Chain, an AI-driven crypto platform, revealed that Sun recently applied to withdraw a staggering 52,905 ETH tokens worth about $209 million from Lido Finance. According to the on-chain data, this massive withdrawal was part of the ETH stash Sun allegedly accumulated between February and August 2024.
Spot On Chain has revealed that the total amount of Ethereum Sun bought within this period amounted to 392,474 ETH tokens, valued at $1.19 billion. All of these tokens were purchased via three wallet addresses at an average price of $3,027. Presently, the total profit the Tron founder has acquired since his purchase is up to $349 million, representing a 29% increase from its purchasing price.
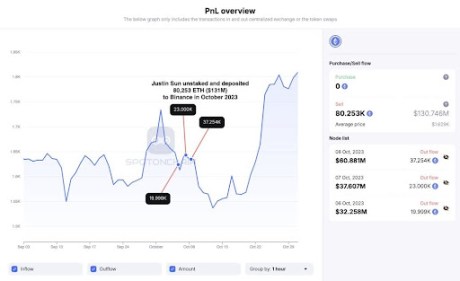
Interestingly, on October 24, Sun had unstaked a massive 80,251 ETH tokens, worth over $131 million, from Lido Finance. Four days later, he transferred the entire amount to Binance, the world’s largest crypto exchange. This notable move took place just before the price of Ethereum had dropped sharply by 5% in mid-October, which could have resulted in a loss for Sun.
Unsurprisingly, this is not the first time Sun has dumped Ethereum. Spot On Chain revealed earlier this month that the Tron Founder had been cashing in his Ethereum holdings during the market rally.
In November, Sun deposited 19,000 ETH worth $60.83 million to HTX, a crypto exchange. Additionally, he transferred 29,920 ETH valued at $119.7 million to HTX again after its price surpassed $4,000 over the past week. These are just a few transactions the Tron founder has made with ETH over the past month.
Given Sun’s history of large-scale asset movements, further sell-offs could impact the already fragile Ethereum market. Nevertheless, the lingering question remains whether the Tron founder will continue his Ethereum dumping spree.
Ethereum Price Crash Ahead?
While Sun has not publicly commented on his recent large-scale Ethereum withdrawals, the size and timing of these transactions could pose a problem for the altcoin’s future trajectory. Historically, large ETH liquidations have triggered a price crash due to increasing selling pressures.
Related Reading
With the price of Ethereum still unstable and aiming for a stronger upward rally, further large-scale ETH dumps could exacerbate market volatility, especially if other investors or whales follow suit. For now, the price of Ethereum seems to be performing well, recording a more than 7% increase in the last seven days and a 28% surge over the past month, according to CoinMarketCap.
Featured image created with Dall.E, chart from Tradingview.com
Source link
Analyst
This Analyst Correctly Predicted The Bitcoin Flash Crash To $94,000, But There’s A New Target

Following an earlier prediction of the Bitcoin flash crash to $94,000, a crypto analyst has set a new target for the pioneer cryptocurrency. The analyst anticipates another major decline in the Bitcoin price before it hits a new all-time high.
$130,000 Target In Sight After Bitcoin Flash Crash
The broader crypto market has undergone a significant correction sparked by the recent Bitcoin flash crash. In the past week, the price of Bitcoin lost $3,000 in less than 30 minutes, dropping from $97,000 to $94,000 before quickly rebounding back above $97,000. This unexpected flash crash triggered widespread liquidations, with more than $1.5 billion in long and short positions wiped out as traders scrambled to mitigate losses.
Related Reading
With Bitcoin currently showing signs of momentum, analysts have voiced expectations of a future price rally. Notably, a TradingView crypto analyst, identified as ‘Setupsfx,’ shared a detailed price chart predicting Bitcoin’s future movements and next target.
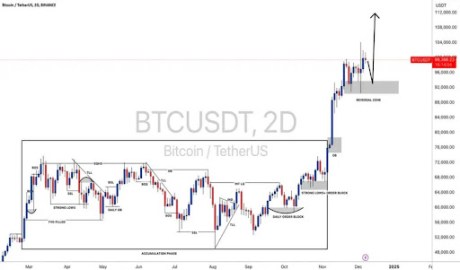
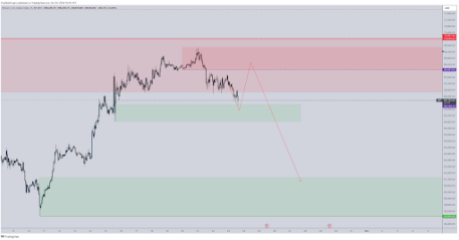
The analyst accurately forecasted Bitcoin’s flash crash to $94,000 and has now expanded his predictions to include a potential recovery phase. According to his latest analysis, Bitcoin is expected to find strong support around the $96,000 level following a short-term price correction to this key zone. This new support level is seen as a healthy retracement to help build momentum for upward movement.
The analyst’s chart depicts an accumulation phase on the left side, during which prices seem to be moving sideways, forming strong lows while filling Fair Value Gaps (FVG). Additionally, order blocks and Breaks of Structure (BOS) can be identified on the Bitcoin price chart.
According to the chart, the Bitcoin price successfully broke out of the aforementioned accumulation zone and started a rally that led to its ATH above $100,000. This bullish momentum aligns with the hype from the US Presidential election, which fueled Bitcoin’s rise to a new all-time high.
With this in mind, the analyst predicts that Bitcoin will experience another pullback, likely testing the $96,000 zone before a price reversal. This reversal is expected to ignite a fresh rally, potentially pushing Bitcoin toward a new target of $130,000.
Update On BTC Price Action
At the time of writing, the Bitcoin price is trading at $97,223 after dropping by more than 2% in the last 24 hours, according to CoinMarketCap. The cryptocurrency has been trading below the $100,000 level following a slight pullback after hitting an ATH above $104,000.
Related Reading
The broader market sentiment has also turned bullish despite the recent Bitcoin price decline. Notably, Bitcoin’s trading volume has risen by 99% in the last 24 hours, and its market cap is approaching the $2 trillion milestone.
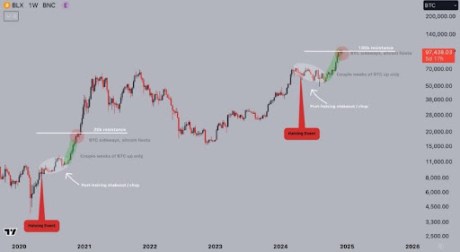
Commenting on Bitcoin’s price action, crypto analyst Jelle disclosed that Bitcoin’s current price action closely mirrors its bullish behavior during the 2020 ATH breakout. Based on these similar price movements, the analyst predicts that Bitcoin could see another breakout soon if it maintains this bullish momentum.
Featured image created with Dall.E, chart from Tradingview.com
Source link

Metaplanet makes largest Bitcoin bet, acquires nearly 620 BTC

Tron’s Justin Sun Offloads 50% ETH Holdings, Ethereum Price Crash Imminent?

Investors bet on this $0.0013 token destined to leave Cardano and Shiba Inu behind

End of Altcoin Season? Glassnode Co-Founders Warn Alts in Danger of Lagging Behind After Last Week’s Correction

Can Pi Network Price Triple Before 2024 Ends?

XRP’s $5, $10 goals are trending, but this altcoin with 7,400% potential takes the spotlight

CryptoQuant Hails Binance Reserve Amid High Leverage Trading

Trump Picks Bo Hines to Lead Presidential Crypto Council

The introduction of Hydra could see Cardano surpass Ethereum with 100,000 TPS

Top 4 Altcoins to Hold Before 2025 Alt Season

DeFi Protocol Usual’s Surge Catapults Hashnote’s Tokenized Treasury Over BlackRock’s BUIDL

DOGE & SHIB holders embrace Lightchain AI for its growth and unique sports-crypto vision

Will Shiba Inu Price Hold Critical Support Amid Market Volatility?

Chainlink price double bottoms as whales accumulate

Ethereum Accumulation Address Holdings Surge By 60% In Five Months – Details
182267361726451435
Why Did Trump Change His Mind on Bitcoin?

Top Crypto News Headlines of The Week

New U.S. president must bring clarity to crypto regulation, analyst says

Will XRP Price Defend $0.5 Support If SEC Decides to Appeal?

Bitcoin Open-Source Development Takes The Stage In Nashville

Ethereum, Solana touch key levels as Bitcoin spikes

Bitcoin 20% Surge In 3 Weeks Teases Record-Breaking Potential

Ethereum Crash A Buying Opportunity? This Whale Thinks So

Shiba Inu Price Slips 4% as 3500% Burn Rate Surge Fails to Halt Correction

Washington financial watchdog warns of scam involving fake crypto ‘professors’

‘Hamster Kombat’ Airdrop Delayed as Pre-Market Trading for Telegram Game Expands

Citigroup Executive Steps Down To Explore Crypto
Mostbet Güvenilir Mi – Casino Bonus 2024

NoOnes Bitcoin Philosophy: Everyone Eats

 3 months ago
182267361726451435

 Donald Trump5 months ago
Why Did Trump Change His Mind on Bitcoin?
 24/7 Cryptocurrency News4 months ago
Top Crypto News Headlines of The Week
 News4 months ago
New U.S. president must bring clarity to crypto regulation, analyst says
 Price analysis4 months ago
Will XRP Price Defend $0.5 Support If SEC Decides to Appeal?
 Opinion5 months ago
Bitcoin Open-Source Development Takes The Stage In Nashville
 Bitcoin5 months ago
Ethereum, Solana touch key levels as Bitcoin spikes
 Bitcoin5 months ago
Bitcoin 20% Surge In 3 Weeks Teases Record-Breaking Potential
