
Bitcoin
Bitcoin The Ultimate Hedge Against $97T Global Liquidity Bubble

In the intricate dance of global finance, few metrics are as telling as the M2 money supply—a measure of global liquidity. Currently sitting at a staggering $97 trillion and climbing, this figure encapsulates the vast flow of cash, deposits, and near-money circulating across the global economy. For Bitcoin investors, this metric is far more than an academic curiosity; it’s a compass guiding market sentiment and price trends.
Global M2 money supply is at $97T and increasing.
One of the most important charts to watch for the remainder of this cycle

— Bitcoin Magazine Pro (@BitcoinMagPro) January 29, 2025

What is Global Liquidity?
Global liquidity, often equated with M2 money supply, represents the total volume of currency and near-money available in the financial system. This includes physical cash, checking and savings deposits, money market accounts, retail mutual funds, and short-term time deposits under $100,000. Importantly, M2 reflects not just static wealth but the fluid potential for spending and investing.
The Central Banks Driving Liquidity
Global liquidity isn’t monolithic. It’s the aggregate result of monetary policies from the world’s most influential central banks:
- USA: Federal Reserve
- China: People’s Bank of China
- EU: European Central Bank
- UK: Bank of England
- Japan: Bank of Japan
- Canada: Bank of Canada
- Russia: Bank of Russia
- Australia: Reserve Bank of Australia
When these central banks lower interest rates or implement quantitative easing (QE) measures, such as purchasing government bonds and securities, they effectively inject fresh liquidity into the global financial system. As liquidity expands, it opens the door for increased spending and investment in risk assets, including Bitcoin.
Related: How Declining Short-Term U.S. Treasury Yields Impact Bitcoin Price
Why Investors Should Care
For strategic investors, tracking global liquidity is akin to weather forecasting for the financial markets. Historically, Bitcoin bull markets have coincided with periods of rapid global liquidity expansion. The logic is straightforward: when central banks flood the system with cash, investors are emboldened to seek higher-yielding opportunities in safe-haven assets like Bitcoin.
Bitcoin’s appeal as a non-correlated, deflationary asset makes it uniquely positioned in this environment. Unlike fiat currencies, which central banks can create in unlimited quantities, Bitcoin operates on a fixed monetary schedule capped at 21 million coins. This scarcity is a direct contrast to the seemingly limitless expansion of M2, reinforcing Bitcoin’s narrative as “digital gold.”
The $97 Trillion Marker: A Call to Action
The $97 trillion global M2 supply underscores the relentless expansion of fiat liquidity. While this might seem like an abstract figure, its implications are very tangible for Bitcoin investors. Here’s why:
- Liquidity-Driven Price Momentum: Increased liquidity has historically aligned with Bitcoin’s most explosive growth phases. Investors who monitor these trends gain a crucial edge in timing their market entries.
- Hedge Against Inflation: As central banks expand liquidity to manage economic downturns, the purchasing power of fiat currencies erodes. Bitcoin’s fixed supply serves as a hedge against this debasement.
- Institutional Adoption: As professional and institutional investors increasingly integrate Bitcoin into portfolios, monitoring global liquidity becomes essential for aligning strategies with macroeconomic conditions.
Related: What Bitcoin Price History Predicts for February 2025
Looking Ahead: The Bitcoin Opportunity
Bitcoin’s relationship with global liquidity isn’t just a trend; it’s a testament to its maturation as a financial asset. For those who view Bitcoin as an alternative to traditional financial systems, the current $97 trillion liquidity landscape presents a compelling backdrop.
As central banks continue to grapple with economic uncertainties, Bitcoin remains a beacon for investors seeking transparency, predictability, and security in an unpredictable world. The rising tide of global liquidity isn’t just a narrative; it’s an invitation to reevaluate Bitcoin’s role in your investment strategy.
Now is the time to harness the power of data and foresight. Monitor liquidity. Watch Bitcoin. Invest strategically.
For ongoing access to live data, advanced analytics, and exclusive content, visit BitcoinMagazinePro.com.
Disclaimer: This article is intended for informational purposes only and does not constitute financial advice. Readers are encouraged to conduct thorough independent research before making investment decisions.
Source link


Bitcoin
Why Is the Crypto Market Down Today? Bitcoin Drops to $82K as Traders Flee Risk Assets Amid Macro Worries

Cryptocurrency prices have experienced a sharp decline over the last few hours, with bitcoin (BTC) now being down around 3% over the last 24 hours, while major altcoins including XRP, BNB, and SOL are down between 4% and 5% over the same period.
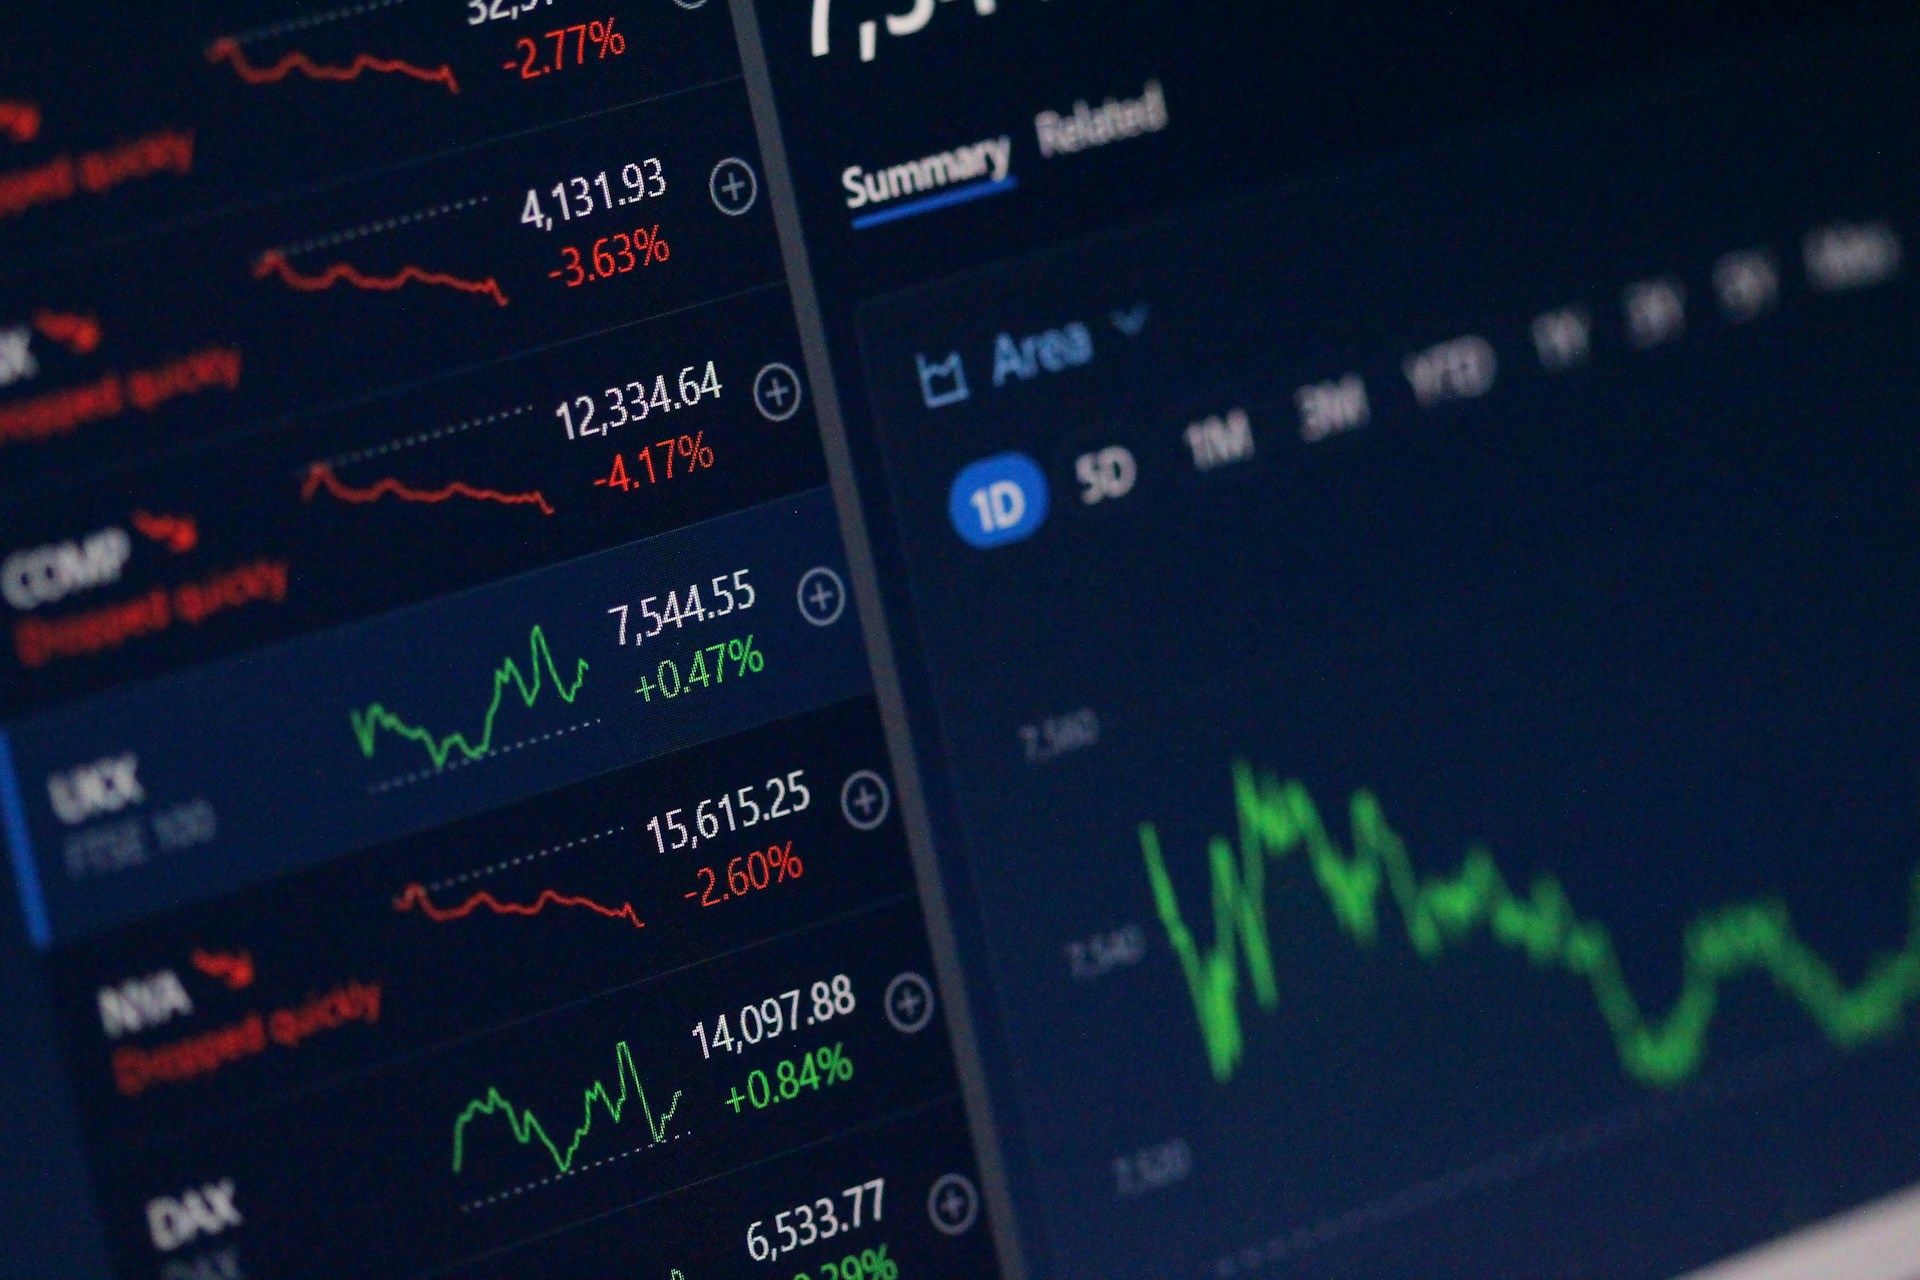
The broader cryptocurrency market, represented by the CoinDesk 20 Index (CD20), lost around 3.3% of its value over the period. The sharp drop brings BTC’s performance down 1.7% for the week, while CD20 is down nearly 5%.
Over the last 24 hours, over $300 million worth of long positions were liquidated on centralized cryptocurrency exchanges, while $38.8 million worth of shorts were liquidated on these platforms, according to CoinGlass data.
The drop appears to be part of a wider derisking move among traders, as investors are anticipating the impact of President Donald Trump’s reciprocal tariffs that are set to come into effect on April 2. The move heightened after core Personal Consumption Expenditures (PCE) data came in hotter than expected on Friday.
Just this week, consumer confidence data dipped further than expected, while the index for future expectations came in at a 12-year low, and well below levels associated with an incoming recession.
This confluence of factors has seen investors reduce their exposure to risk assets and triggered a flight to safety. CoinDesk Data’s latest stablecoin report shows that gold-backed cryptocurrencies have benefitted from the risk-off move, as their market capitalization climbed above $1.4 billion in March.
Gold-backed cryptocurrencies are, in fact, countering the market’s bearish trend. While the CD20 is down over 3% in the last 24-hour period, tokens including PAXG and XAUT are up 0.7% to over $3,100. These tokens are up more than 18% year-to-date, while BTC is down 12.5% and the CD20 index 28% so far this year.
Source link
Disclosure: The views and opinions expressed here belong solely to the author and do not represent the views and opinions of crypto.news’ editorial.
Bitcoin (BTC) has always been the face of crypto, the first thing that comes to mind when you think of this market. But for years, its role has been largely static—held as a store of value, yet rarely used for anything else. Then BTCFi entered the scene: unlike traditional DeFi, which has been dominated by Ethereum (ETH) and other smart contract platforms, BTCFi is built around Bitcoin as the core asset.
In the last quarter of 2024, BTCFi’s total value saw a massive surge—from $800 million all the way to $6.5 billion. The momentum is impressive, to say the least. More institutional players are taking notice, and analysts predict that by 2030, roughly 2.3% of Bitcoin’s circulating supply (about $47 billion) could be actively used in decentralized finance.
So clearly, BTCFi is not just a passing trend. But why is it gaining so much traction? Can it really be called the future of Bitcoin’s utility as a financial asset?
Let’s try to figure it out.
What is BTCFi, and why is it growing now?
BTCFi represents the intersection of Bitcoin and decentralized finance, with the first crypto playing the role of the core asset in this case. Typically, DeFi platforms have been built on blockchains like Ethereum, while Bitcoin holders had to wrap their BTC into ERC-20 tokens (like wBTC) to participate in this field.
This kind of tokenization started picking up the pace around 2020, allowing BTC holders to access DeFi services that are typically not available on the Bitcoin blockchain. These “wrapped” tokens are built in a way that makes them compatible with other blockchain networks. And so, they effectively extended Bitcoin’s functionality.
However, advancements in Bitcoin L2 solutions and LRTs, or layered rollup technologies, are now changing the rules. It is becoming unnecessary for Bitcoin to use “second class citizen” ERC-20 tokens anymore.
BTC LRTs, for example, operate on Ethereum and other chains as well, but use Bitcoin as the primary collateral in transactions. This means unlocking the use of Bitcoin as a yield-generating asset in other networks beyond its native chain.
The emerging Bitcoin L2s, meanwhile, are tackling this blockchain’s long-standing scalability issues, allowing for faster and more cost-efficient transactions. These innovations are going to fundamentally redefine Bitcoin, turning it from a passive store of value to an actively utilized financial asset.
Why is BTCFi the gateway for Bitcoin whales in 2025?
Large Bitcoin holders—miners, in particular—have often used CeFi loans backed by their BTCs to fund their operations since they didn’t want to outright sell those assets. This practice is still going on today, but BTCFi promises to make some changes. And that’s where everything will start from, really: by BTCFi enabling new opportunities for Bitcoin holders to put their assets to work.
Soon enough, Bitcoin whales will start looking at BTCFi as a powerful gateway that can be used to enter the DeFi space. And the way I see it, there are two key factors in 2025 that will influence that perception.
The first is the rise of Bitcoin ETFs. BTC ETFs currently account for almost 6% of all Bitcoin supply, having crossed $100 billion in holdings at the beginning of 2025. With them gaining mainstream traction, Bitcoin is increasingly perceived as the safest and most stable cryptocurrency asset.
This makes it a prime choice for DeFi, attracting large-scale holders who want to use their BTC without selling. Earlier in February this year, Goldman Sachs announced that it had invested $1.63 billion in Bitcoin ETFs. That’s easy proof right there.
The second major factor is the appearance of BTC L2 technologies, which we’ve already covered earlier. Until recently, the lack of scalability and transaction efficiency held Bitcoin back from DeFi adoption. Now, we are going to see a surge of L2 solutions that will enhance the network’s performance. And here’s the important part: they will do so while preserving Bitcoin’s core principles of decentralization and simplicity (and, hence, its robustness).
What DeFi platforms need to do for proper BTCFi integration
There are several challenges that will need to be overcome before BTCFi can achieve truly seamless integration. The biggest technical issue will be ensuring that Bitcoin-based L2 solutions become genuinely trustless. At the present time, they are not quite there, often relying on intermediaries and centralized elements, which goes against Bitcoin’s core philosophy.
The good news is that there’s a lot of R&D going on to make it happen. If successful, it could make the vast amounts of BTCs that are currently just lying there “collecting dust” be useful in DeFi.
Another big challenge is going to stem from people’s trust. Among Bitcoin holders, there are many who do not quite trust Ethereum and the existing Bitcoin tokenization methods. The key to winning them over will lie in creating robust and cost-effective solutions on the native Bitcoin network. Having a fully trustless and inexpensive execution layer on the BTC blockchain could really become the dealbreaker for these people.
The future of Bitcoin: More than just ‘digital gold’
For years, Bitcoin has been carrying the moniker of “digital gold”—a safe-haven asset meant for holding rather than using. These days, this is becoming increasingly untrue. As more institutional players enter the crypto space, the potential for BTCFi to become Bitcoin’s next-level evolution is very real.
The demand is on the rise, and the infrastructure is already being built. For Bitcoin whales looking to maximize their assets without selling, BTCFi could become the perfect answer.
Disclosure: This article does not represent investment advice. The content and materials featured on this page are for educational purposes only.

Source link


Bitcoin mining company MARA Holdings (MARA) is launching a fresh $2 billion stock offering to buy more bitcoin, continuing its plan of buying BTC in the open market through capital raise while sticking to its “Hodl” strategy.
According to a Form 8-K and a new prospectus filed with the U.S. Securities and Exchange Commission (SEC), MARA entered into an at-the-market (ATM) equity program with a group of investment banks including Barclays, BMO Capital Markets, BTIG, Cantor Fitzgerald, and others. The proceeds of the offering, which will see brokers selling shares of the miner from time to time, will be used mainly for the acquisition of bitcoin in the open market.
“We currently intend to use the net proceeds from this offering for general corporate purposes, including the acquisition of bitcoin and for working capital,” MARA said in its prospectus.
This new fresh stock sales plan follows a previous ATM offering that targeted up to $1.5 billion for the miner.
MARA has adopted Michael Saylor’s strategy of raising funds through equity and convertible bond offerings and buying bitcoin in the open market. The miner now holds 46,376 BTC in its treasury, making it the second-largest bitcoin stash among publicly traded companies, behind Strategy’s 506,137 BTC.
The plan to buy bitcoin in the open market was adopted by the miner last year, even though a miner can theoretically mine bitcoin at a discount to the spot price. The industry became challenging after last year’s halving cut mining rewards by half, squeezing profit margins on the back of rising costs. This made buying bitcoin in the open market, alongside mining, a relatively better strategy for the miners.
Read more: Bitcoin Mining Is So Rough a Miner Adopted Michael Saylor’s Successful BTC Strategy
Source link

Why Is the Crypto Market Down Today? Bitcoin Drops to $82K as Traders Flee Risk Assets Amid Macro Worries

BTCFi: From passive asset to financial powerhouse?

Hyperliquid Delists $JELLY, Potentially Causing $900K in Losses. Here’s Why Best Wallet Token Can 100x

Cryptocurrencies to Sell Fast if Bitcoin Price Plunges Below $80K

‘Extremely High’ Odds of V-Shaped Recovery for Stock Market, According to Fundstrat’s Tom Lee

Is XRP price around $2 an opportunity or the bull market’s end? Analysts weigh in

What is Dogwifhat (WIF)? The Solana Dog Meme Coin With a Hat

Ethereum’s time is ‘meow?’ Vitalik Buterin video go ‘vrial’

Bitcoin Miner MARA Starts Massive $2B At-the-Market Stock Sale Plan to Buy More BTC

Paul Atkins “Conflict of Interest” Triggers $220M Withdrawals from Ripple Markets

Bitcoin CME Gap Close About To Happen With Push Toward $83k

Listing an altcoin traps exchanges on ‘forever hamster wheel’ — River CEO

Nasdaq Files To Launch a New Grayscale Avalanche (AVAX) Exchange-Traded Fund

How To Measure The Success Of A Bitcoin Treasury Company

Why ‘Tiger King’ Joe Exotic Launched a Solana Meme Coin From Behind Bars


 24/7 Cryptocurrency News5 months ago
Arthur Hayes, Murad’s Prediction For Meme Coins, AI & DeFi Coins For 2025

 Bitcoin2 months ago
Expert Sees Bitcoin Dipping To $50K While Bullish Signs Persist

 24/7 Cryptocurrency News3 months ago
Aptos Leverages Chainlink To Enhance Scalability and Data Access

 Bitcoin5 months ago
Bitcoin Could Rally to $80,000 on the Eve of US Elections

 Altcoins2 months ago
Sonic Now ‘Golden Standard’ of Layer-2s After Scaling Transactions to 16,000+ per Second, Says Andre Cronje

 Bitcoin5 months ago
Institutional Investors Go All In on Crypto as 57% Plan to Boost Allocations as Bull Run Heats Up, Sygnum Survey Reveals

 Opinion5 months ago
Crypto’s Big Trump Gamble Is Risky

 Price analysis5 months ago
Ripple-SEC Case Ends, But These 3 Rivals Could Jump 500x
