cryptocurrency
Bittensor Price Prediction 2024-2030 | Is TAO crypto a Good Investment?
Published
4 months agoon
By
admin
AI tokens are seeing a price surge in anticipation of NVIDIA’s upcoming quarterly earnings report.
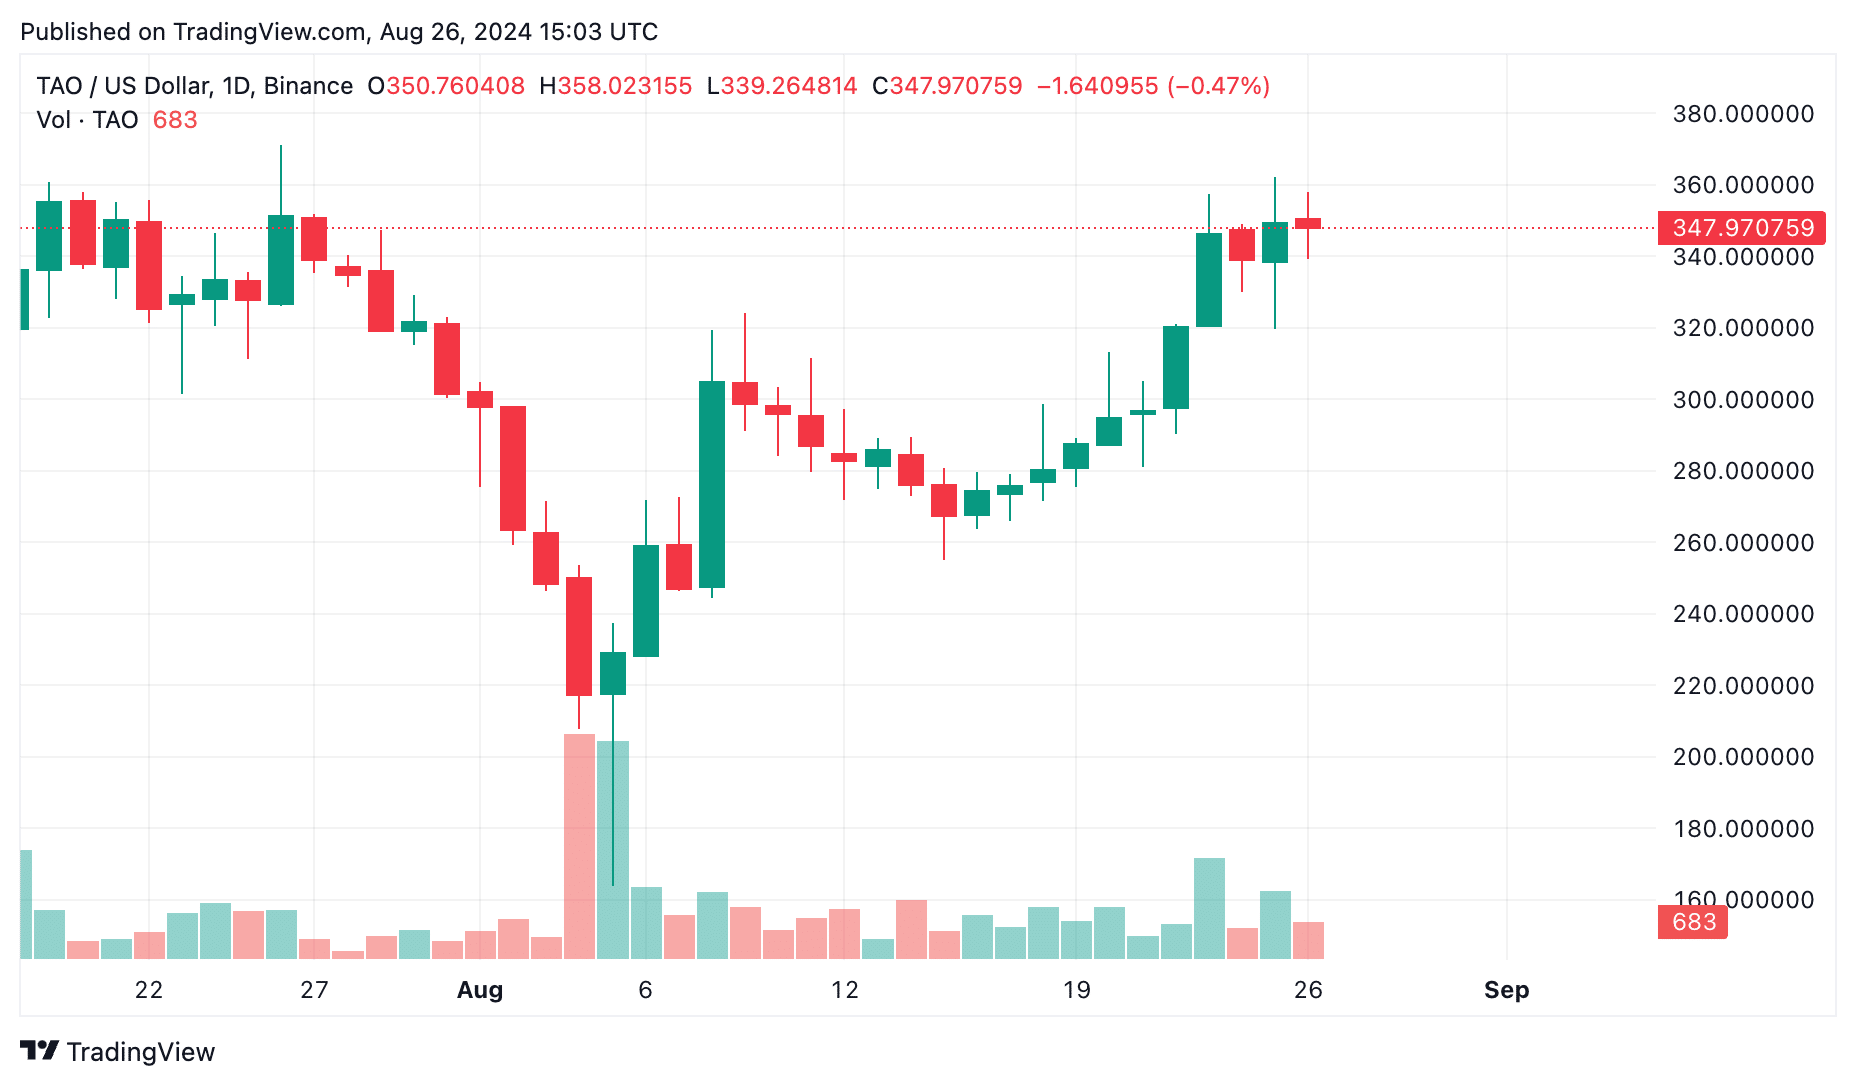
Over the past week, Bittensor (TAO), the native token of the decentralized AI development platform Bittensor, has risen by approximately 25%. As of today, Aug. 26, 2024, it is trading at around $345.5, with a slight 0.16% drop in the last 24 hours. Over the past year, the token’s price has jumped by 469.1%. According to crypto.news, TAO ranks 39th among cryptocurrencies by market capitalization, which exceeds $2.51 billion.
TAO is rising in anticipation of NVIDIA’s quarterly earnings report, set to be released on Wednesday. AI tokens are likely influenced by the growing demand for data centers essential for running AI chatbots.

What’s next for TAO? Will it surpass its previous all-time high of $767.68? Check out our Bittensor price prediction for 2024-2030.
What is Bittensor
Bittensor connects AI and machine learning through a decentralized approach. It’s a peer-to-peer network that leverages blockchain tokens to drive the development and adoption of AI innovations.

TAO is the native token of Bittensor. It drives user participation and streamlines how they trade resources on the Bittensor platform. What is the TAO crypto price prediction for the short and long term?
Bittensor coin price prediction: short-term outlook
According to CoinCodex’s Bittensor price prediction, TAO’s price is expected to increase by 226.71%, potentially reaching a new all-time high of $1131.7 (!) by Sept. 25, 2024.
As of Aug. 26, 2024, the overall sentiment for the Bittensor price forecast remains bullish, with 22 technical analysis indicators showing bullish signals and 5 indicating bearish trends.
Bittensor price prediction 2024
According to DigitalCoinPrice, investors, exporters, and market experts believe that TAO will surpass its previous high of $767.68 in 2024. They predict it will then stabilize between $731.57 and $767.79.
Based on CoinCodex’s expectations for the Bittensor token, it is anticipated to trade between $346.39 and $1629.21 this year. If it hits the upper end of this range, TAO could experience a rise of 368.58%.
Wallet Investor forecasts that by the end of 2024, TAO could achieve a maximum price of $629.482.
Bittensor price prediction 2025
DigitalCoinPrice suggests that in 2025, the price of TAO could fluctuate between $749.51 and $894.36, with the most likely value stabilizing around $848.42 by year’s end.
CoinCodex’s forecast for 2025 aligns with its projection for 2024.
According to Wallet Investor’s Bittensor price prediction for 2025, TAO could potentially trade at $956.384.
Bittensor price prediction 2030
CoinCodex estimates that by 2030, TAO’s price could vary between $864.97 and $1402.48.
DigitalCoinPrice predicts that TAO’s price could climb to $2356.6 or even $2511.46 by the end of 2030. The years from 2024 to 2030 are expected to be key for the growth of Bittensor.
Disclosure: This article does not represent investment advice. The content and materials featured on this page are for educational purposes only.
FAQs
Should I invest in Bittensor tokens?
AI tokens are gaining traction as a promising investment trend. Bittensor, in particular, presents exciting growth opportunities, and the optimistic future price predictions for TAO — both in the short and long term — make it a compelling option for those looking to diversify their portfolios.
TAO’s future looks bright, making it an interesting investment opportunity, but don’t forget to factor in the risks.
When will TAO’s price reach a new all-time high?
CoinCodex predicts that TAO’s price could reach a new all-time high of $1131.7 by Sept. 25, 2024.
Source link
You may like


Solaxy presale raises $4.5M for Solana Layer 2 solution


Elon Musk xAI Secures $6B To Boost Generative AI Expansion: Details


Metaplanet Bitcoin Reserves Grow With Fresh $61 Million Purchase


Investors turn to Lightchain AI 3000x potential after PEPE drop


Moonpay In Talks To Acquire Coinbase Commerce Rival Helio


The Satoshi Papers Explores The Role Of The State In A Post-Bitcoin World: An Interview With Natalie Smolenski
Bitcoin
Metaplanet Bitcoin Reserves Grow With Fresh $61 Million Purchase
Published
3 hours agoon
December 24, 2024By
admin
Japan-based early-stage investment firm Metaplanet continues its Bitcoin (BTC) buying spree. The company announced today that it has purchased 619.7 BTC for $61 million – including fees and other expenses – making it the firm’s largest Bitcoin acquisition to date.
Metaplanet Increases BTC Holdings To 1,762
The recent crypto market downturn from its all-time highs (ATH) does not appear to bother Metaplanet, as the Tokyo-listed firm made its largest BTC purchase to date, buying 619.7 BTC worth $ 61 million at an average price of around $96,000.
Related Reading
To recall, Metaplanet started buying BTC earlier this year in May with a purchase of 97.9 BTC. Since then, the company has purchased BTC every month, barring September, and crossed the 1,000 BTC milestone in November. The latest acquisition has pushed Metaplanet’s total Bitcoin holdings to 1,762, bought at an average price of $75,600 per BTC.
Notably, this $61 million purchase is nearly double the value of Metaplanet’s previous largest acquisition, which occurred in November and was worth close to $30 million. The company’s consistent BTC accumulation has earned it the nickname “Asia’s MicroStrategy,” in reference to the US-based business intelligence firm known for its aggressive Bitcoin buying strategy.
It is worth highlighting that today’s BTC purchase comes a week after Metaplanet raised $60.6 million through two tranches of bond issuance for the purpose of “accelerating BTC purchases.” Metaplanet’s latest purchase also makes its BTC reserves the 12th-largest among publicly listed firms globally.
According to Metaplanet’s official announcement, its BTC Yield – a proprietary metric used to measure the performance of its Bitcoin acquisition strategy – stood at 310% from October 1 to December 23. The firm emphasized that this strategy is designed to be “accretive to shareholders.”
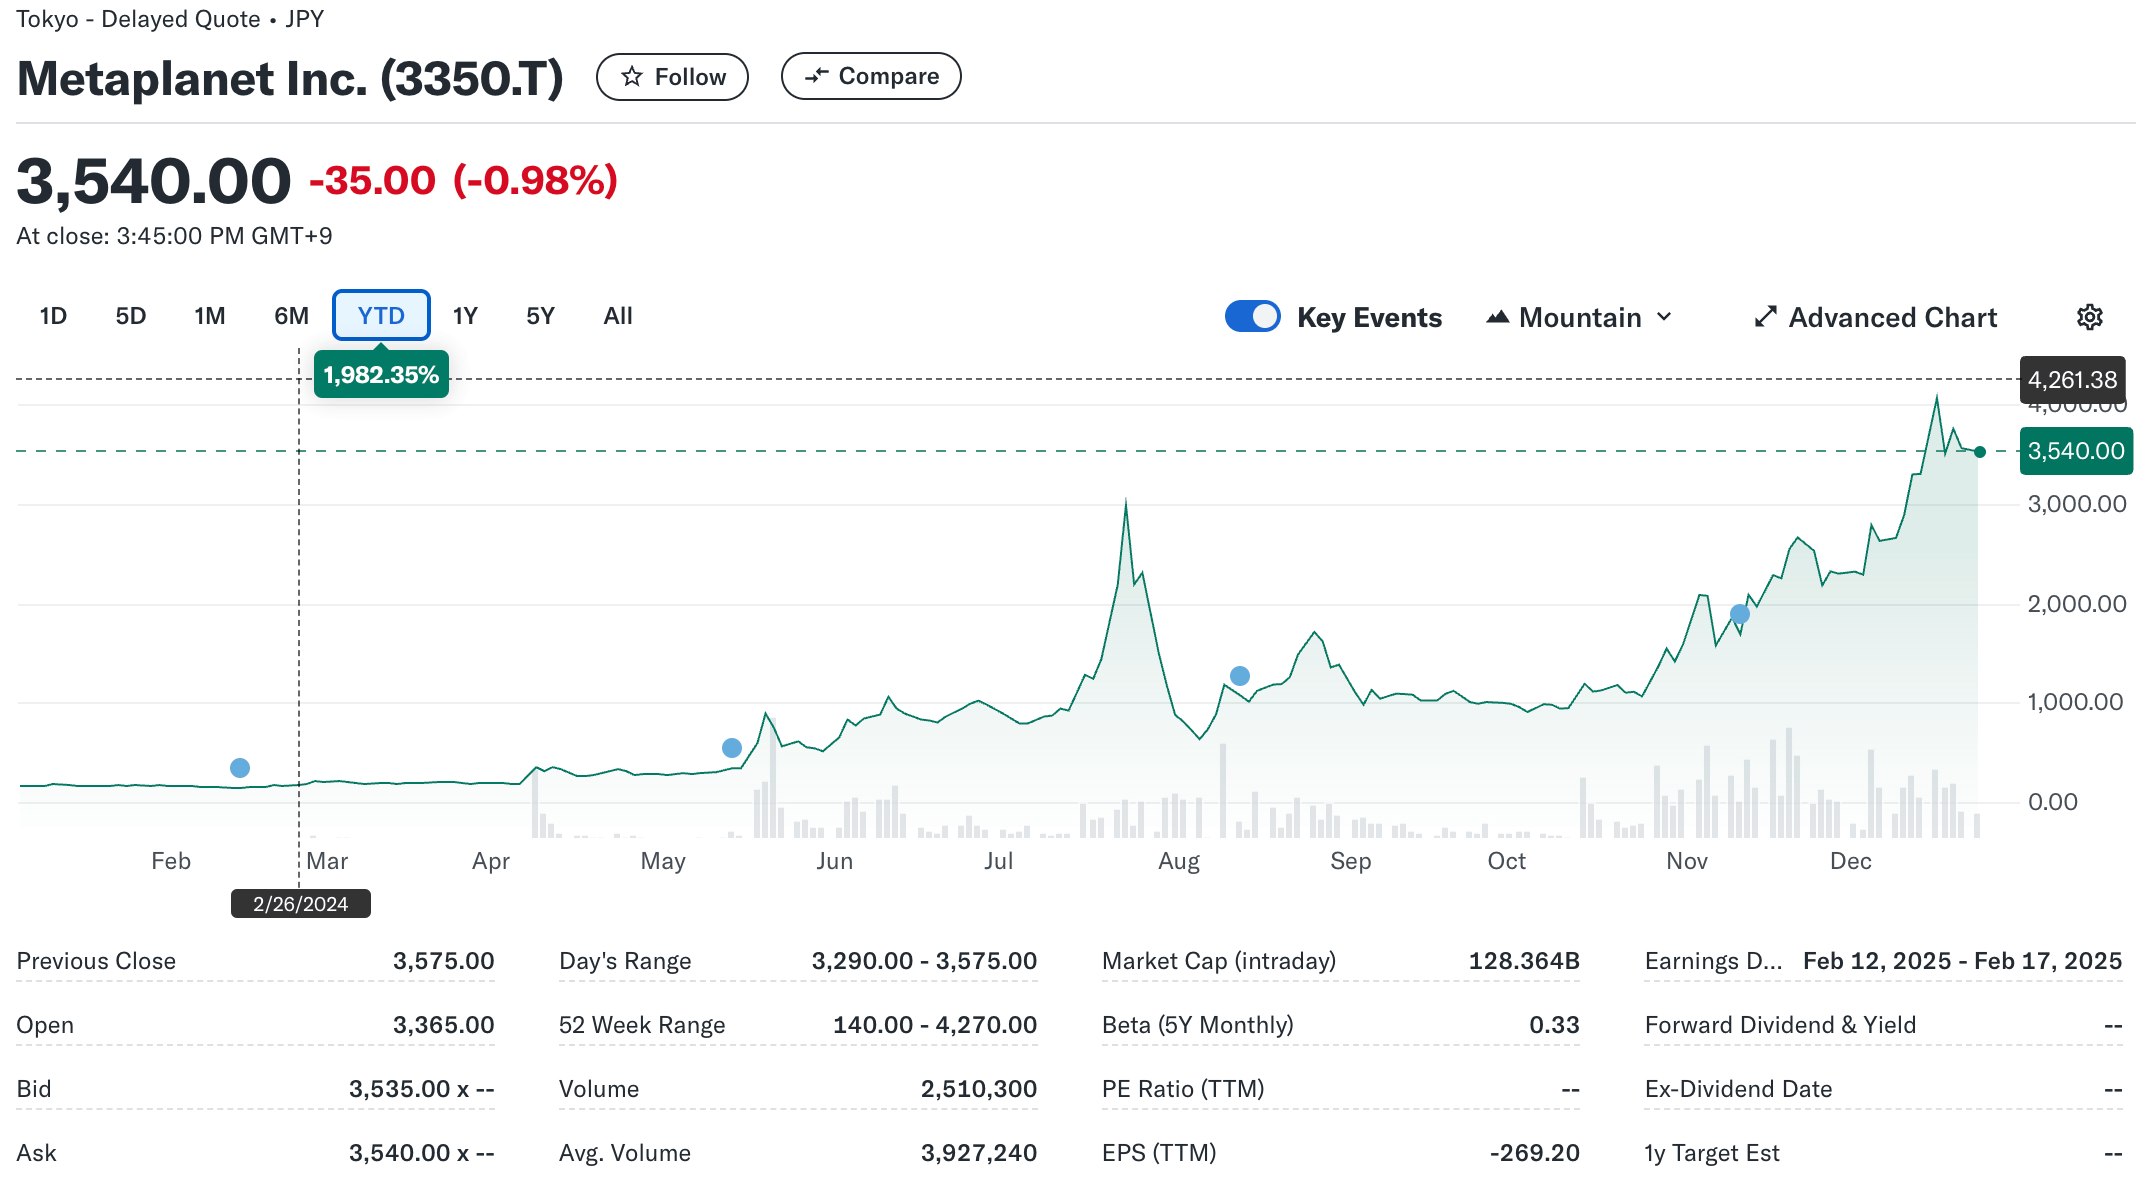
Despite today’s significant BTC purchase, Metaplanet’s stock price saw little movement, closing at $22.5, down 0.98% for the day. However, on a year-to-date basis, the company’s stock has surged by an astounding 1,982%, reflecting the long-term benefits of its Bitcoin-centric strategy.

Bitcoin Supply Crunch To Hasten Adoption?
With Bitcoin’s total maximum supply capped at 21 million, the digital asset has solidified its reputation as an inflation-resistant store of value. A recent report highlights that BTC supply on crypto exchanges has hit multi-year lows, indicating that holders are increasingly withdrawing BTC from exchanges, reducing circulating supply and potentially driving prices higher.
Related Reading
Bitcoin’s scarcity has triggered an unofficial race among corporations – and possibly even governments. For instance, Bitcoin mining firm Hut 8 recently purchased 990 BTC for $100 million, increasing its total holdings to over 10,000 BTC. Similarly, MARA, another Bitcoin mining company, acquired 703 BTC earlier this month, bringing its total holdings to 34,794 BTC.
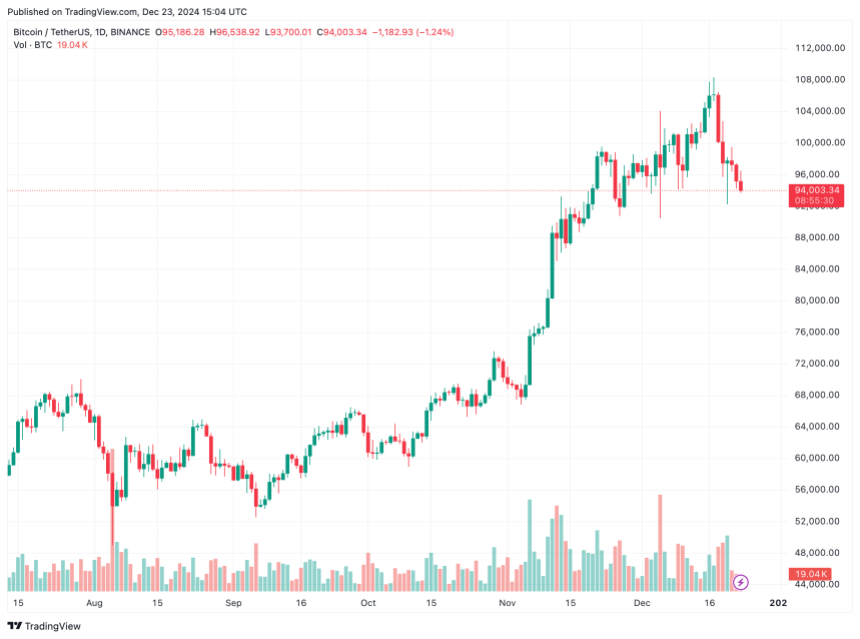
Speculations surrounding a potential US strategic Bitcoin reserve are further strengthening BTC’s supply crunch narrative, which may fast-track its adoption. At press time, BTC trades at $94,003, down 1.5% in the past 24 hours.

Featured image from Unsplash, charts from Yahoo! Finance and Tradingview.com
Source link
Bitcoin
Metaplanet makes largest Bitcoin bet, acquires nearly 620 BTC
Published
20 hours agoon
December 23, 2024By
admin

Tokyo-listed Metaplanet has purchased another 9.5 billion yen ($60.6 million) worth of Bitcoin, pushing its holdings to 1,761.98 BTC.
Metaplanet, a publicly traded Japanese company, has acquired 619.7 Bitcoin as part of its crypto treasury strategy, paying an average of 15,330,073 yen per (BTC), with a total investment of 9.5 billion yen.
According to the company’s latest financial disclosure, Metaplanet’s total Bitcoin holdings now stand at 1,761.98 BTC, with an average purchase price of 11,846,002 yen (~$75,628) per Bitcoin. The company has spent 20.872 billion yen in total on Bitcoin acquisitions, the document reads.
The latest purchase is the largest so far for the Tokyo-headquartered company and comes just days after Metaplanet issued its 5th Series of Ordinary Bonds via private placement with EVO FUND, raising 5 billion yen (approximately $32 million).
The proceeds from this issuance, as disclosed earlier, were allocated specifically for purchasing Bitcoin. These bonds, set to mature in June 2025, carry no interest and allow for early redemption under specific conditions.
Metaplanet buys dip
The company also shared updates on its BTC Yield, a metric used to measure the growth of Bitcoin holdings relative to fully diluted shares. From Oct. 1 to Dec. 23, Metaplanet’s BTC Yield surged to 309.82%, up from 41.7% in the previous quarter.
Bitcoin itself has seen strong performance this year, climbing 120% and outperforming assets like the Nasdaq 100 and S&P 500 indices. However, it has recently pulled back from its all-time high of $108,427, trading at $97,000 after the Federal Reserve indicated only two interest rate cuts in 2025.
Despite the retreat, on-chain metrics indicate that Bitcoin is still undervalued based on its Market Value to Realized Value (MVRV-Z) score, which stands at 2.84 — below the threshold of 3.7 that historically signals an asset is overvalued.
Source link
Blockchain
Horizen spikes 60% to lead gainers as BTC, ETH bounce
Published
3 days agoon
December 20, 2024By
admin

Horizen price spiked more than 60% in 24 hours as the cryptocurrency market looked to recover from a massive dump that saw top altcoins crash to key support levels.
On Dec. 20, as Bitcoin (BTC) traded to above $97k and Ethereum (ETH) bulls pushed above $3,400, the price of Horizen (ZEN) surged to highs of $26.34. The cryptocurrency, which rallied sharply following a recent Grayscale Investments announcement, reached a multi-year high and ranked among the top gainers in the 500 largest cryptocurrencies by market cap.
ZEN traded at lows of $14.55 on Dec. 19. However, despite the broader crypto crash and the staggering $1.4 billion liquidations, the altcoin’s price hovered above $26 in early trading during the U.S. trading session.
According to crypto.news price data, Horizen recorded a 24-hour trading volume of over $397 million, with its market cap exceeding $407 million. These metrics reflected increases of 294% and 62%, respectively, in the past 24 hours. While ZEN has surged nearly 200% over the past month, its current levels are still more than 84% below the all-time high of $168 reached in May 2021.
If the broader crypto market continues to rebound, ZEN bulls may aim for March 2022 highs near $50.
The positive momentum has benefited from Grayscale opening of the Grayscale ZEN Trust to qualified investors. Prices of the altcoin rose as the digital asset manager unveiled the fund to offer exposure to Horizen for qualified investors.
Earlier this month, Horizen’s native token underwent its final halving, which came as the project geared for a key change in its tokenomics. ZEN will not see any further halvings as the new network mechanism enables a declining emission rate.
That’s because Horizen, is shifting from the proof of work mining model that mirrored Bitcoin’s halving cycle to a new proof of stake mechanism in 2025. Horizen’s last halving occurred on Dec. 12, 2024.
New tokenomics for Horizen will come into effect in the first half of 2025.
Source link

Solaxy presale raises $4.5M for Solana Layer 2 solution

Elon Musk xAI Secures $6B To Boost Generative AI Expansion: Details

Metaplanet Bitcoin Reserves Grow With Fresh $61 Million Purchase

Investors turn to Lightchain AI 3000x potential after PEPE drop

Moonpay In Talks To Acquire Coinbase Commerce Rival Helio

The Satoshi Papers Explores The Role Of The State In A Post-Bitcoin World: An Interview With Natalie Smolenski

Stablecoin Issuer Tether Invests $775,000,000 Into YouTube Rival Rumble

Solana L2 Sonic includes TikTok users in airdrop

5 Tokens Ready For A 20X After Solana ETF Approval

Solana beats Ethereum in a key metric 3 months in a row

SCENE’s 2024 Person of the Year: Iggy Azalea

BTC Risks Falling To $20K If This Happens

Most Layer 2 solutions are still struggling with scalability

Here’s why Stellar Price Could Go Parabolic Soon

Perp-Focused HyperLiquid Experiences Record $60M in USDC Net Outflows
182267361726451435

Why Did Trump Change His Mind on Bitcoin?

Top Crypto News Headlines of The Week

New U.S. president must bring clarity to crypto regulation, analyst says

Will XRP Price Defend $0.5 Support If SEC Decides to Appeal?

Bitcoin Open-Source Development Takes The Stage In Nashville

Ethereum, Solana touch key levels as Bitcoin spikes

Bitcoin 20% Surge In 3 Weeks Teases Record-Breaking Potential

Ethereum Crash A Buying Opportunity? This Whale Thinks So

Shiba Inu Price Slips 4% as 3500% Burn Rate Surge Fails to Halt Correction

Washington financial watchdog warns of scam involving fake crypto ‘professors’

‘Hamster Kombat’ Airdrop Delayed as Pre-Market Trading for Telegram Game Expands

Citigroup Executive Steps Down To Explore Crypto
Mostbet Güvenilir Mi – Casino Bonus 2024

NoOnes Bitcoin Philosophy: Everyone Eats
Trending

 3 months ago
182267361726451435

 Donald Trump5 months ago
Why Did Trump Change His Mind on Bitcoin?

 24/7 Cryptocurrency News4 months ago
Top Crypto News Headlines of The Week

 News4 months ago
New U.S. president must bring clarity to crypto regulation, analyst says

 Price analysis4 months ago
Will XRP Price Defend $0.5 Support If SEC Decides to Appeal?

 Opinion5 months ago
Bitcoin Open-Source Development Takes The Stage In Nashville

 Bitcoin5 months ago
Ethereum, Solana touch key levels as Bitcoin spikes

 Bitcoin5 months ago
Bitcoin 20% Surge In 3 Weeks Teases Record-Breaking Potential


