
Cryptocurrency Market News
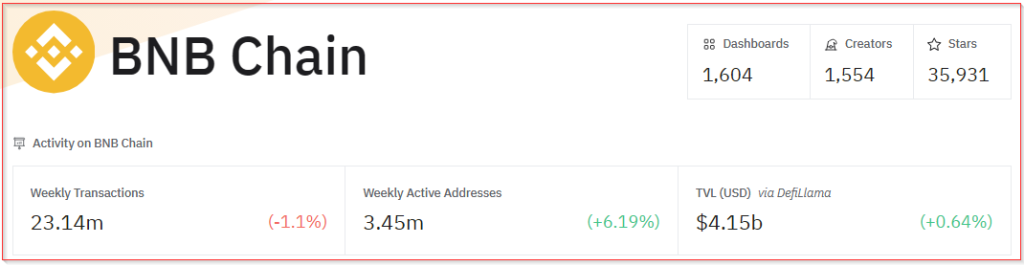
BNB Weekly Active Addresses Surge Over 6%

Since March, the price of BNB, previously also known as Binance Coin, has barely fallen below $500, despite the broader crypto market downturn. Following heavy losses from major cryptocurrencies, BNB has shown some impressive resistance to the price drop, supported by strong demand.
Related Reading
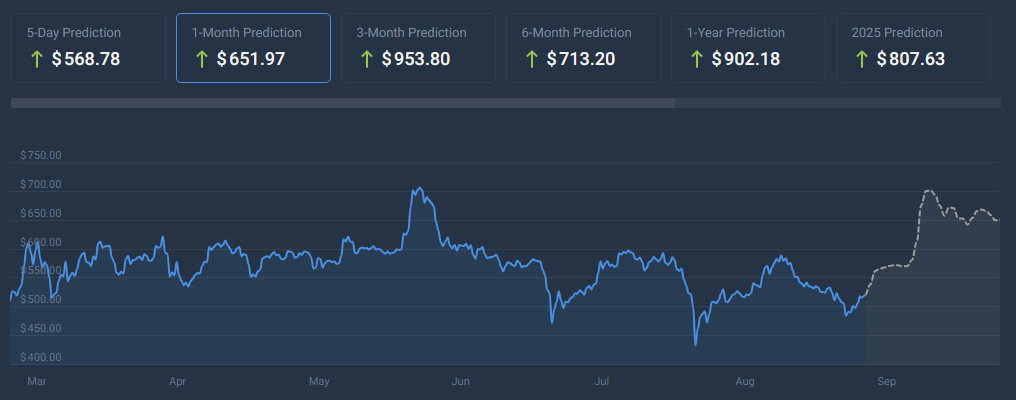
Despite this strength, the latest BNB price forecast by CoinCodex still estimates the coin could rise by 25% and reach $650 by October 10, 2024. Meanwhile, investor sentiment is bearish, and the Fear & Greed Index also stands at 33, reflecting that uncertainty in the market.
This mixed outlook brings up questions about BNB’s near-term trajectory. While there might be a possibility of growth in the long run, short-term conservatism is required, more so from the recent coin volatility and broader market dynamics.
BNB’s Sideways Movement And Strong Demand
Since March, BNB has moved within a sideways pattern that posts heavy ups and downs. However, after every fall, BNB has strongly rebounded above $500, meaning that there is strong demand for the coin. For instance, on September 6, it fell as low as $470 but later rebounded to trade at $520 at press time.
This is also in line with the rising expectations of an altseason, as a decline in Bitcoin dominance tends to boost altcoins like BNB. Investors seem confident that BNB might continue profiting from this trend in a way that it always has historically when stronger demand for alternative cryptocurrencies was triggered.
On-Chain Data: Activity And Network Demand
Recent on-chain data from Dune Analytics points to both some promising and concerning trends in BNB. The number of active addresses on the Binance Smart Chain increased by 6% week-over-week, indicating that more people are interested in getting on the network.
This increase in active addresses did not, however, reflect a similar uptick in transaction volumes, which declined 1.1% over the week, hinting that increased participation has not yet translated into strong network activity.
The decline in network fees also reflects reduced activity, which may have an effect on the path that the BNB price may take. To be sure, high network usage has always seen relatively high demand for the BNB historically, and its prolonged depressed activity can cap the upside potential of the coin.
A Rally Around The Corner?
Some analysts think it could be set up for a run, despite the bearish sentiment and recent price swings, particularly once altseason starts to heat up. Usually, when Bitcoin dominance weakens, that allows other assets to capture market attention and capital, which is where altcoins, especially BNB, tend to do well.
While the projection for a 25% gain in price by CoinCodex could be the sort of thing that might suggest that BNB will continue to rise, the short-term prospects for the token remain uncertain.
Related Reading
While the coin did manage to post green days of 47% over the last month, the price volatility of 4.62% still showed risks. The bearish sentiment and market fear, along with mixed network activity, all imply prudence by investors in the immediate future.
BNB may very well persist with its resilience and probably grow even more. This crypto asset is one to keep an eye on. But with mixed signals in on-chain data and markets feeling their way cautiously, the risks involved should be considered first before investors dabble into the digital asset.
While a rally is most definitely possible, the market has not ended fluctuations just yet, and that short-term volatility may still be an issue.
Featured image from Zipmex, chart from TradingView
Source link


The XRP price recently surged to a three-year high of $1.6, marking a significant milestone in the cryptocurrency’s recent bullish rally. This remarkable price movement has garnered the attention of many analysts as investors continue to project the trajectory of the price.
Related Reading
There are basically two ways the XRP price can go from here: either a continued move upwards or a notable correction. An in-between is a consolidation pattern.
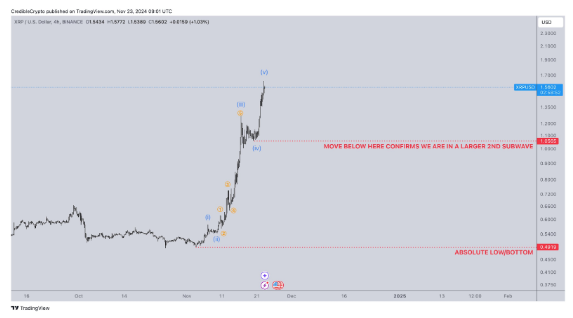
CrediBULL Crypto shared his insights on the potential paths the altcoin might take next. Using the Elliott Wave Theory, he highlighted two scenarios that could shape XRP’s near-term future.
What’s The Next Path For XRP Price?
According to CrediBULL Crypto, XRP’s recent rally exhibits a textbook example of a five-wave impulsive move, complete with clearly identifiable subwaves. This pattern confirms that the cryptocurrency has likely reached its absolute bottom at the November low of $0.49, which is a strong foundation for its current upward trend.
The impulsive wave structure suggests that the crypto is at a pivotal juncture, and its future trajectory hinges on whether it sustains specific price levels.
The first possibility centers on XRP failing to maintain its position above $1.05, which is the origin of the fifth subwave in the current impulsive structure. Should this level break, it would confirm that the XRP price is in a larger Wave 2 correction.
According to the Elliot Waves Theory, Waves 2 and 4 are corrective waves, while Waves 1, 3, and 5 are the main bullish waves. before This correction, while bearish in the short term, would lay the groundwork for an even stronger Wave 3 rally in the future.
CrediBULL Crypto predicts a very different outcome if the XRP price manages to hold above the $1.05 level. Holding above the $1.05 level would indicate that the fifth subwave is extending. In this case, the analyst predicted that the XRP price will surpass the $2 mark before experiencing any substantial pullback.
The Road Ahead For XRP
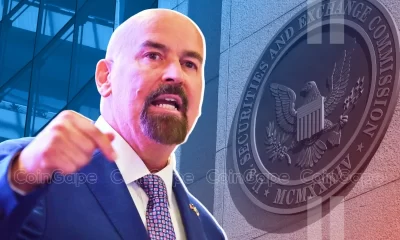
XRP, which had lingered below the $1 threshold for the past three years, has now firmly established itself above this pivotal mark. The recent XRP price surge to $1.6 suggests that the cryptocurrency is in a stronger position to target the $2 milestone rather than retreat into a significant correction. This bullish sentiment is bolstered by speculation around SEC Chairman Gary Gensler’s anticipated resignation in January 2025.
Related Reading
The XRP price climb to $1.6 reflects its growing strength in the market. Nonetheless, the next phase of its journey depends on key support and resistance levels. At the time of writing, the XRP price is trading at $1.46, having corrected by about 8.5% in the past 24 hours. However, the XRP price is still up by 175% in the past 30 days.
Featured image from Pexels, chart from TradingView
Source link


Hashdex Files Second Amendment for Nasdaq Crypto Index US ETF Approval

Bitcoin Dips to $93,000 With $400 Million in Longs Rekt. Where to From Here?

You Can Now Invest In Bitcoin And Open-source Companies

Trump holds $7 million in crypto: Arkham Intelligence

John Deaton Calls Out Gary Gensler For Ties With Sam Bankman-Fried

Ethereum’s ETH Outperforms as Bitcoin (BTC) Price Recoils Off $100K Sell Wall

Safegcd’s Implementation Formally Verified

US detaining Bitcoin mining equipment at border: report

Robinhood Lists Dogwifhat, WIF Price To $5?

MicroStrategy Adds 55,500 More BTC To Its Portfolio For $5.4 Billion

Newmarket Capital Launches Battery Finance, Bitcoin-Collateralized Loan Strategy

Can the XRP price realistically jump to $10 in 2024?

Shiba Inu Price Eyes 76% Rally As 6.8m SHIB Tokens Burned

VanEck Doubles Down on Big Bitcoin Price Target, Says Key Indicators Continue To ‘Signal Green’

Multichain AI token poised to dethrone SOL, TON: 5,000% gains expected
182267361726451435
Why Did Trump Change His Mind on Bitcoin?

Top Crypto News Headlines of The Week

New U.S. president must bring clarity to crypto regulation, analyst says

Ethereum, Solana touch key levels as Bitcoin spikes

Bitcoin Open-Source Development Takes The Stage In Nashville

Will XRP Price Defend $0.5 Support If SEC Decides to Appeal?

Bitcoin 20% Surge In 3 Weeks Teases Record-Breaking Potential

Ethereum Crash A Buying Opportunity? This Whale Thinks So

Shiba Inu Price Slips 4% as 3500% Burn Rate Surge Fails to Halt Correction

‘Hamster Kombat’ Airdrop Delayed as Pre-Market Trading for Telegram Game Expands

Washington financial watchdog warns of scam involving fake crypto ‘professors’

Citigroup Executive Steps Down To Explore Crypto
Mostbet Güvenilir Mi – Casino Bonus 2024

Bitcoin flashes indicator that often precedes higher prices: CryptoQuant

 2 months ago
182267361726451435

 Donald Trump4 months ago
Why Did Trump Change His Mind on Bitcoin?
 24/7 Cryptocurrency News3 months ago
Top Crypto News Headlines of The Week
 News3 months ago
New U.S. president must bring clarity to crypto regulation, analyst says
 Bitcoin4 months ago
Ethereum, Solana touch key levels as Bitcoin spikes
 Opinion4 months ago
Bitcoin Open-Source Development Takes The Stage In Nashville
 Price analysis4 months ago
Will XRP Price Defend $0.5 Support If SEC Decides to Appeal?
 Bitcoin4 months ago
Bitcoin 20% Surge In 3 Weeks Teases Record-Breaking Potential
