Bitcoin
Can Ethereum regain momentum and outperform Bitcoin in 2024?
Published
4 months agoon
By
admin
Ethereum has outperformed Bitcoin in terms of price performance, especially when looking at time frames since its inception, halving years, and bull market periods. However, ETH has consistently underperformed since the bear markets of 2018-2019 and 2022-2023. In the 2024 halving year, for the first time, Ethereum is considerably trailing behind Bitcoin. In fact, it has been underperforming against Bitcoin for the past three years.
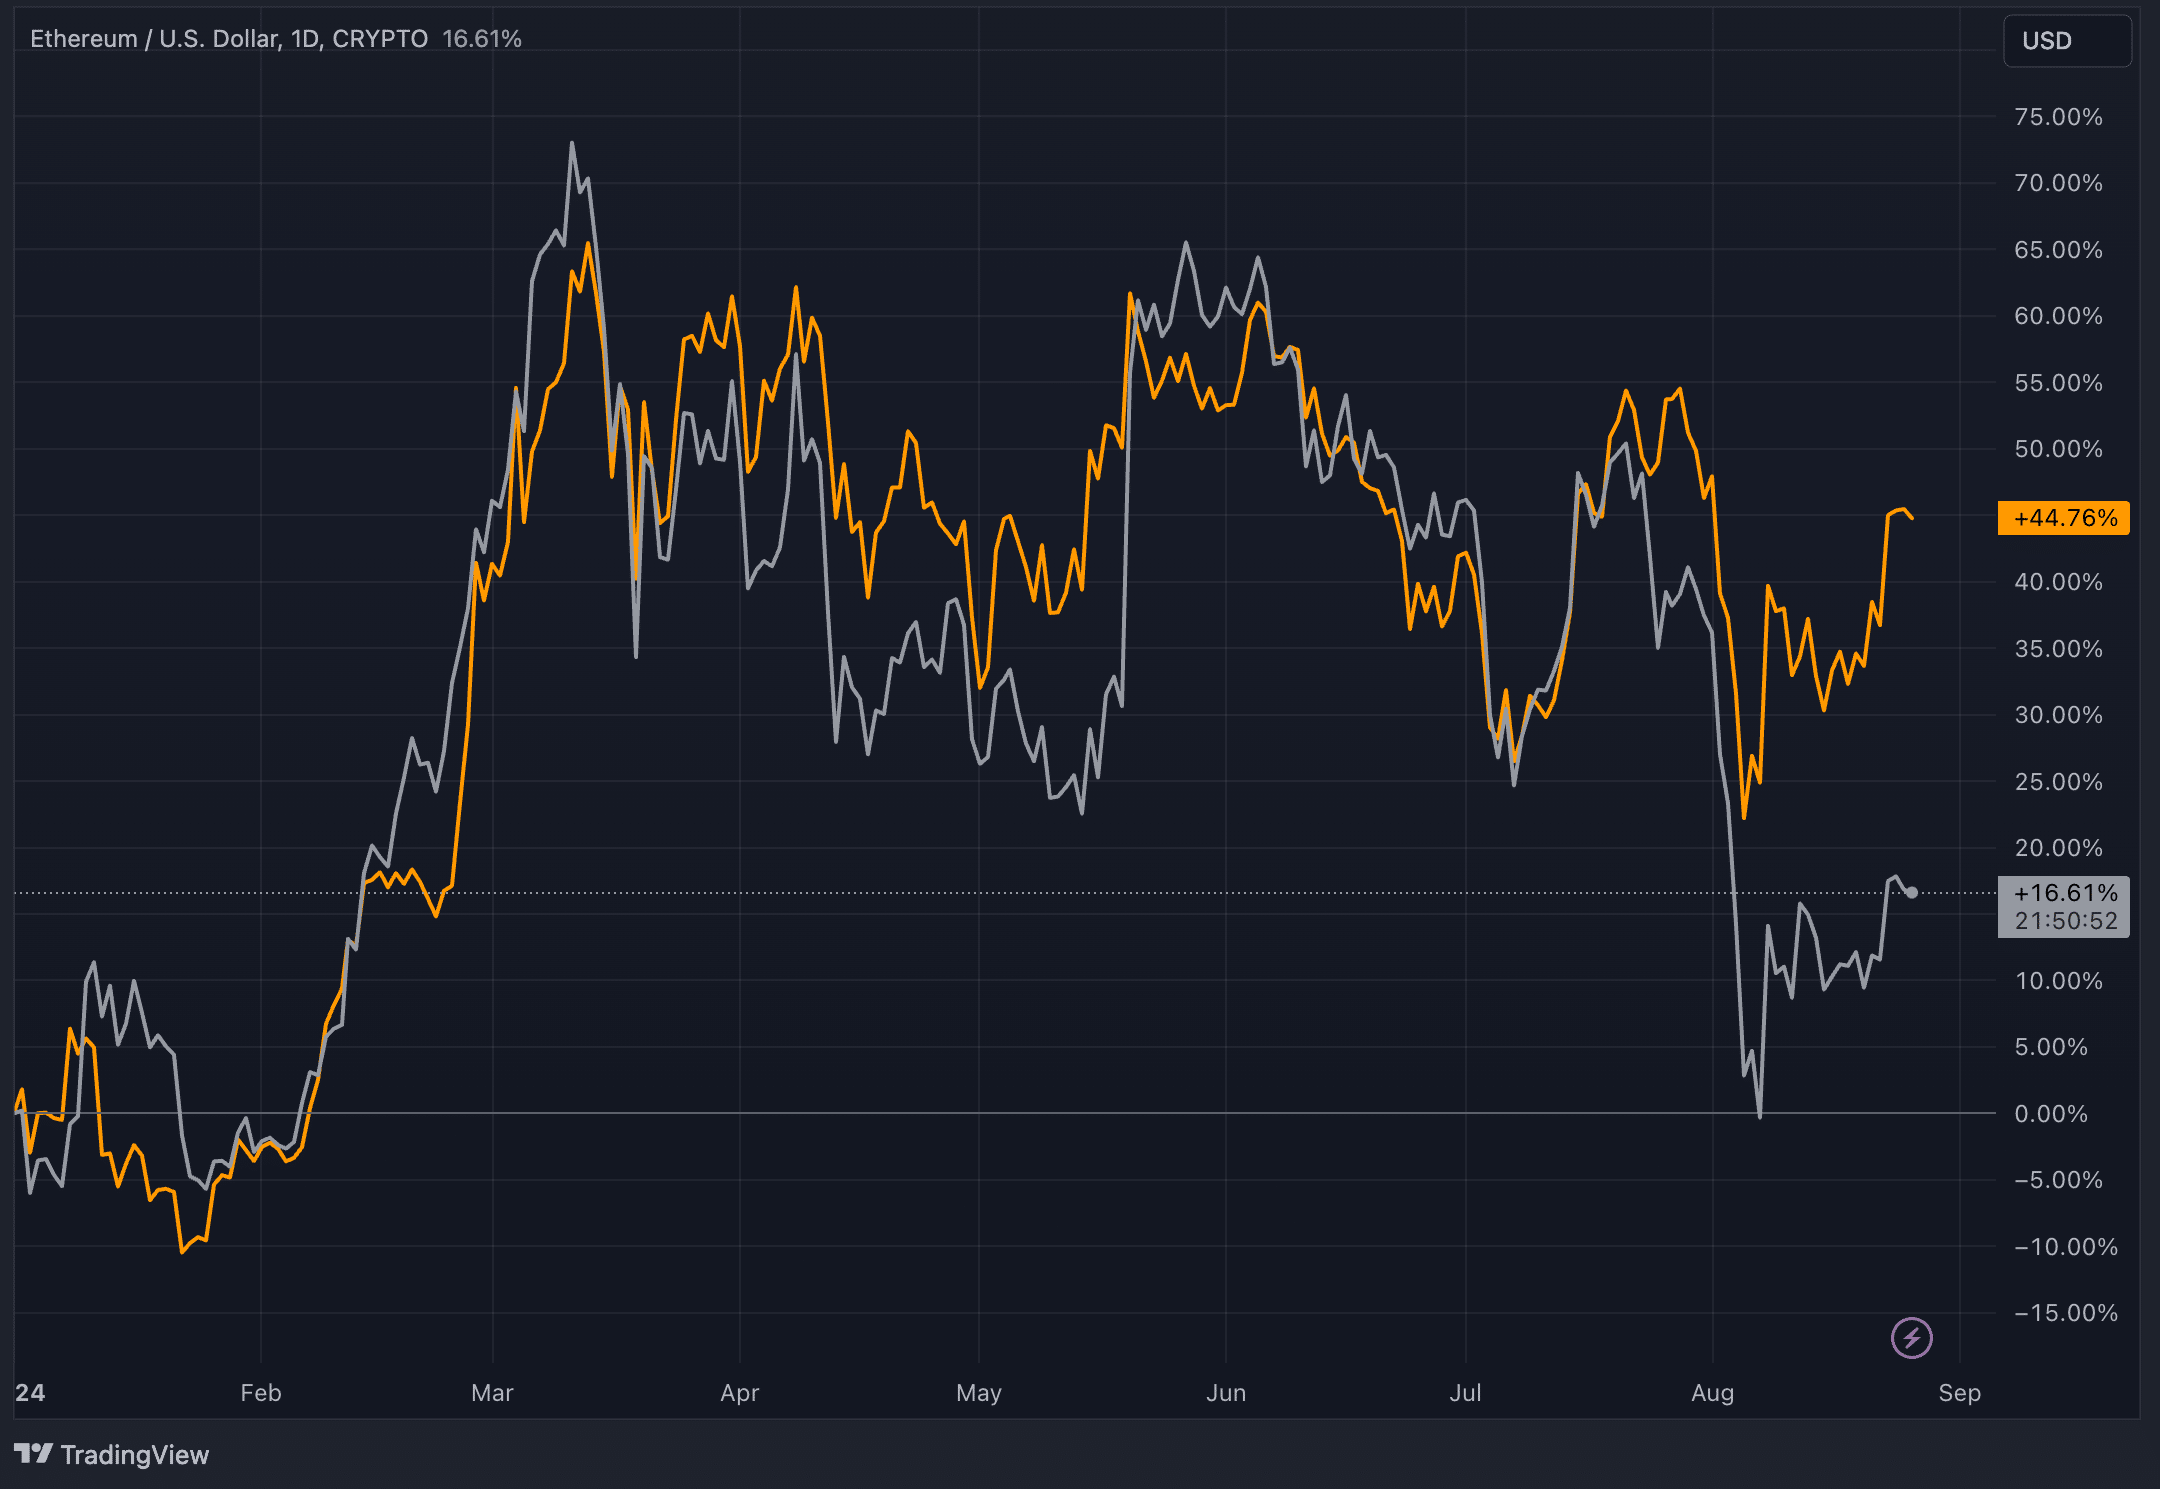
ETH/BTC ratio plummets to 3.5-year low
Although fractals, a concept where similar patterns repeat over different timeframes, are not a foolproof method for predicting future outcomes, they provide valuable context into what might lie ahead.
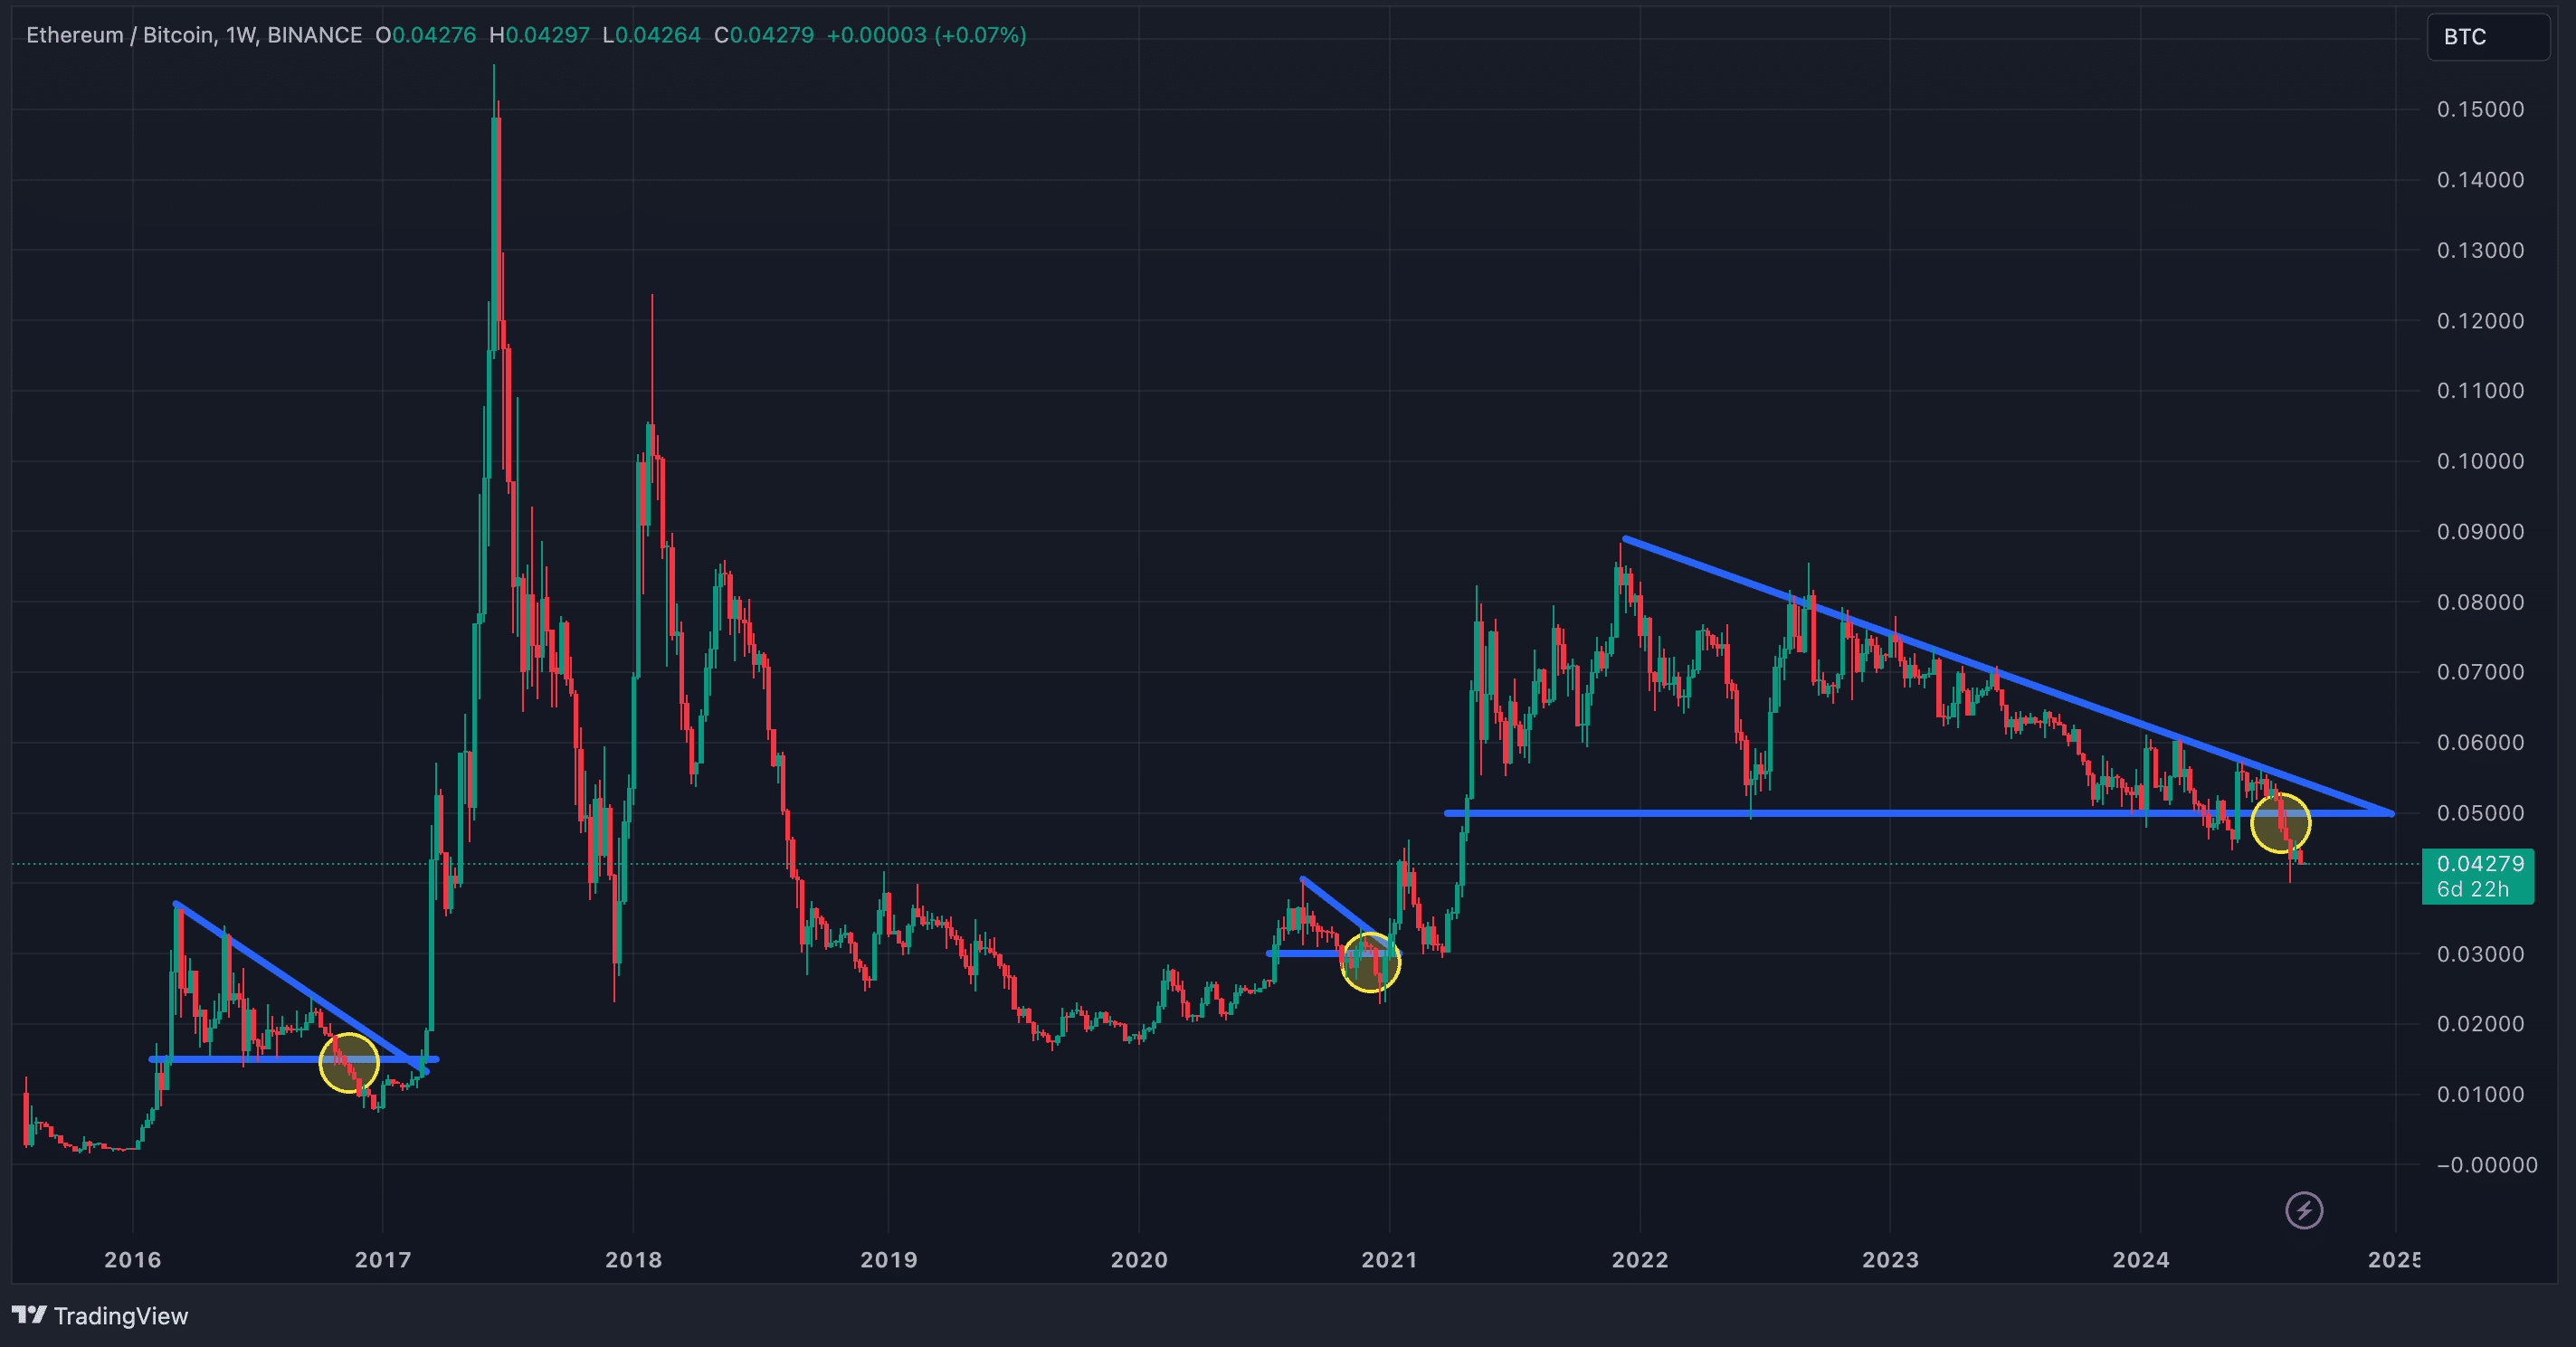
In previous halving years, the ETH/BTC ratio broke down from its support line around September to December, only to begin an uptrend in the first quarter of the following bull market year. A similar scenario could unfold in 2024, as Ethereum has once again broken through its support. However, this time, the situation is more concerning. Unlike previous halving years, where the support line was relatively recent, the current support at 0.05 has held strong for the past 3.5 years, which suggests a more bearish outlook for Ethereum.
Another point of comparison can be drawn from 2019 when the Federal Reserve started cutting interest rates—a move that might recur in September 2024. Back in 2019, from the time the Fed began cutting rates until it stopped, the ETH/BTC ratio dropped by 22%.
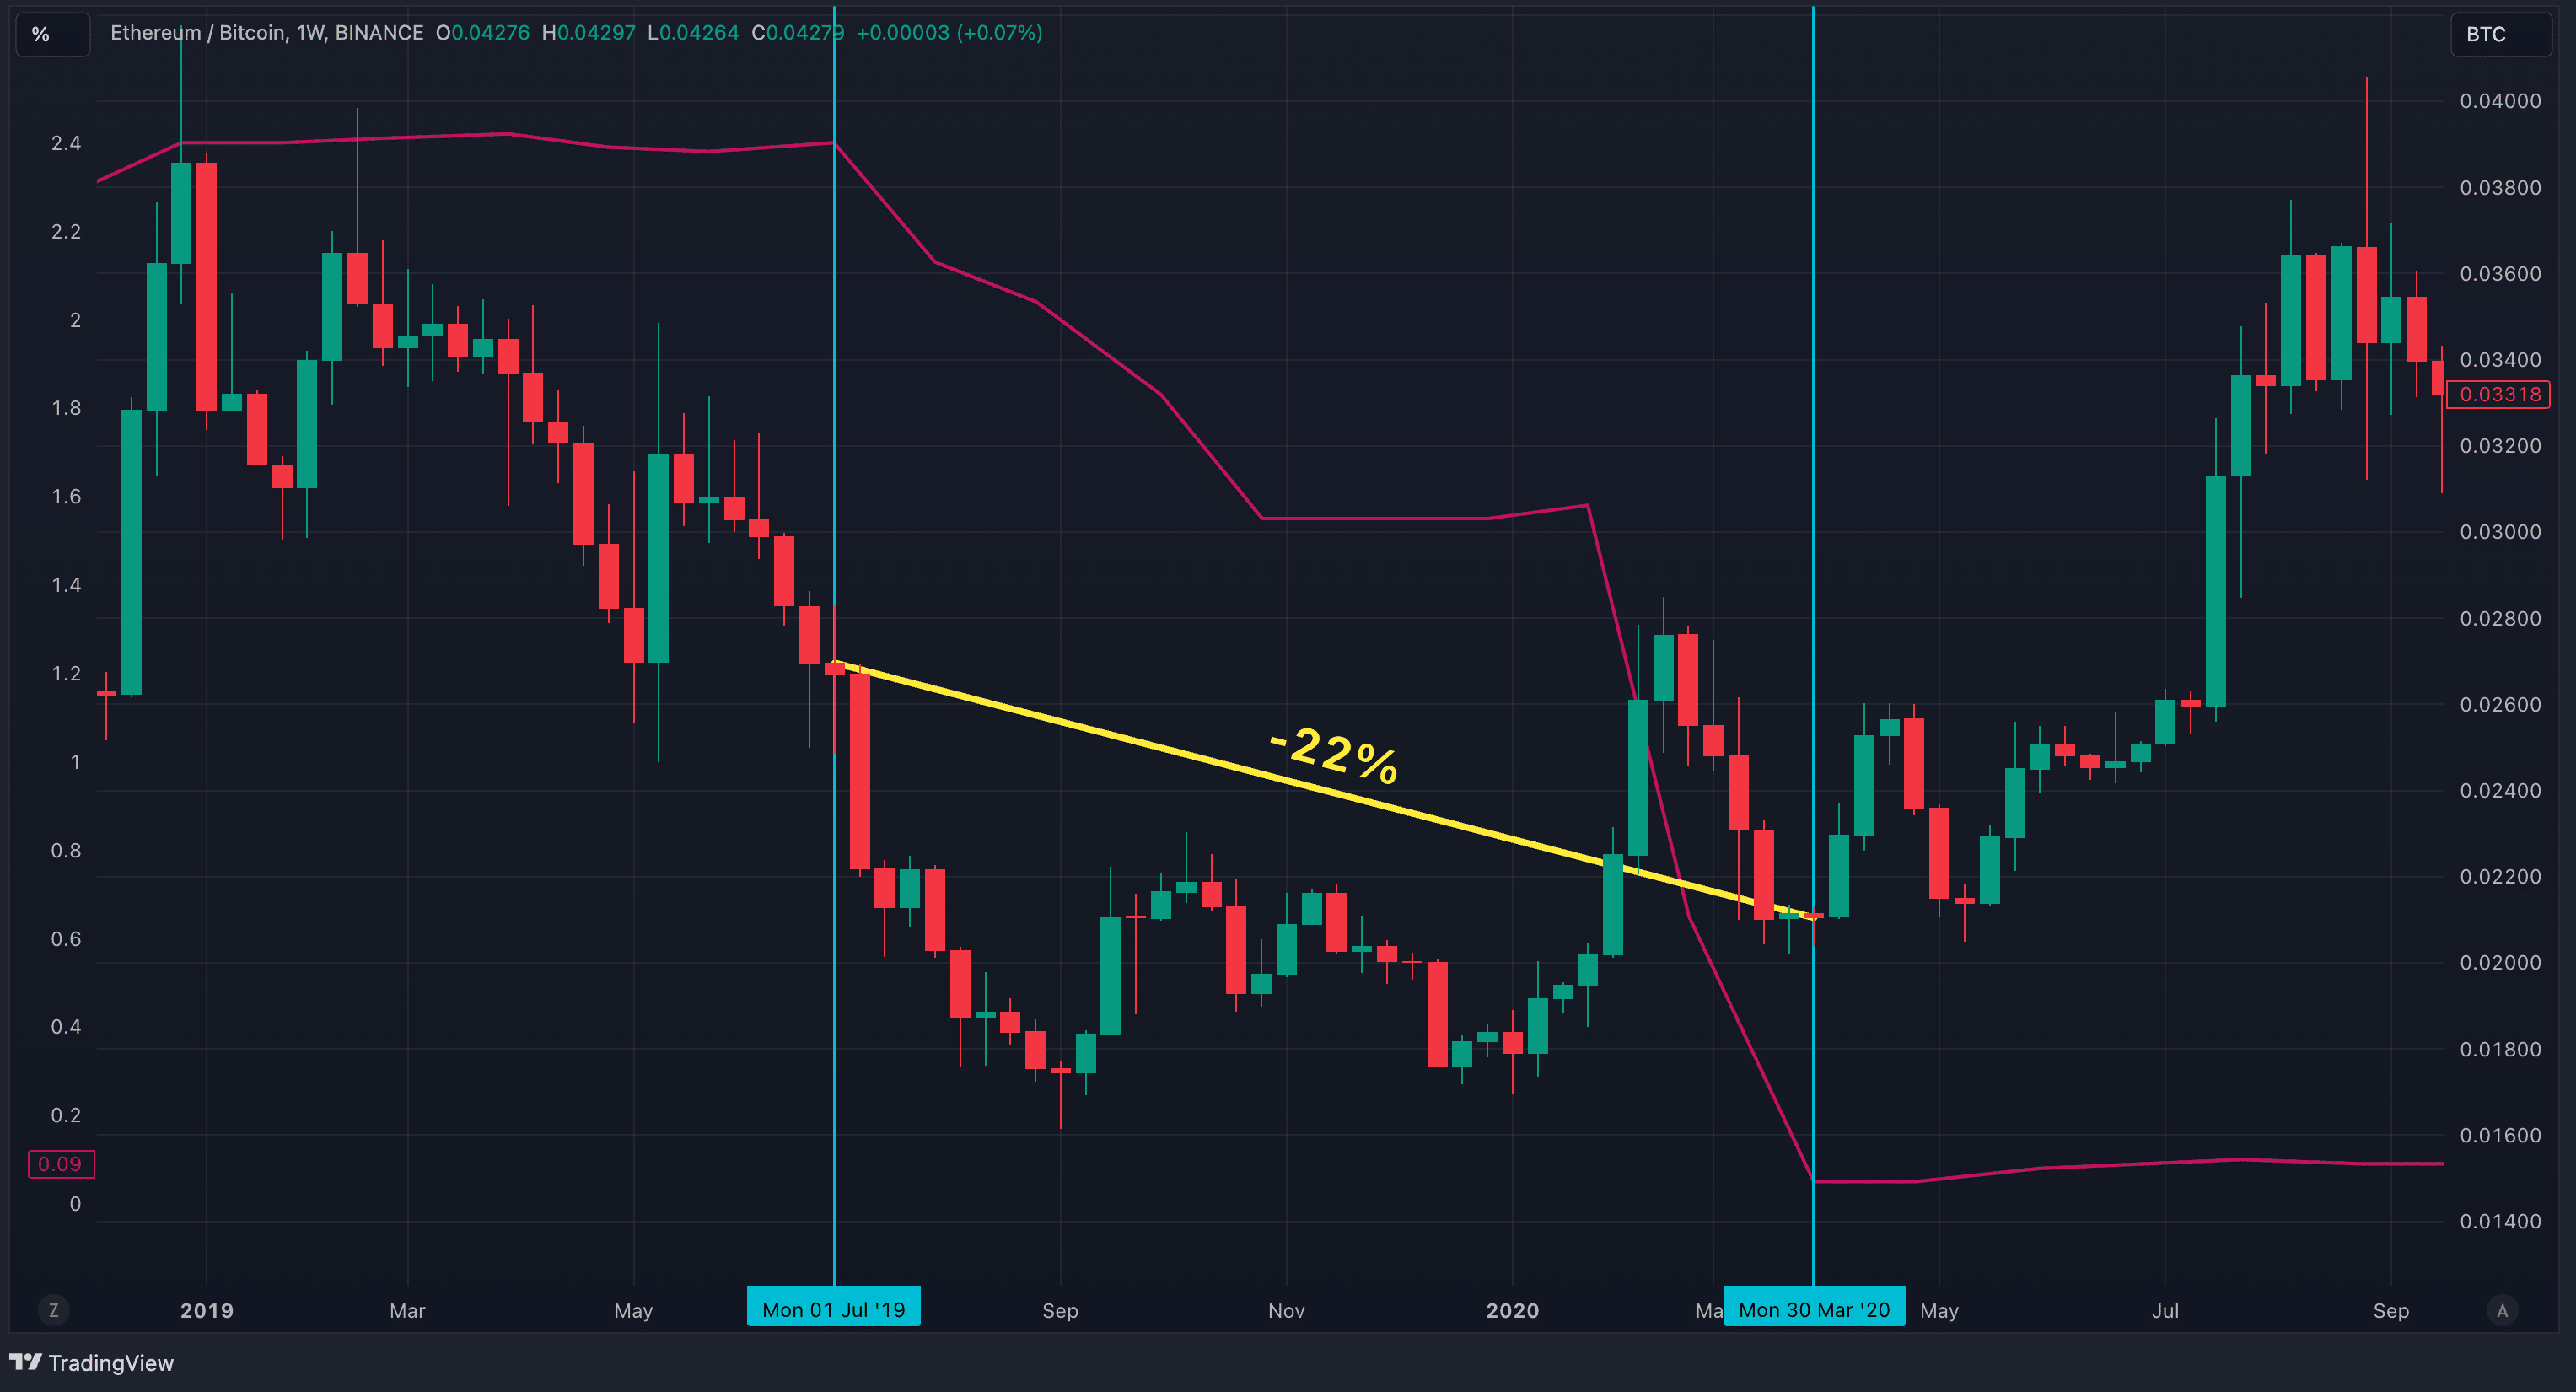
Not only did the ratio drop in all these cases, but Ethereum’s price itself also performed negatively, except for 2020. However, the critical issue isn’t just whether the price went up or down; it is also whether holding Ethereum was the better investment decision. History has shown that, in similar circumstances, holding Bitcoin proved to be the more advantageous choice—and 2024 may very well continue that trend.
Ethereum supply reverses course and turns inflationary.
The supply of Ethereum had been decreasing steadily after the 2022 Merge. The decrease in Ethereum’s supply works through a mechanism called “burning,” which was introduced with the Ethereum Improvement Proposal (EIP) 1559 in August 2021. Basically, a portion of the transaction fees paid in ETH is burned or permanently removed from circulation. This reduces the total supply of ETH over time, especially during periods of high network activity when transaction fees are higher.
The reason why the supply of Ethereum started to drop following the 2022 Merge was because the network transitioned from a proof-of-work to a proof-of-stake consensus mechanism. Under PoW, new ETH was continuously issued to miners as rewards for validating transactions, which contributed to an increase in Ethereum’s total supply. However, with the Merge and the shift to PoS, the issuance of new ETH significantly decreased because validators, who now secure the network, receive much lower rewards compared to miners.
The Dencun upgrade in March 2024 marked a turning point, reversing this deflationary trend and making Ethereum’s supply inflationary once again. It introduced proto-danksharding and “blobs,” which optimize data storage and reduce transaction fees on layer-2 networks. Although Dencun improved scalability and made transactions more cost-effective, it also led to a major decrease in the amount of ETH being burned, which had been a critical factor in keeping Ethereum’s supply deflationary.
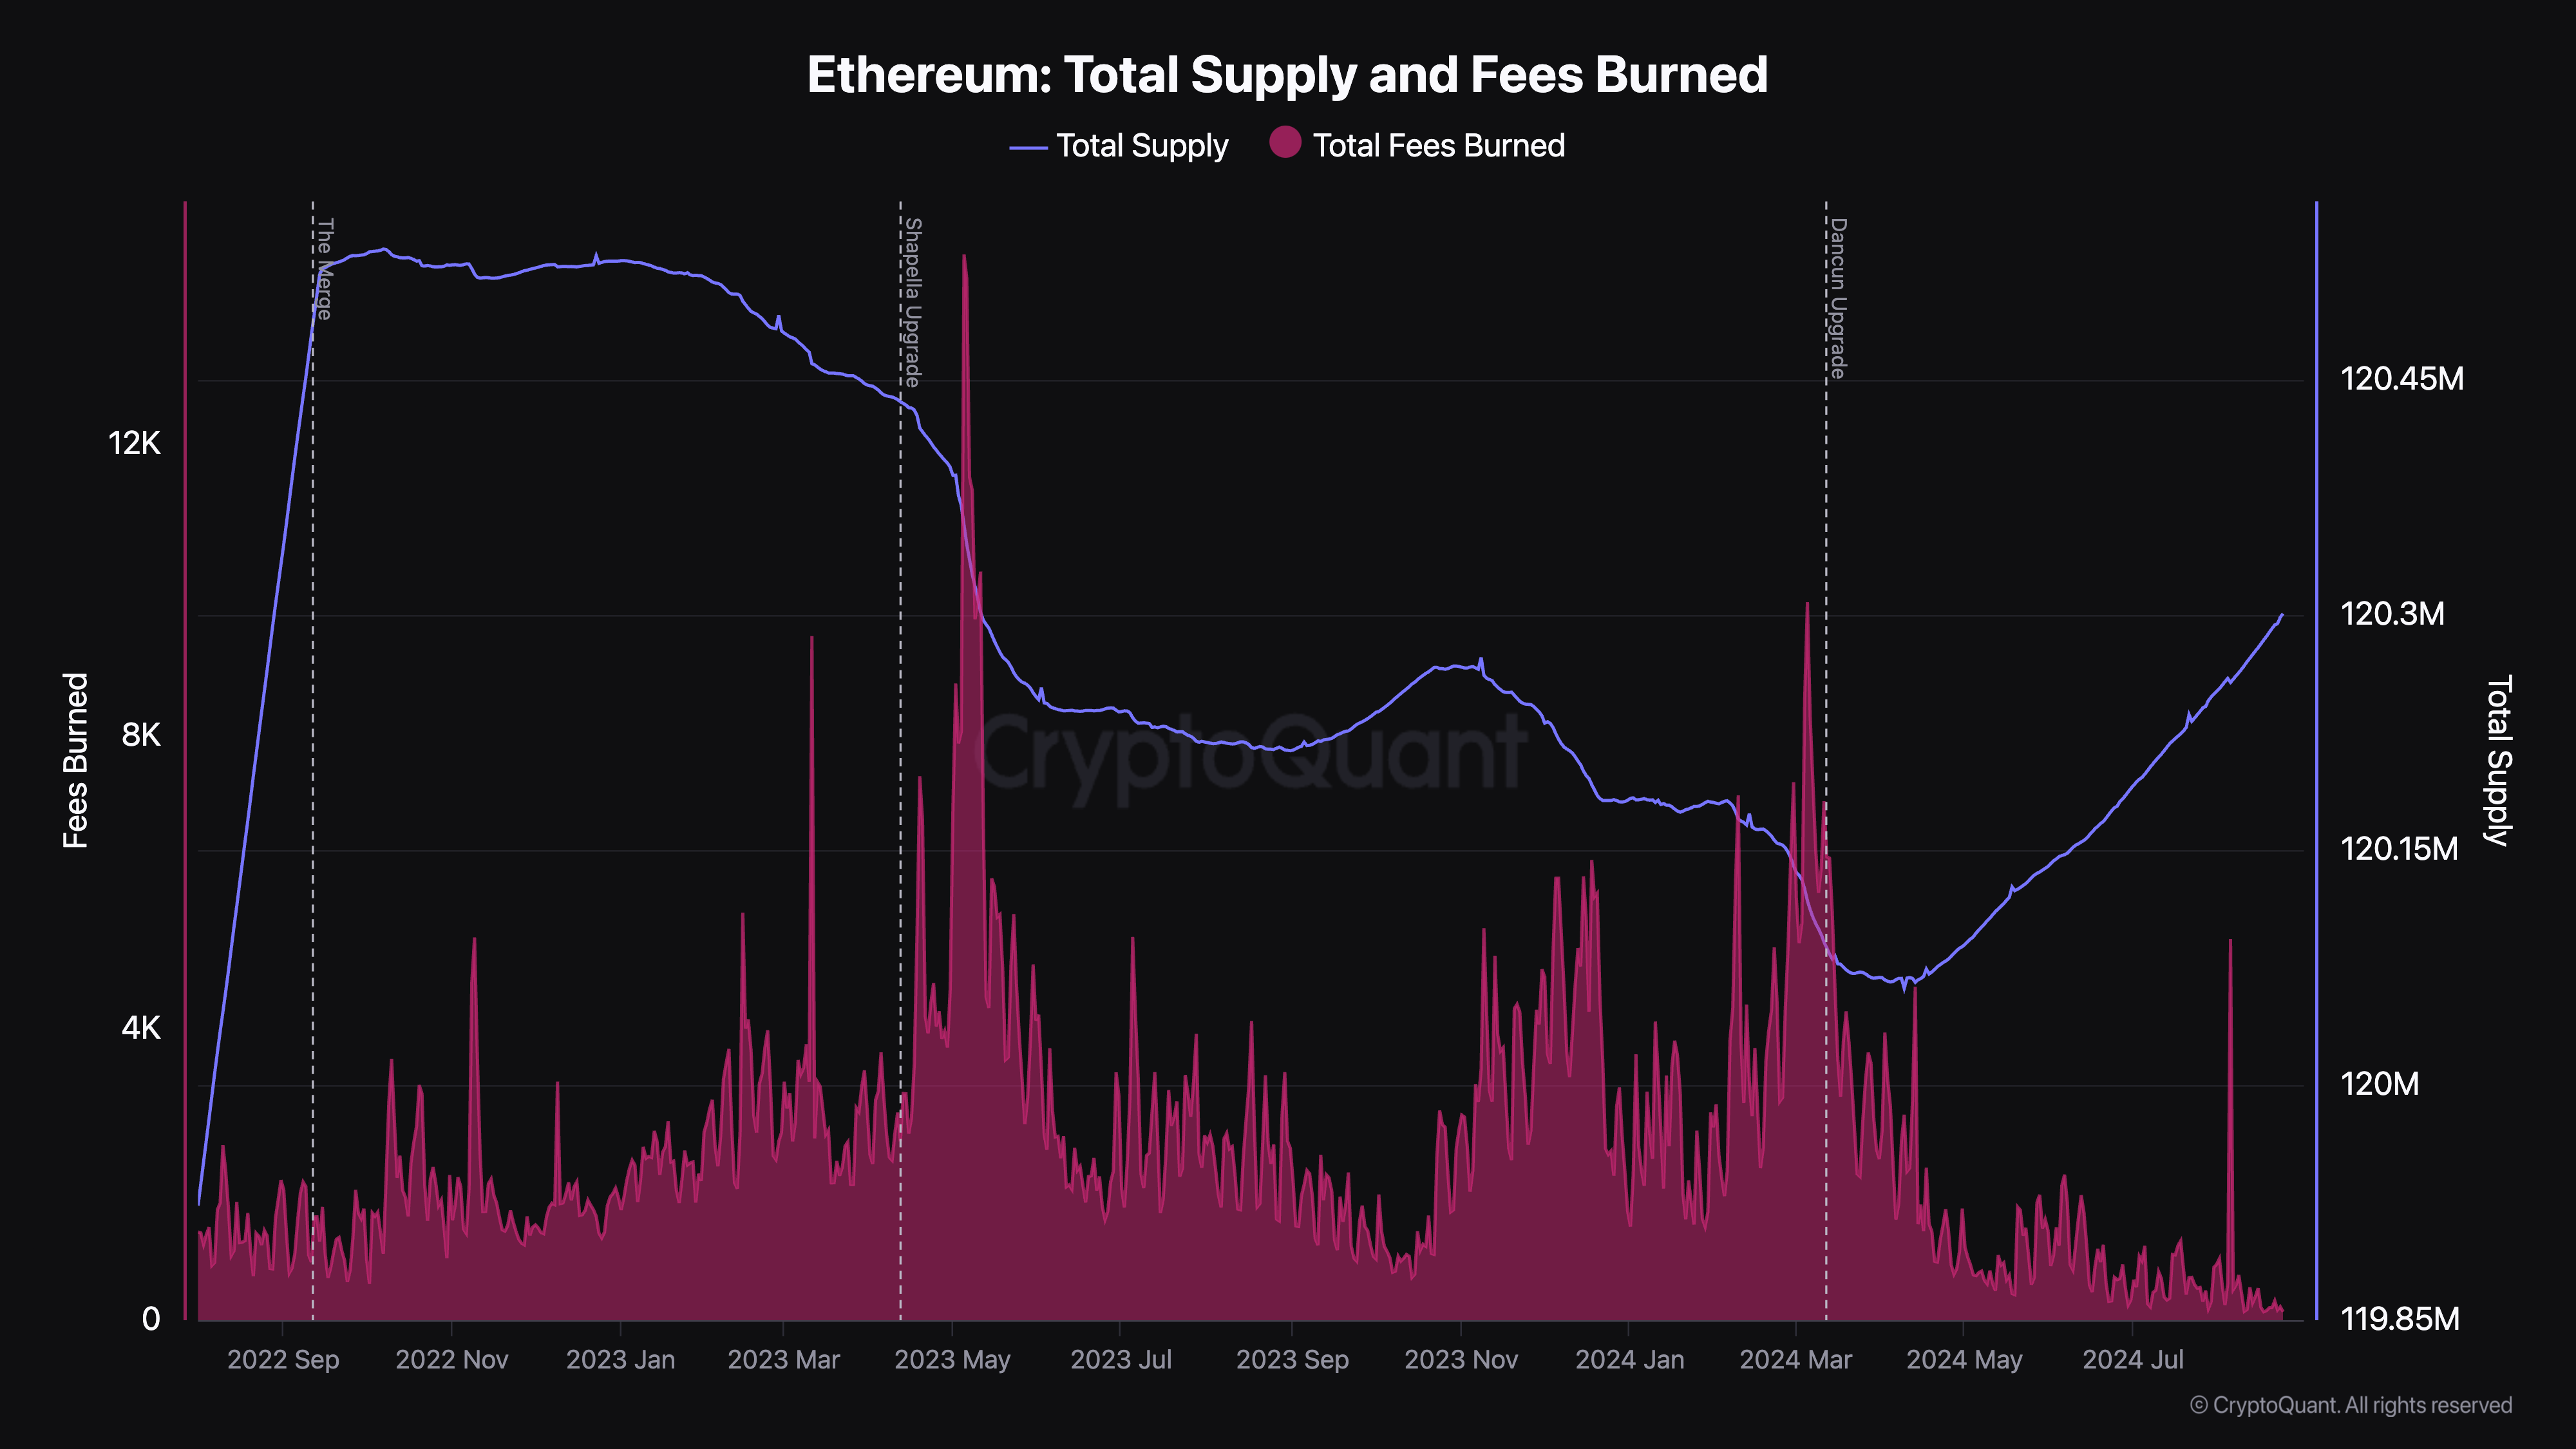
As a consequence, Ethereum’s supply began to increase, with over 213.5K ETH added to circulation since the Dencun upgrade. For comparison, Ethereum’s supply is now at the same level it was back in May 2023.
Negative ETF Flows Continue
Many expected that the approval of Ethereum ETFs would boost ETH by increasing demand and driving prices higher. However, this has not been the case so far. Instead, ETF outflows have become a concern, with a total of $465 million flowing out since trading began. The main driver of the trend is Grayscale’s ETHE, which has seen massive outflows, overshadowing the positive inflows from other Ethereum ETFs. The scale of the outflows from ETHE is so large that it creates a net negative effect when considering all Ethereum ETFs collectively.
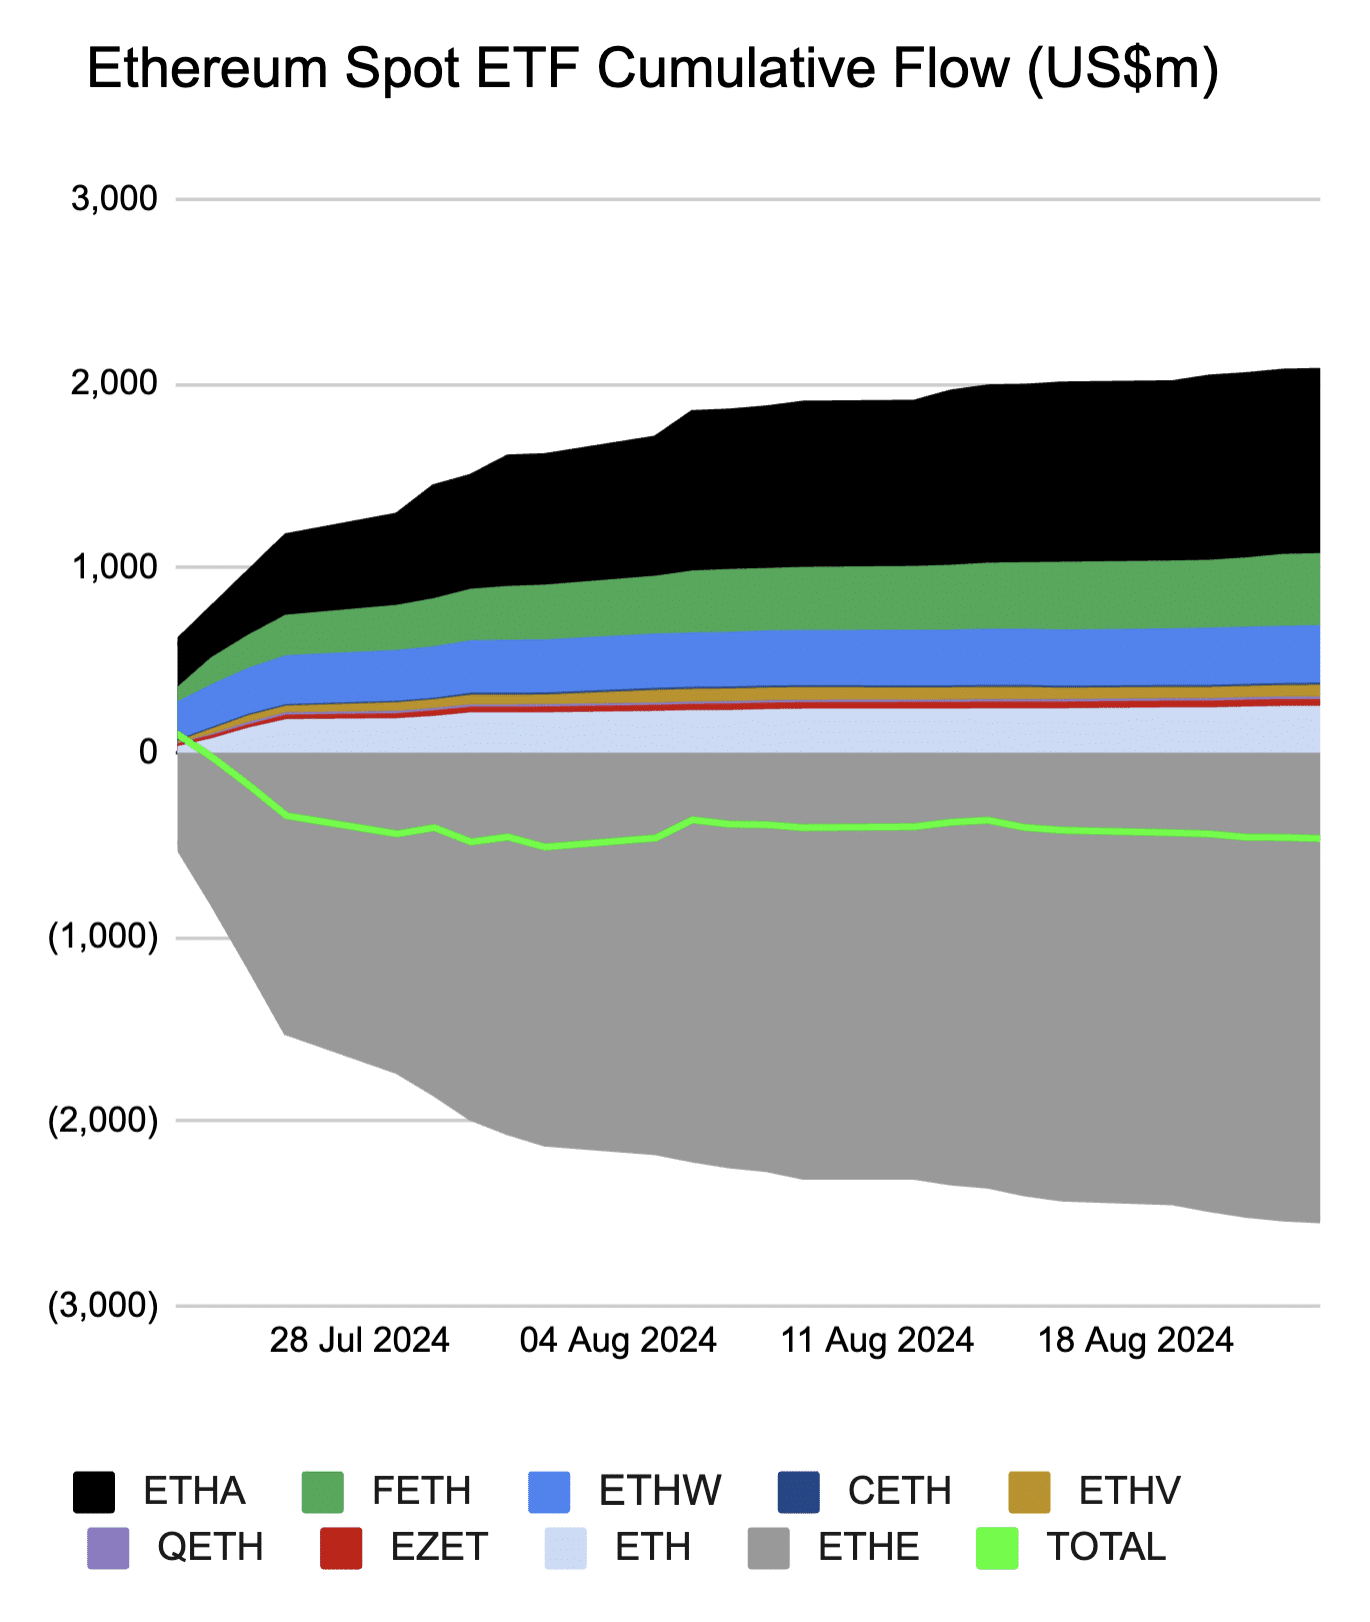
An Ethereum ETF holds a certain amount of Ethereum, and each share represents a fraction of the total Ethereum it holds. When many investors want to buy ETF shares, the demand can push the price of the ETF shares above the actual value of the underlying Ethereum. In this case, Authorized Participants (APs), large financial institutions that work closely with the ETF provider, step in. The APs purchase ETH on the open market and exchange it with the ETF provider for new ETF shares, which they then sell to investors in the market at a higher price, making a profit. The process increases the supply of ETF shares, which helps bring the share price back in line with the value of the underlying assets.
Conversely, when there is low demand for the ETF, the price of its shares might fall below the value of the underlying Ethereum. Here, APs buy the undervalued ETF shares from the market, return them to the ETF provider, and receive Ethereum in exchange. They can then sell Ethereum on the open market at a higher price, profiting from the arbitrage. This reduces the supply of ETF shares and helps the price align more closely with the value of the underlying Ethereum.
Simply put, the ETH selling from APs as they redeem ETF shares could be one of the reasons why ETH’s price is down and struggling to recover.
Conclusion
While current data might suggest a bearish outlook for Ethereum, it remains a fundamentally strong asset. The number of active addresses on both its main chain and Layer 2 networks continues to increase. Ethereum still leads the blockchain industry, holding the top spot in total value locked (TVL) across DeFi platforms, with many projects being developed on its ecosystem. Furthermore, Ethereum continues to see regular development and upgrades.
However, given the current market conditions and the ongoing ETF outflows, Ethereum may not be the best investment in the short term, particularly through the rest of 2024. Yet, as we look forward to 2025, starting in Q1, Ethereum is likely to regain its momentum and could once again outperform Bitcoin in terms of returns, much like it has in previous market cycles.
Disclosure: This article does not represent investment advice. The content and materials featured on this page are for educational purposes only.
Source link
You may like


Here’s why Stellar Price Could Go Parabolic Soon

Perp-Focused HyperLiquid Experiences Record $60M in USDC Net Outflows


Experts say these 3 altcoins will rally 3,000% soon, and XRP isn’t one of them


Robert Kiyosaki Hints At Economic Depression Ahead, What It Means For BTC?


BNB Steadies Above Support: Will Bullish Momentum Return?


Metaplanet makes largest Bitcoin bet, acquires nearly 620 BTC
24/7 Cryptocurrency News
Robert Kiyosaki Hints At Economic Depression Ahead, What It Means For BTC?
Published
3 hours agoon
December 23, 2024By
admin
Rich Dad Poor Dad author Robert Kiyosaki has issued a stark warning while hinting towards an economic depression ahead. In a recent X post, the renowned author said that the global market crash has already started, as he predicted earlier, which indicates that the financial market might enter a “depression” phase. Notably, this comes as the crypto market records immense volatility, sparking concerns over what’s next for Bitcoin (BTC).
Robert Kiyosaki Hints At Economic Depression Ahead
Robert Kiyosaki, in a recent X post, has revealed a stark warning of a looming economic depression. The Rich Dad Poor Dad author warned that a global market crash has already begun, citing Europe, China, and the U.S. as regions facing significant downturns.
In his post, Kiyosaki urged caution, advising individuals to safeguard their finances and maintain their jobs. “Global crash has started. Europe, China, USA going down. Depression ahead?” he asked while emphasizing the enduring value of assets like gold, silver, and Bitcoin. He added, “For many people, crashes are the best times to get rich.”
This warning aligns with Kiyosaki’s earlier prediction of what he called the “biggest crash in history.” Earlier this month, he encouraged his followers to prepare for financial turmoil, stating, “Please be proactive and get rich… before the BOOMER’s go BUST.”
However, this recent comment from Robert Kiyosaki indicates his sustained confidence in BTC. As the crypto market faces heightened volatility, Bitcoin could emerge as a hedge against traditional market instability, he noted. Besides, it also indicates that the flagship crypto, alongside gold and silver, might continue to gain traction amid this economic turmoil.
What’s Next For BTC?
Bitcoin price today has continued its volatile trading, losing nearly 1.5% over the last 24 hours to $95,323. The crypto touched a high and low of $97,260 and $93,690 in the last 24 hours, showcasing the highly volatile scenario in the market.
In addition, the US Spot Bitcoin ETF also recorded significant outflow, with BlackRock Bitcoin ETF witnessing its largest outflux since its launch. This has weighed on the investors’ sentiment, sparking concerns over a waning institutional interest.
However, despite that, many experts remained confident on the asset’s future trajectory. For context, in a recent X post, Peter Brandt shared a new BTC price target, indicating his confidence in the digital asset.
On the other hand, institutions like Metaplanet have also continued to boost their BTC holdings. These moves indicates that the institutions, as well as many investors, are bullish towards the long-term potential of the crypto. Besides, as Robert Kiyosaki said, the recent dip also provides a buying opportunity to investors, which might further boost Bitcoin to its new ATH ahead.
Rupam Roy
Rupam is a seasoned professional with three years of experience in the financial market, where he has developed a reputation as a meticulous research analyst and insightful journalist. He thrives on exploring the dynamic nuances of the financial landscape. Currently serving as a sub-editor at Coingape, Rupam’s expertise extends beyond conventional boundaries. His role involves breaking stories, analyzing AI-related developments, providing real-time updates on the crypto market, and presenting insightful economic news.
Rupam’s career is characterized by a deep passion for unraveling the complexities of finance and delivering impactful stories that resonate with a diverse audience.
Disclaimer: The presented content may include the personal opinion of the author and is subject to market condition. Do your market research before investing in cryptocurrencies. The author or the publication does not hold any responsibility for your personal financial loss.
Source link
Bitcoin
Metaplanet makes largest Bitcoin bet, acquires nearly 620 BTC
Published
5 hours agoon
December 23, 2024By
admin

Tokyo-listed Metaplanet has purchased another 9.5 billion yen ($60.6 million) worth of Bitcoin, pushing its holdings to 1,761.98 BTC.
Metaplanet, a publicly traded Japanese company, has acquired 619.7 Bitcoin as part of its crypto treasury strategy, paying an average of 15,330,073 yen per (BTC), with a total investment of 9.5 billion yen.
According to the company’s latest financial disclosure, Metaplanet’s total Bitcoin holdings now stand at 1,761.98 BTC, with an average purchase price of 11,846,002 yen (~$75,628) per Bitcoin. The company has spent 20.872 billion yen in total on Bitcoin acquisitions, the document reads.
The latest purchase is the largest so far for the Tokyo-headquartered company and comes just days after Metaplanet issued its 5th Series of Ordinary Bonds via private placement with EVO FUND, raising 5 billion yen (approximately $32 million).
The proceeds from this issuance, as disclosed earlier, were allocated specifically for purchasing Bitcoin. These bonds, set to mature in June 2025, carry no interest and allow for early redemption under specific conditions.
Metaplanet buys dip
The company also shared updates on its BTC Yield, a metric used to measure the growth of Bitcoin holdings relative to fully diluted shares. From Oct. 1 to Dec. 23, Metaplanet’s BTC Yield surged to 309.82%, up from 41.7% in the previous quarter.
Bitcoin itself has seen strong performance this year, climbing 120% and outperforming assets like the Nasdaq 100 and S&P 500 indices. However, it has recently pulled back from its all-time high of $108,427, trading at $97,000 after the Federal Reserve indicated only two interest rate cuts in 2025.
Despite the retreat, on-chain metrics indicate that Bitcoin is still undervalued based on its Market Value to Realized Value (MVRV-Z) score, which stands at 2.84 — below the threshold of 3.7 that historically signals an asset is overvalued.
Source link
Altcoin Season
End of Altcoin Season? Glassnode Co-Founders Warn Alts in Danger of Lagging Behind After Last Week’s Correction
Published
9 hours agoon
December 23, 2024By
admin
The creators of the crypto analytics firm Glassnode are warning that altcoins could lose all bullish momentum following last week’s market correction.
Jan Happel and Yann Allemann, who go by the handle Negentropic on the social media platform X, tell their 63,400 followers that “altcoin season,” which they say began in late November, could come to an abrupt end after alts witnessed deep pullbacks over the last seven days.
According to the Glassnode co-founders, traders and investors will likely have a risk-off approach on altcoins unless Bitcoin recovers a key psychological price point.
“Is This the End of Altcoin Season?
Bitcoin dominance is surging after dipping below $100,000, while altcoins are losing critical supports. Dominance has risen and resumed its upward trend, signaling a stronger BTC environment.
If BTC stabilizes above $100,00, we might see a pump in altcoins now in accumulation zones. Until then, Bitcoin appears poised to lead, leaving altcoins lagging behind.”
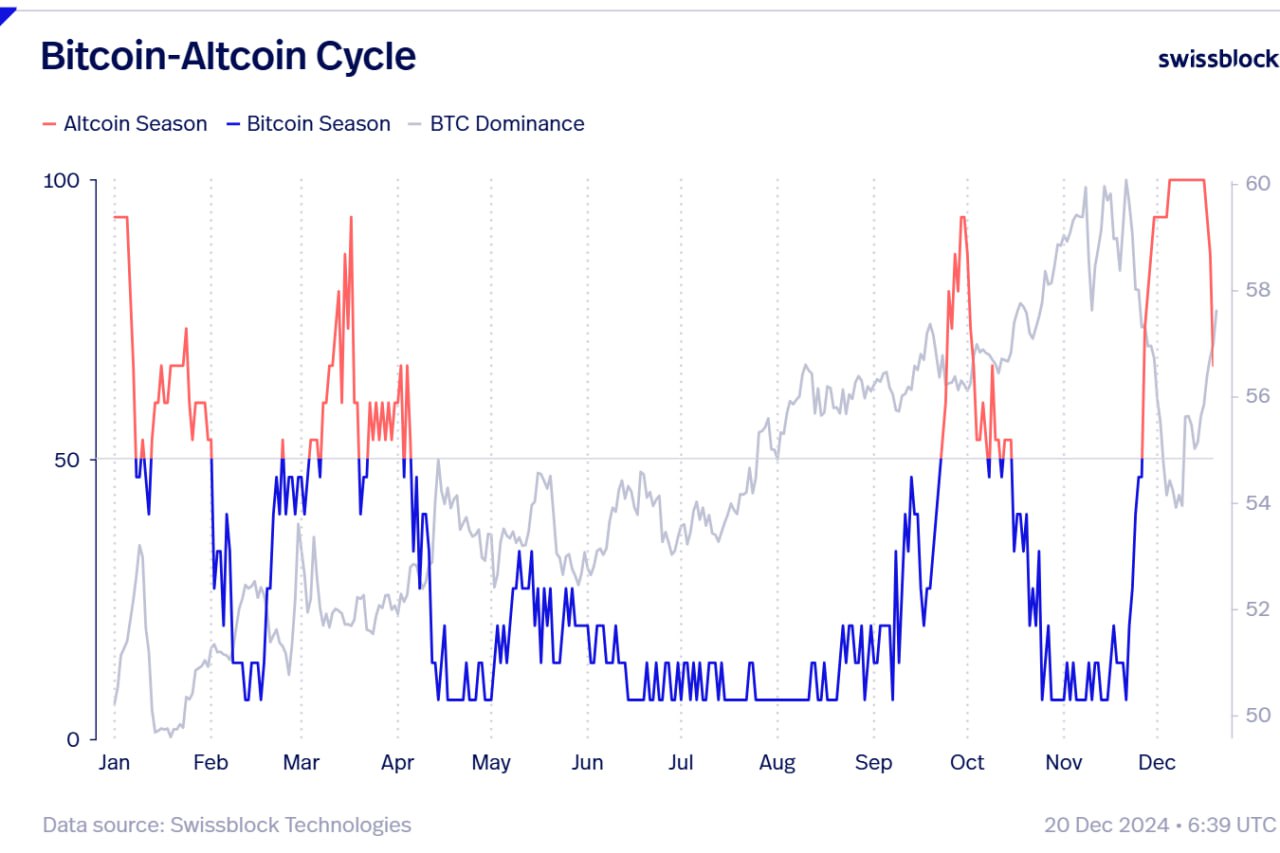
The Bitcoin Dominance (BTC.D) chart tracks how much of the total crypto market cap belongs to BTC. In the current state of the market, a surging BTC.D suggests that altcoins are losing value faster than Bitcoin.
At time of writing, BTC.D is hovering at 59%.
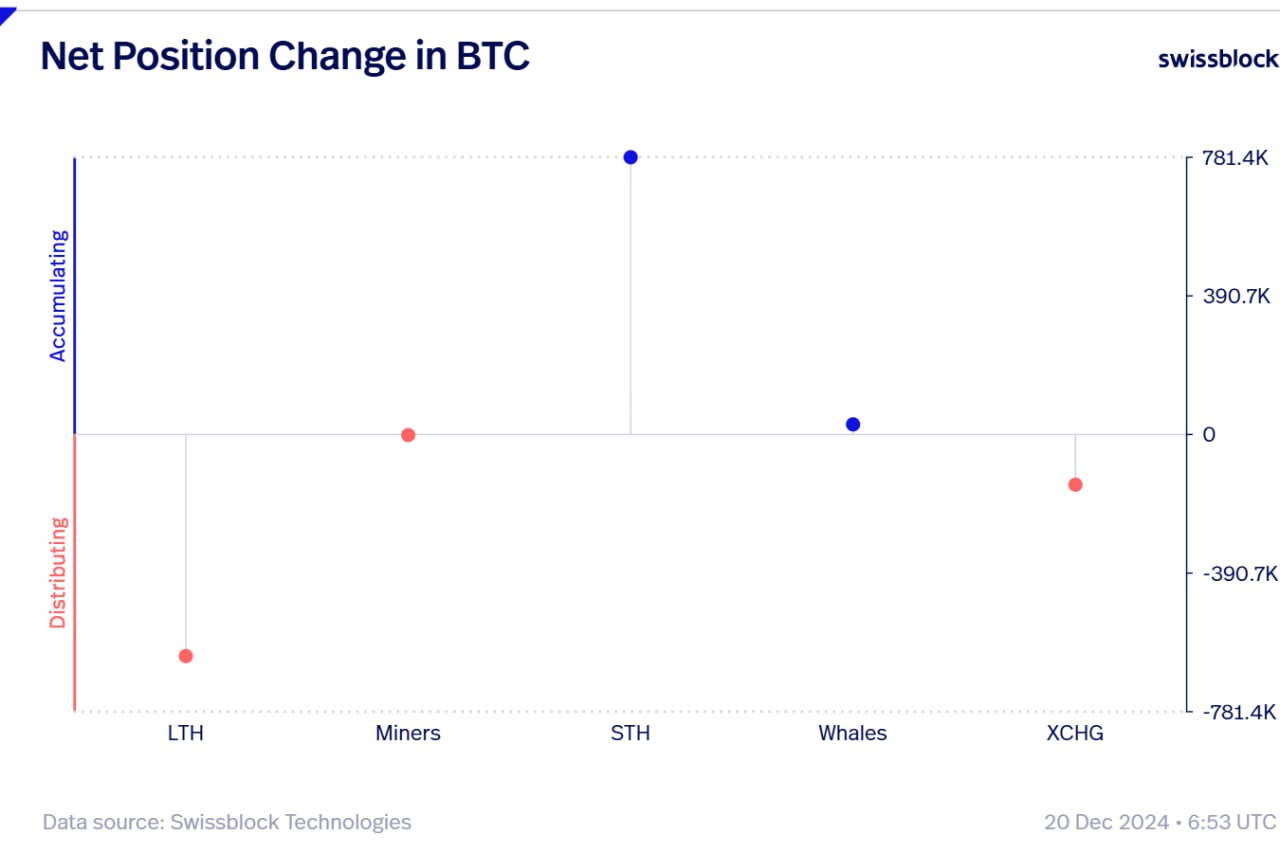
Looking at Bitcoin itself, the Glassnode executives say long-term Bitcoin holders are massively unloading their holdings as other investor cohorts pick up the slack.
“The Board Keeps Shifting.
As BTC continues flowing out of exchanges during this dip, long-term holders are exiting forcefully, while short-term holders step in without hesitation.
Whales quietly accumulate, miners remain neutral, and selling pressure has merely reshuffled the board.
New hands are absorbing the sales.”
At time of writing, Bitcoin is worth $97,246.
Don’t Miss a Beat – Subscribe to get email alerts delivered directly to your inbox
Check Price Action
Follow us on X, Facebook and Telegram
Surf The Daily Hodl Mix
 

Disclaimer: Opinions expressed at The Daily Hodl are not investment advice. Investors should do their due diligence before making any high-risk investments in Bitcoin, cryptocurrency or digital assets. Please be advised that your transfers and trades are at your own risk, and any losses you may incur are your responsibility. The Daily Hodl does not recommend the buying or selling of any cryptocurrencies or digital assets, nor is The Daily Hodl an investment advisor. Please note that The Daily Hodl participates in affiliate marketing.
Generated Image: DALLE3
Source link

Here’s why Stellar Price Could Go Parabolic Soon

Perp-Focused HyperLiquid Experiences Record $60M in USDC Net Outflows

Experts say these 3 altcoins will rally 3,000% soon, and XRP isn’t one of them

Robert Kiyosaki Hints At Economic Depression Ahead, What It Means For BTC?

BNB Steadies Above Support: Will Bullish Momentum Return?

Metaplanet makes largest Bitcoin bet, acquires nearly 620 BTC

Tron’s Justin Sun Offloads 50% ETH Holdings, Ethereum Price Crash Imminent?

Investors bet on this $0.0013 token destined to leave Cardano and Shiba Inu behind

End of Altcoin Season? Glassnode Co-Founders Warn Alts in Danger of Lagging Behind After Last Week’s Correction

Can Pi Network Price Triple Before 2024 Ends?

XRP’s $5, $10 goals are trending, but this altcoin with 7,400% potential takes the spotlight

CryptoQuant Hails Binance Reserve Amid High Leverage Trading

Trump Picks Bo Hines to Lead Presidential Crypto Council

The introduction of Hydra could see Cardano surpass Ethereum with 100,000 TPS

Top 4 Altcoins to Hold Before 2025 Alt Season
182267361726451435

Why Did Trump Change His Mind on Bitcoin?

Top Crypto News Headlines of The Week

New U.S. president must bring clarity to crypto regulation, analyst says

Will XRP Price Defend $0.5 Support If SEC Decides to Appeal?

Bitcoin Open-Source Development Takes The Stage In Nashville

Ethereum, Solana touch key levels as Bitcoin spikes

Bitcoin 20% Surge In 3 Weeks Teases Record-Breaking Potential

Ethereum Crash A Buying Opportunity? This Whale Thinks So

Shiba Inu Price Slips 4% as 3500% Burn Rate Surge Fails to Halt Correction

Washington financial watchdog warns of scam involving fake crypto ‘professors’

‘Hamster Kombat’ Airdrop Delayed as Pre-Market Trading for Telegram Game Expands

Citigroup Executive Steps Down To Explore Crypto
Mostbet Güvenilir Mi – Casino Bonus 2024

NoOnes Bitcoin Philosophy: Everyone Eats
Trending

 3 months ago
182267361726451435

 Donald Trump5 months ago
Why Did Trump Change His Mind on Bitcoin?

 24/7 Cryptocurrency News4 months ago
Top Crypto News Headlines of The Week

 News4 months ago
New U.S. president must bring clarity to crypto regulation, analyst says

 Price analysis4 months ago
Will XRP Price Defend $0.5 Support If SEC Decides to Appeal?

 Opinion5 months ago
Bitcoin Open-Source Development Takes The Stage In Nashville

 Bitcoin5 months ago
Ethereum, Solana touch key levels as Bitcoin spikes

 Bitcoin5 months ago
Bitcoin 20% Surge In 3 Weeks Teases Record-Breaking Potential


✓ Share: