Bitcoin
Can RNDR reach $25 in 2025?
Published
5 months agoon
By
admin
With the 2025 bull run around the corner, the Render Network price can rise dramatically. The surge in demand for 3D graphics in entertainment raises the question: Could RENDER soar to $25 by 2025? Let’s explore the factors at play.
What is Render?
The Render Network is a decentralized platform for GPU rendering that allows artists to use powerful GPU nodes worldwide for their projects on demand. Node providers contribute their unused GPU power to a blockchain-based marketplace, which enables faster and cheaper rendering than traditional centralized services. In this system, the Render token serves as the medium of exchange between users and providers of GPU power.
Moreover, Render Network is part of the OTOY technology stack, which uses OctaneRender software. The integration extends to widely used applications such as Blender, Adobe After Effects, Houdini, Autodesk Maya, Unreal Engine, and more.
Market potential
The entertainment industry, particularly gaming and cinema, is the primary market for 3D graphics rendering. The demand for computer-generated imagery (CGI) and animation only continues to grow. For example, according to PwC Global, the entertainment sector can potentially exceed $3 trillion in value.
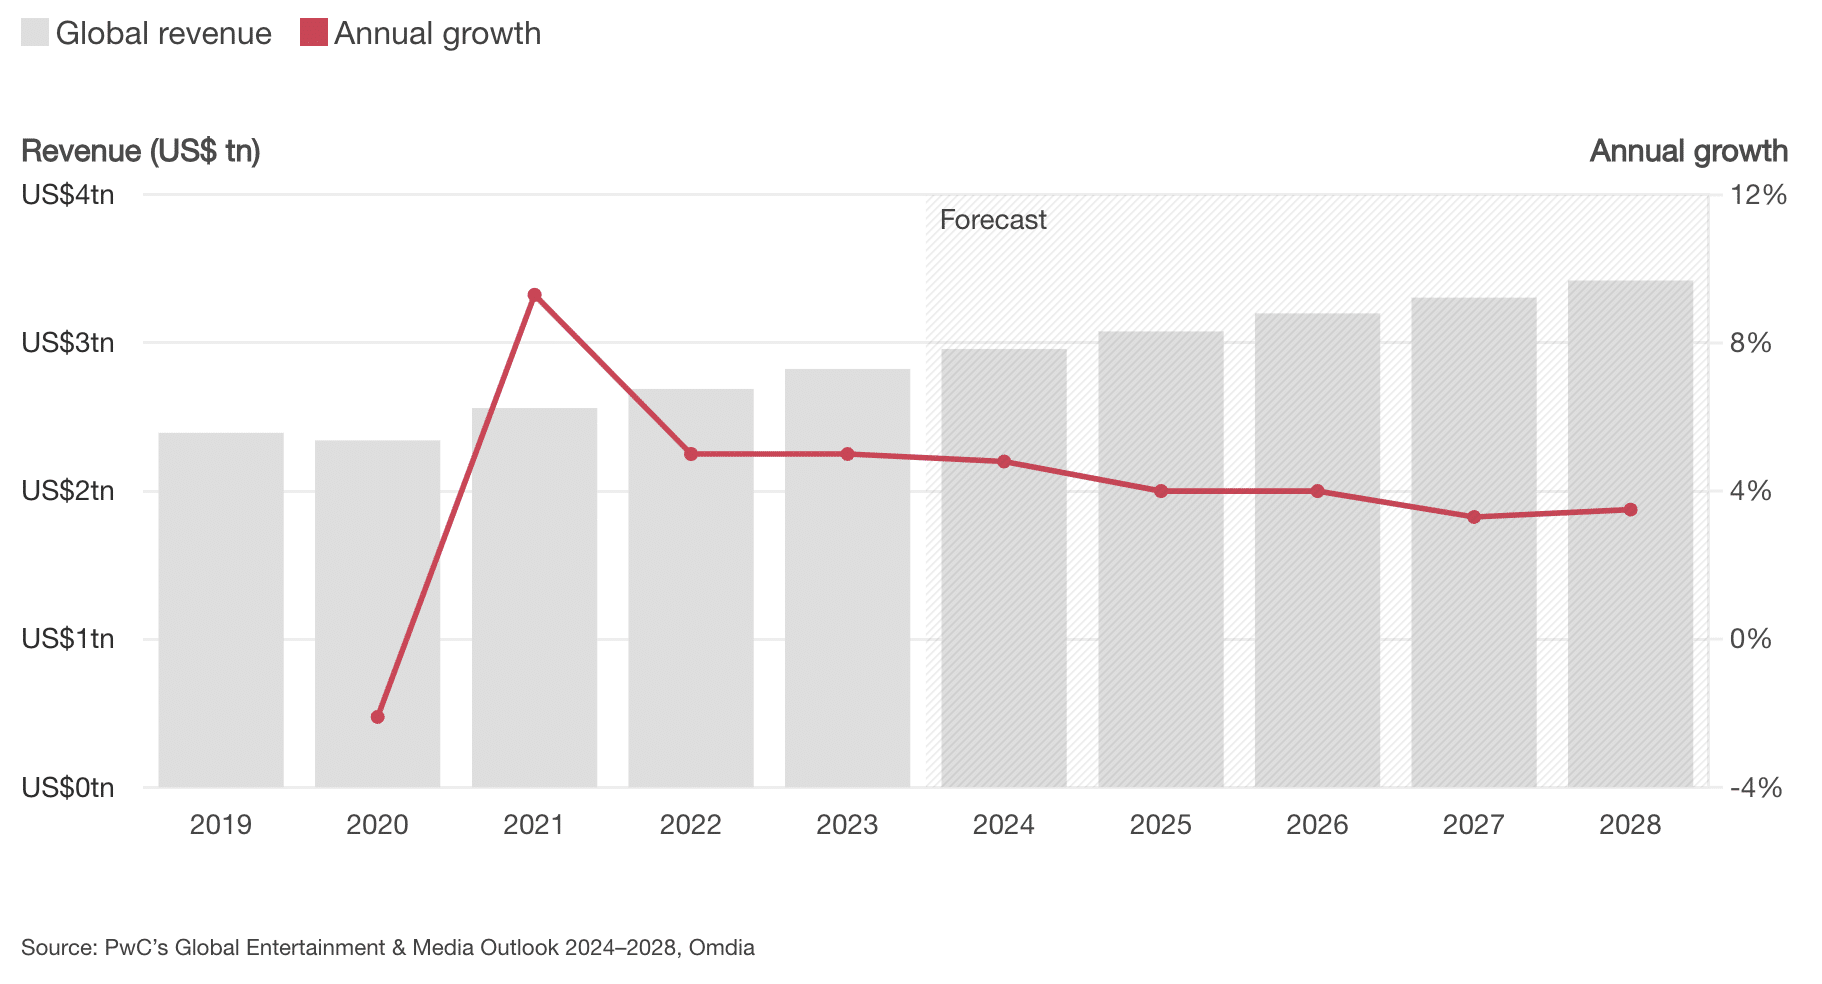
The growing demand for 3D graphics will favor platforms such as Render that offer scalable rendering services. Additionally, the Render Network’s availability on multiple blockchain networks – Ethereum, Polygon, and Solana – provides additional flexibility and reach. Among these, Solana stands out as particularly capable of handling increased rendering workloads due to its high scalability and cheap transaction fees.
Furthermore, Render has already collaborated with major productions, including the VR experience for “Batman: The Animated Series” and the opening titles for “Westworld.”
Market position
As of July 25, Render Network is number 2 in distributed computing, second only to Internet Computer, and ranks 32nd in the broader crypto market with a market cap of around $2.6 billion.
While some folks might be popping hopium pills and dreaming of tokens skyrocketing to $100 or even $1,000, the price analysis must be realistic. Render’s already high-ranking position limits its growth potential. It’s not really about crushing dreams but about looking at the market with clear eyes instead of rose-tinted glasses.
Inflation and supply
Render Network does not face significant concerns over token unlocks, as most tokens have already been unlocked. The only new tokens entering circulation are due to the inflation rate, set at 760,567 RENDER per month to incentivize users. However, the actual circulating supply has inflated differently. From January 2024 to July 2024, the supply increased by 18,950,928 RENDER, resulting in a 5.1% inflation rate over six months.
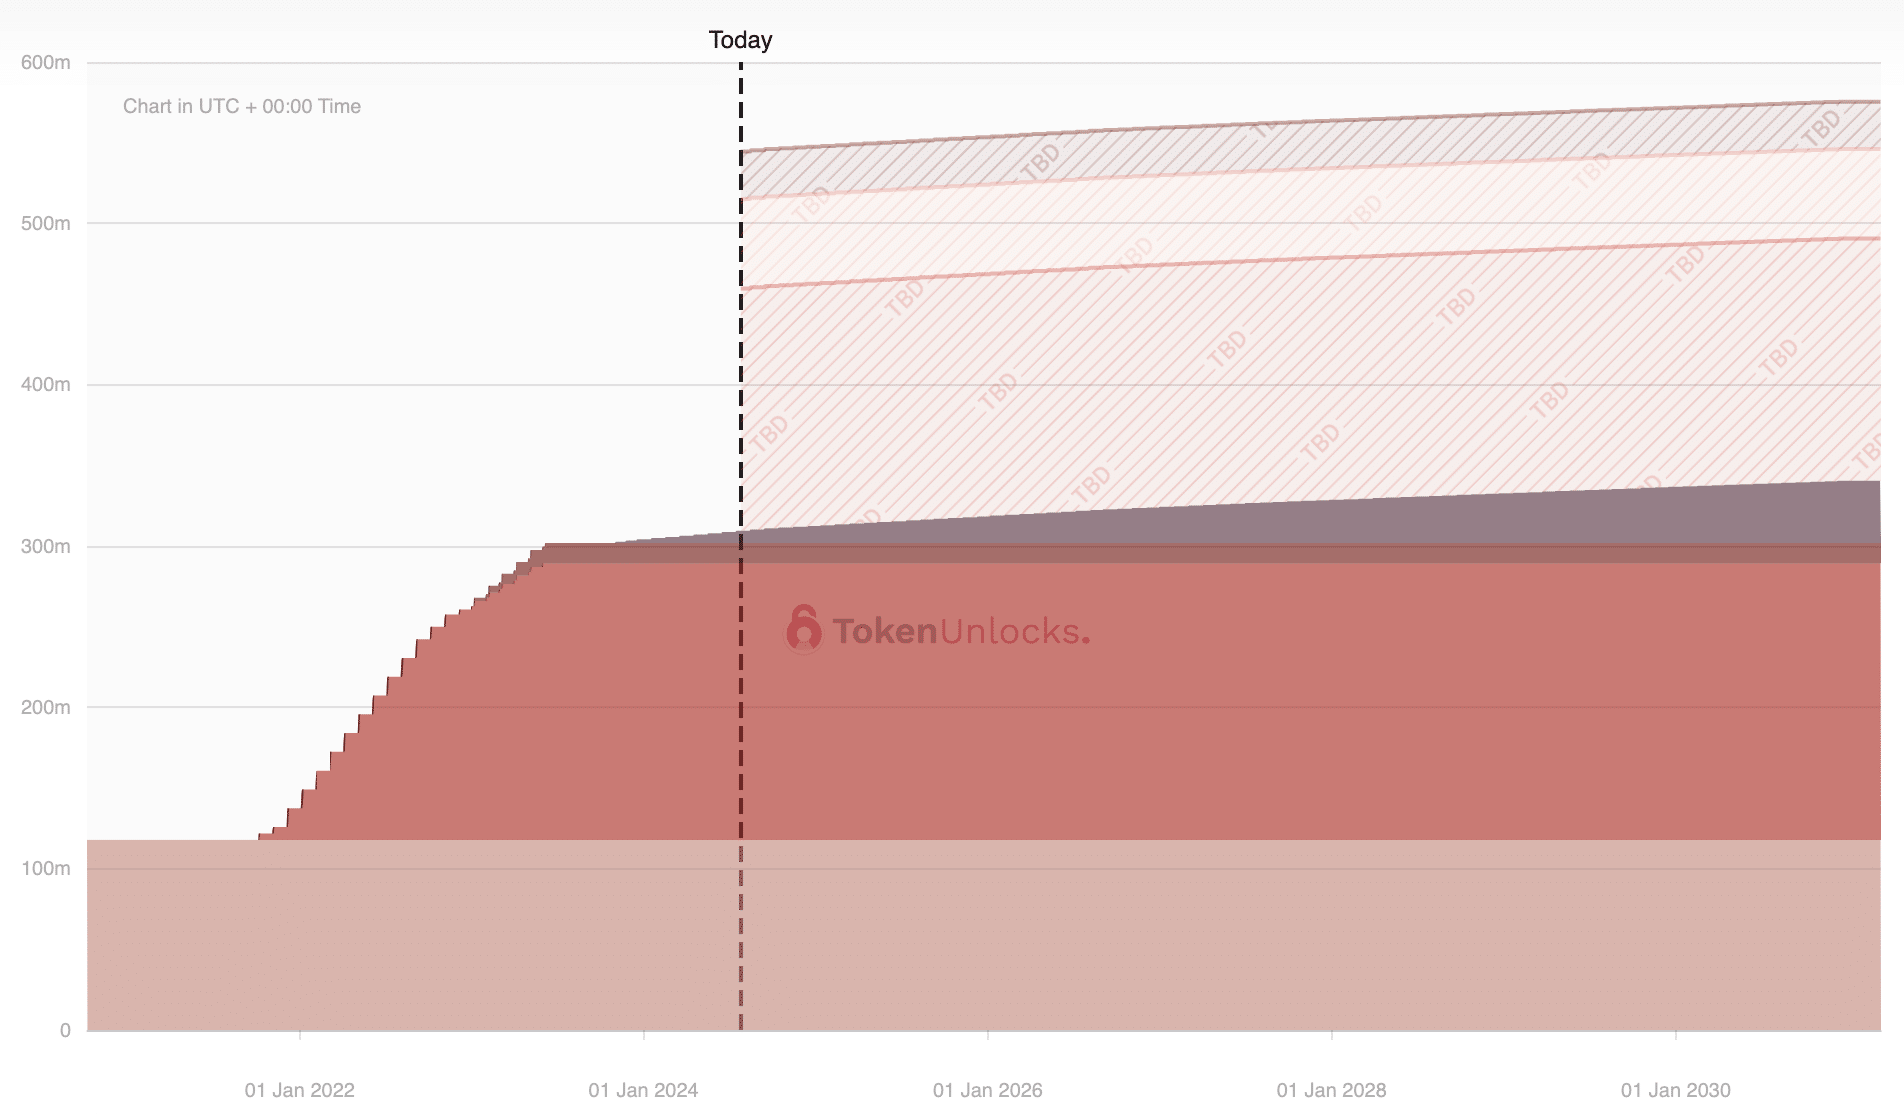
The Burn Mint Equilibrium deflationary mechanism has not prevented this level of inflation. If the trend continues, the annual inflation rate will reach 10.2%. This metric is crucial for forecasting the supply by mid-2025 to accurately assess the token’s valuation. Starting with a supply of 390,859,381 tokens, the projected supply would be approximately 430,727,038 RENDER.
Correlation with Bitcoin price movements
Analysis of the Pearson correlation coefficient between RENDER and BTC from 2020 to July 2024 shows a correlation of 0.727. The result indicates a strong linear relationship, with RENDER’s price movements closely following BTC’s.
The analysis also looked at the yearly standard deviations for RENDER and BTC, which were 1.725 and 0.616, respectively. Furthermore, RENDER had annual returns of 235.69%, while BTC had 62.98%. These numbers helped create a model to predict RENDER’s price changes based on BTC’s movements.
| RENDER | BTC | |
|---|---|---|
| Annual Return | 235.69% | 62.98% |
| Annual St. Deviation | 1.725 | 0.616 |
| Pearson Correlation Coefficient | 0.727 | 0.727 |
Render’s 2025 bull run price analysis
We developed a model with three scenarios: bear case, base case, and bull case. These scenarios correspond to BTC prices in 2025 of $100,000, $150,000, and $200,000, respectively. By standardizing the changes in BTC and RENDER, we calculated the expected price for RENDER in each scenario. The calculations assume a BTC price of $65,000 and a RENDER price of $6.80 as the starting points:
| Bear Case | Base Case | Bull Case | |
|---|---|---|---|
| BTC | $100,000 | $150,000 | $200,000 |
| RENDER | $14.26 | $24.91 | $35.57 |
The base case scenario appears to be the most realistic. Given the calculated supply, it projects RENDER reaching a market cap of approximately $10.73 billion and a price of $24.91. This market cap seems achievable, considering RENDER will not be the only token to rise during a bull run.
Disclosure: This article does not represent investment advice. The content and materials featured on this page are for educational purposes only.
Source link
You may like


BNB Steadies Above Support: Will Bullish Momentum Return?


Metaplanet makes largest Bitcoin bet, acquires nearly 620 BTC


Tron’s Justin Sun Offloads 50% ETH Holdings, Ethereum Price Crash Imminent?


Investors bet on this $0.0013 token destined to leave Cardano and Shiba Inu behind


End of Altcoin Season? Glassnode Co-Founders Warn Alts in Danger of Lagging Behind After Last Week’s Correction

Can Pi Network Price Triple Before 2024 Ends?
Bitcoin
Metaplanet makes largest Bitcoin bet, acquires nearly 620 BTC
Published
49 minutes agoon
December 23, 2024By
admin

Tokyo-listed Metaplanet has purchased another 9.5 billion yen ($60.6 million) worth of Bitcoin, pushing its holdings to 1,761.98 BTC.
Metaplanet, a publicly traded Japanese company, has acquired 619.7 Bitcoin as part of its crypto treasury strategy, paying an average of 15,330,073 yen per (BTC), with a total investment of 9.5 billion yen.
According to the company’s latest financial disclosure, Metaplanet’s total Bitcoin holdings now stand at 1,761.98 BTC, with an average purchase price of 11,846,002 yen (~$75,628) per Bitcoin. The company has spent 20.872 billion yen in total on Bitcoin acquisitions, the document reads.
The latest purchase is the largest so far for the Tokyo-headquartered company and comes just days after Metaplanet issued its 5th Series of Ordinary Bonds via private placement with EVO FUND, raising 5 billion yen (approximately $32 million).
The proceeds from this issuance, as disclosed earlier, were allocated specifically for purchasing Bitcoin. These bonds, set to mature in June 2025, carry no interest and allow for early redemption under specific conditions.
Metaplanet buys dip
The company also shared updates on its BTC Yield, a metric used to measure the growth of Bitcoin holdings relative to fully diluted shares. From Oct. 1 to Dec. 23, Metaplanet’s BTC Yield surged to 309.82%, up from 41.7% in the previous quarter.
Bitcoin itself has seen strong performance this year, climbing 120% and outperforming assets like the Nasdaq 100 and S&P 500 indices. However, it has recently pulled back from its all-time high of $108,427, trading at $97,000 after the Federal Reserve indicated only two interest rate cuts in 2025.
Despite the retreat, on-chain metrics indicate that Bitcoin is still undervalued based on its Market Value to Realized Value (MVRV-Z) score, which stands at 2.84 — below the threshold of 3.7 that historically signals an asset is overvalued.
Source link
Altcoin Season
End of Altcoin Season? Glassnode Co-Founders Warn Alts in Danger of Lagging Behind After Last Week’s Correction
Published
4 hours agoon
December 23, 2024By
admin
The creators of the crypto analytics firm Glassnode are warning that altcoins could lose all bullish momentum following last week’s market correction.
Jan Happel and Yann Allemann, who go by the handle Negentropic on the social media platform X, tell their 63,400 followers that “altcoin season,” which they say began in late November, could come to an abrupt end after alts witnessed deep pullbacks over the last seven days.
According to the Glassnode co-founders, traders and investors will likely have a risk-off approach on altcoins unless Bitcoin recovers a key psychological price point.
“Is This the End of Altcoin Season?
Bitcoin dominance is surging after dipping below $100,000, while altcoins are losing critical supports. Dominance has risen and resumed its upward trend, signaling a stronger BTC environment.
If BTC stabilizes above $100,00, we might see a pump in altcoins now in accumulation zones. Until then, Bitcoin appears poised to lead, leaving altcoins lagging behind.”
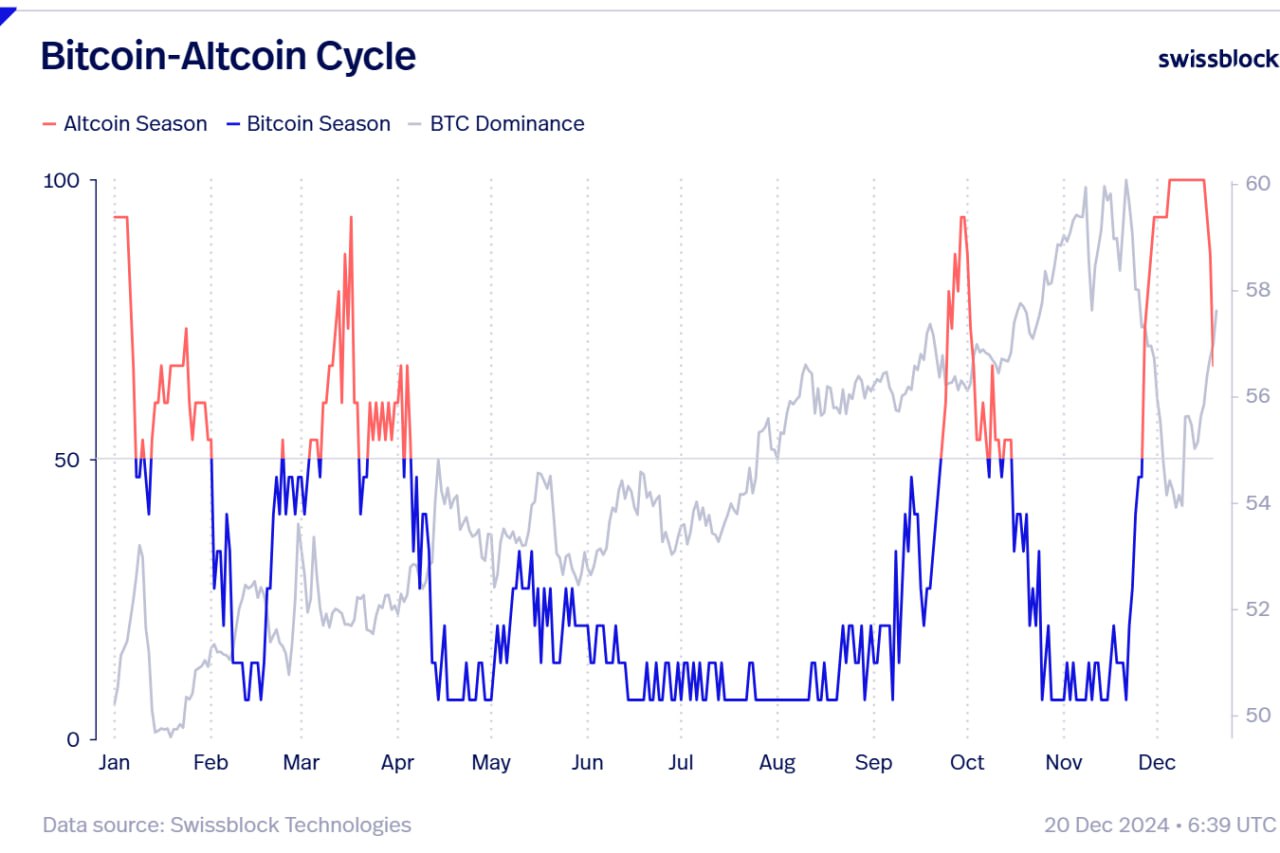
The Bitcoin Dominance (BTC.D) chart tracks how much of the total crypto market cap belongs to BTC. In the current state of the market, a surging BTC.D suggests that altcoins are losing value faster than Bitcoin.
At time of writing, BTC.D is hovering at 59%.
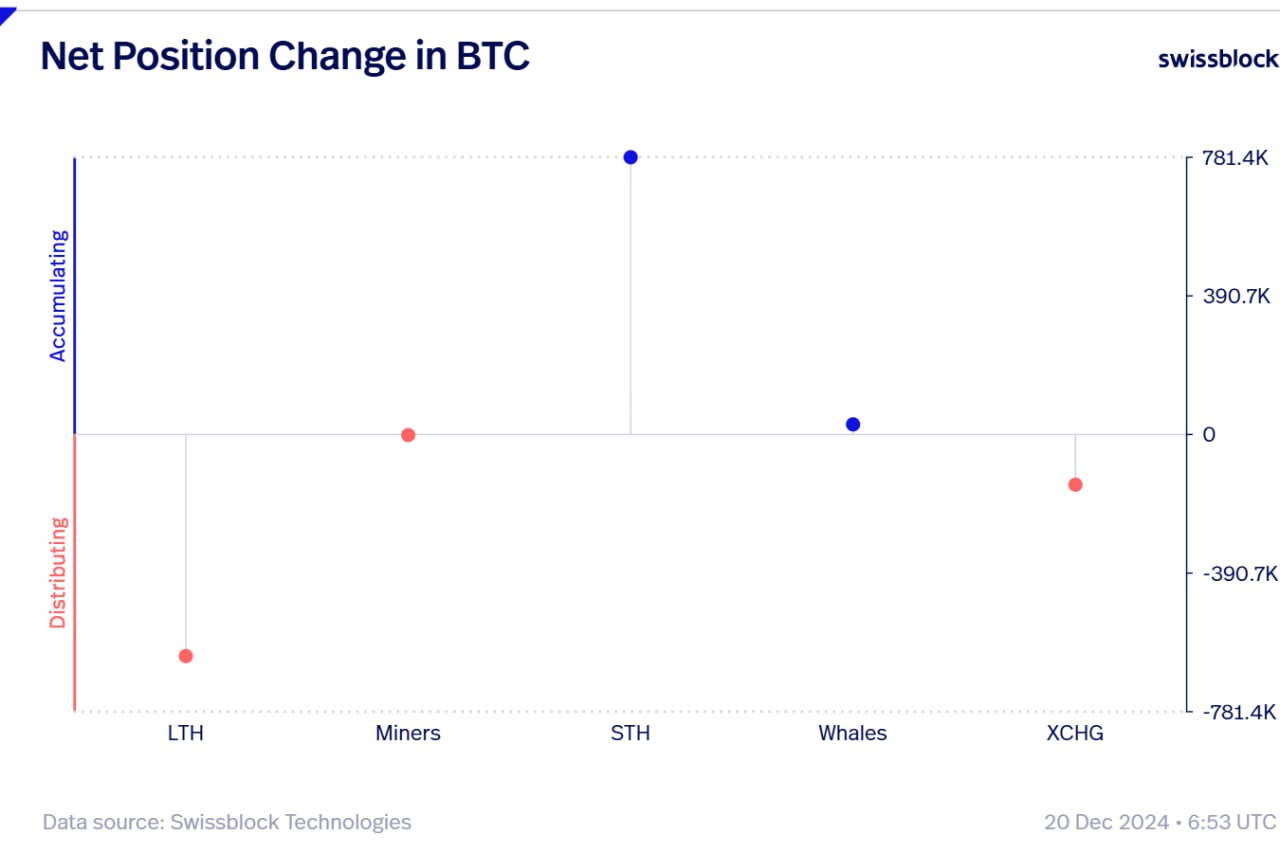
Looking at Bitcoin itself, the Glassnode executives say long-term Bitcoin holders are massively unloading their holdings as other investor cohorts pick up the slack.
“The Board Keeps Shifting.
As BTC continues flowing out of exchanges during this dip, long-term holders are exiting forcefully, while short-term holders step in without hesitation.
Whales quietly accumulate, miners remain neutral, and selling pressure has merely reshuffled the board.
New hands are absorbing the sales.”
At time of writing, Bitcoin is worth $97,246.
Don’t Miss a Beat – Subscribe to get email alerts delivered directly to your inbox
Check Price Action
Follow us on X, Facebook and Telegram
Surf The Daily Hodl Mix
 

Disclaimer: Opinions expressed at The Daily Hodl are not investment advice. Investors should do their due diligence before making any high-risk investments in Bitcoin, cryptocurrency or digital assets. Please be advised that your transfers and trades are at your own risk, and any losses you may incur are your responsibility. The Daily Hodl does not recommend the buying or selling of any cryptocurrencies or digital assets, nor is The Daily Hodl an investment advisor. Please note that The Daily Hodl participates in affiliate marketing.
Generated Image: DALLE3
Source link
Altcoins
Bitwise CIO Matt Hougan Predicts Institutional Interest in Altcoins, Says 2025 the Year of Crypto Diversification
Published
20 hours agoon
December 22, 2024By
admin
Bitwise CIO Matt Hougan says a wave of institutional interest in altcoins is coming next year, largely due to potential regulatory clarity and more exchange-traded funds (ETFs).
In a new interview with Bloomberg, Hougan says that institutional money is in the early stages of broadening out to other crypto assets besides just Bitcoin (BTC).
Hougan forecasts that 2025 will be the year that institutional investors will begin to incorporate more diversification in their crypto-investing strategies the same way they do in other asset classes like equities or bonds.
“You’re already seeing it broaden out actually. A lot of people were worried about the Ethereum ETFs for instance, which launched this summer and had tepid inflows.
But over the last month or so, you’ve seen billions of dollars flow into those products.
Again, the things that have happened in crypto in the past keep happening. Historically, most people enter crypto through Bitcoin, and then they discover Ethereum, and then they think about Solana. There’s no reason to assume that the institutions that came into Bitcoin won’t move on to other assets in the future.
In fact, I think in 2025, you’re going to see an explosion of interest in index space strategies that give diversified exposure to crypto. Of course, [that is] something we’ve been doing at Bitwise since 2017 when we pioneered that concept. I think 2025 is when that becomes a mainstream way to allocate to this space, the same way it is to stocks and bonds and real estate and everything else.”
Don’t Miss a Beat – Subscribe to get email alerts delivered directly to your inbox
Check Price Action
Follow us on X, Facebook and Telegram
Surf The Daily Hodl Mix
 

Disclaimer: Opinions expressed at The Daily Hodl are not investment advice. Investors should do their due diligence before making any high-risk investments in Bitcoin, cryptocurrency or digital assets. Please be advised that your transfers and trades are at your own risk, and any losses you may incur are your responsibility. The Daily Hodl does not recommend the buying or selling of any cryptocurrencies or digital assets, nor is The Daily Hodl an investment advisor. Please note that The Daily Hodl participates in affiliate marketing.
Featured Image: Shutterstock/Julien Tromeur/Sensvector
Source link

BNB Steadies Above Support: Will Bullish Momentum Return?

Metaplanet makes largest Bitcoin bet, acquires nearly 620 BTC

Tron’s Justin Sun Offloads 50% ETH Holdings, Ethereum Price Crash Imminent?

Investors bet on this $0.0013 token destined to leave Cardano and Shiba Inu behind

End of Altcoin Season? Glassnode Co-Founders Warn Alts in Danger of Lagging Behind After Last Week’s Correction

Can Pi Network Price Triple Before 2024 Ends?

XRP’s $5, $10 goals are trending, but this altcoin with 7,400% potential takes the spotlight

CryptoQuant Hails Binance Reserve Amid High Leverage Trading

Trump Picks Bo Hines to Lead Presidential Crypto Council

The introduction of Hydra could see Cardano surpass Ethereum with 100,000 TPS

Top 4 Altcoins to Hold Before 2025 Alt Season

DeFi Protocol Usual’s Surge Catapults Hashnote’s Tokenized Treasury Over BlackRock’s BUIDL

DOGE & SHIB holders embrace Lightchain AI for its growth and unique sports-crypto vision

Will Shiba Inu Price Hold Critical Support Amid Market Volatility?

Chainlink price double bottoms as whales accumulate
182267361726451435

Why Did Trump Change His Mind on Bitcoin?

Top Crypto News Headlines of The Week

New U.S. president must bring clarity to crypto regulation, analyst says

Will XRP Price Defend $0.5 Support If SEC Decides to Appeal?

Bitcoin Open-Source Development Takes The Stage In Nashville

Ethereum, Solana touch key levels as Bitcoin spikes

Bitcoin 20% Surge In 3 Weeks Teases Record-Breaking Potential

Ethereum Crash A Buying Opportunity? This Whale Thinks So

Shiba Inu Price Slips 4% as 3500% Burn Rate Surge Fails to Halt Correction

Washington financial watchdog warns of scam involving fake crypto ‘professors’

‘Hamster Kombat’ Airdrop Delayed as Pre-Market Trading for Telegram Game Expands

Citigroup Executive Steps Down To Explore Crypto
Mostbet Güvenilir Mi – Casino Bonus 2024

NoOnes Bitcoin Philosophy: Everyone Eats
Trending

 3 months ago
182267361726451435

 Donald Trump5 months ago
Why Did Trump Change His Mind on Bitcoin?

 24/7 Cryptocurrency News4 months ago
Top Crypto News Headlines of The Week

 News4 months ago
New U.S. president must bring clarity to crypto regulation, analyst says

 Price analysis4 months ago
Will XRP Price Defend $0.5 Support If SEC Decides to Appeal?

 Opinion5 months ago
Bitcoin Open-Source Development Takes The Stage In Nashville

 Bitcoin5 months ago
Ethereum, Solana touch key levels as Bitcoin spikes

 Bitcoin5 months ago
Bitcoin 20% Surge In 3 Weeks Teases Record-Breaking Potential


