Price analysis
Can Sui Price Reach $2 As Grayscale’s SUI Trust Opens for Accredited Investors?
Published
3 months agoon
By
admin
Sui price is on a tear, gaining 13.1% in the last 24 hours and becoming the largest gainer in the top 100 coins on CoinGecko. The reason for the surge in price could be tied to an announcement from Grayscale regarding launching Sui Trust. As one of the leading asset management firms, Grayscale’s move signals increasing institutional interest in the Sui blockchain, driving curiosity around its potential impact on Sui’s token price.
The price of SUI is currently forming a bullish market structure, and a breakout could send it surging toward $2. This comes as analysts predict a Fed rate cut, which might positively impact the broader crypto market.
Will Accredited Investors (AKA Whales) Pump Sui Price?
Grayscale announced that Sui (SUI) Trust is now available for accredited investors, a move to strengthen institutional adoption in the crypto space.
Grayscale Sui Trust is open to eligible accredited investors seeking exposure to $SUI, a third-generation blockchain designed to help address scalability and transaction costs.
Click below to learn more about Grayscale Sui Trust or reach out to us: https://t.co/WgCAFA7E8L pic.twitter.com/gic7kJDzF6
— Grayscale (@Grayscale) September 11, 2024
This move will result in substantial gains for SUI because accredited investors have a net worth of $1 million or more. They can also be individuals with an annual income of $200,000 or more, expecting to maintain the same income level in the current year. In short, Grayscale is exposing Sui to traditional whale investors.
SUI price surged and broke above the $1 mark and is holding steady. The asset had struggled to break this barrier since June, when it first slipped below the price level. Sui tested $1 twice last month, and this round marks the third time.
SUI Price Technical Analysis: $2 In Sight If Markets Remain Bullish
The price of SUI is bullish on the daily time frame as it has broken above the 50-day and 200-day exponential moving averages (EMA). Sui flashed a death cross on May 24, which signaled that the following months would be bearish. However, with the recent markup in price, a golden cross could be in the making.
The main resistance for the SUI price remains the $1.00 mark. In the past, the asset has broken beyond but has not sustained above it. If the daily candle can close above the $1.00 mark, SUI may turn from bearish to fully bullish.
SUI also just completed an ascending triangle, a bullish continuation pattern. A breakout to the upside from this structure could add at least 47% to the current price of SUI, bringing g it to $1.48. If the buy momentum maintains, SUI could surge higher and reach $2.00.


On the flip side, if the price of SUI fails to maintain above the ascending triangle, it would signal market weakness, and the asset price could fall back into the triangle below the 200-day EMA. A further downside move could invalidate the current bullish thesis as the price seeks lower support around $0.75 and $0.64.
Futures Traders Are Betting On A $2 SUI
Technical indicators show a strong chance of a rally to $2 as the Relative Strength Index is currently at 65 and heading upwards. This means that buy momentum is strong, and hence, higher highs are likely to occur.
Coinglass data shows that traders have opened seven times more Longs than Shorts, suggesting that the market is currently bullish because traders anticipate that prices may surge higher.


Key prices to note include $0.982, $0.96, $0.90, and $0.883, where traders have opened most of the trades with the largest leverage sizes. If the price breaks below these levels, it could drop further, as $0.98 – $0.883 represents the daily buy wall.
Frequently Asked Questions (FAQs)
This rally is likely due to Grayscale’s announcement of launching the SUI Trust for accredited investors, which has boosted market confidence in the token’s potential.
SUI has broken above both the 50-day and 200-day exponential moving averages (EMAs), signaling a bullish trend. After forming an ascending triangle, a bullish continuation pattern, the price could see a breakout that could add at least 47% to Sui’s current price, bringing it closer to $1.48. Sustained buying momentum may help the token reach $2 if the trend continues.
Yes, futures traders are currently betting heavily on Sui’s price rising. Data from Coinglass shows that there are seven times more long positions than shorts, indicating strong bullish sentiment. This suggests that traders expect the price to continue its upward trajectory, potentially pushing Sui to the $2 mark.
Related Articles
Evans Karanja
Evans Karanja is a crypto analyst and journalist with a deep focus on blockchain technology, cryptocurrency, and the video gaming industry. His extensive experience includes collaborating with various startups to deliver insightful and high-quality analyses that resonate with their target audiences. As an avid crypto trader and investor, Evans is passionate about the transformative potential of blockchain across diverse sectors. Outside of his professional pursuits, he enjoys playing video games and exploring scenic waterfalls.
Disclaimer: The presented content may include the personal opinion of the author and is subject to market condition. Do your market research before investing in cryptocurrencies. The author or the publication does not hold any responsibility for your personal financial loss.
Source link
You may like


Solana L2 Sonic includes TikTok users in airdrop

5 Tokens Ready For A 20X After Solana ETF Approval


Solana beats Ethereum in a key metric 3 months in a row


SCENE’s 2024 Person of the Year: Iggy Azalea


BTC Risks Falling To $20K If This Happens


Most Layer 2 solutions are still struggling with scalability
Price analysis
Here’s why Stellar Price Could Go Parabolic Soon
Published
8 hours agoon
December 23, 2024By
admin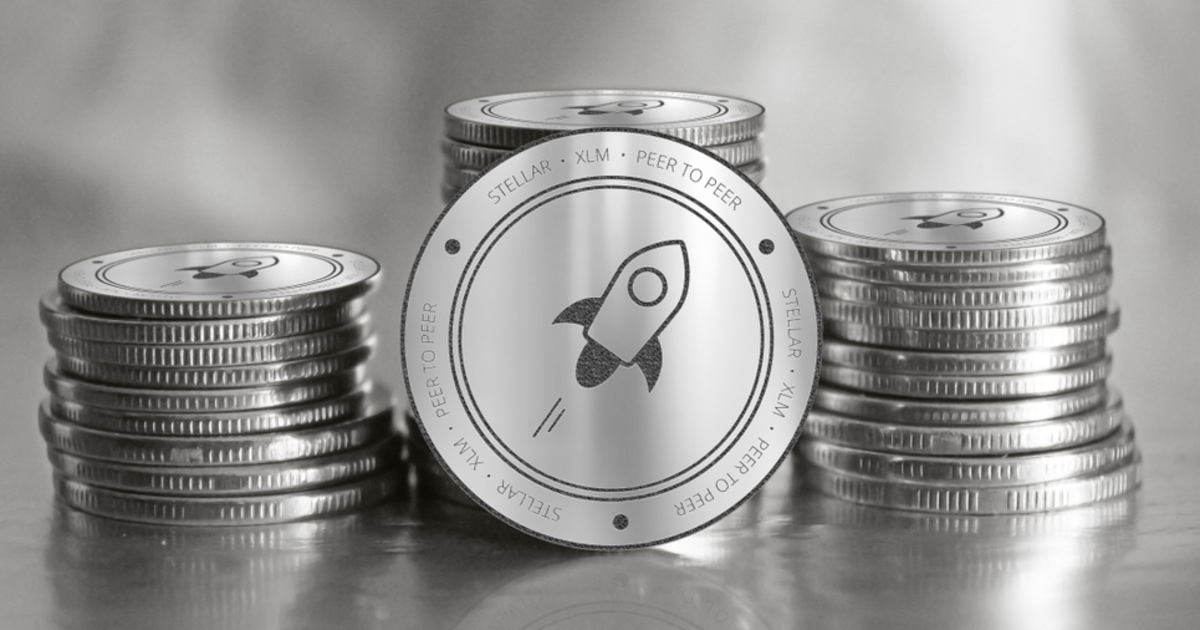
Stellar price plunged in the last three weeks due to a risk-off sentiment brought forth by Fed’s interest decision for 2025. The XLM price has formed a falling wedge pattern and found support at the 50-day moving average, indicating an eventual comeback as investors buy the dip.
Stellar Price Technical Analysis: Falling Wedge Forms
The Stellar Lumens coin fell sharply and formed a few lower lows and lower highs as Bitcoin and most altcoins crashed. This decline has seen it form a falling wedge chart pattern, which is made up of two falling trendlines. The upper trendline connects the highest level on December 2 and 17, while the lower lines link the lower lows since November 26.
A falling wedge is a highly popular reversal sign. In most cases, this reversal happens when the two lines are nearing their confluence levels, which is about to happen.
Another bullish case is that the XLM price has found support at the 50% Fibonacci Retracement level. This retracement links the lowest and highest levels in 2024.
Further, the Stellar price seems to have completed its mean reversion, which explains why it crashed in the past few days. Mean reversion is when a cryptocurrency or a stock return to its average price. In this case, it has found substantial support at the 50-day moving average, where it has failed to drop below in the past two consecutive days.
XLM price has also found support near the lower side of Andrew’s pitchfork tool. Therefore, the coin will likely have a strong bullish breakout in the coming days. If this happens, it may rally and retest the psychological point at $0.50, which coincides with the 23.6% retracement level.


Stellar Lumens price’s bullish view will become invalid if the coin slips below last week’s low at $0.3125. Such a drop will see it drop to the psychological level at $0.30.
XLM Price Has Bullish Fundamentals
Stellar Price has some bullish fundamentals that could push its price higher in the next few weeks. The first big thing is that Stellar and Ripple are often seen as ‘cousins’ since they target the payment industry. Also, Stellar’s founder, Jed McCaleb, is one of Ripple’s founder.


Therefore, Ripple’s performance could benefit the XLM price as it has previously done. As we wrote earlier, analysts are optimistic that the XRP price will skyrocket by 60% if the SEC approves a spot XRP fund. Another analyst expects the Ripple price to surge to $4 as Binance transactions rise.
Further, Stellar’s network is doing relatively well as the DeFi total value locked stages a slow recovery. DeFi Llama data shows that the Stellar Network had a TVL of over 135 million XLM, higher than last week’s low of 112 XLM.
Therefore, a combination of strong fundamentals and technicals may help the Stellar price rebound in the near term.
Frequently Asked Questions (FAQs)
Stellar lumens has retreated because of the ongoing crypto sell-off. Bitcoin and other cryptocurrencies like Ether and Solana have all plunged hard.
The XLM token may rebound to at least $0.50 because the falling wedge chart pattern works out well. Besides, it has already completed the mean reversion pattern.
Stellar price has strong fundamentals, including its similarity with Ripple and its growing ecosystem in the DeFi industry.
crispus
Crispus is a seasoned Financial Analyst at CoinGape with over 12 years of experience. He focuses on Bitcoin and other altcoins, covering the intersection of news and analysis. His insights have been featured on renowned platforms such as BanklessTimes, CoinJournal, HypeIndex, SeekingAlpha, Forbes, InvestingCube, Investing.com, and MoneyTransfers.com.
Disclaimer: The presented content may include the personal opinion of the author and is subject to market condition. Do your market research before investing in cryptocurrencies. The author or the publication does not hold any responsibility for your personal financial loss.
Source link
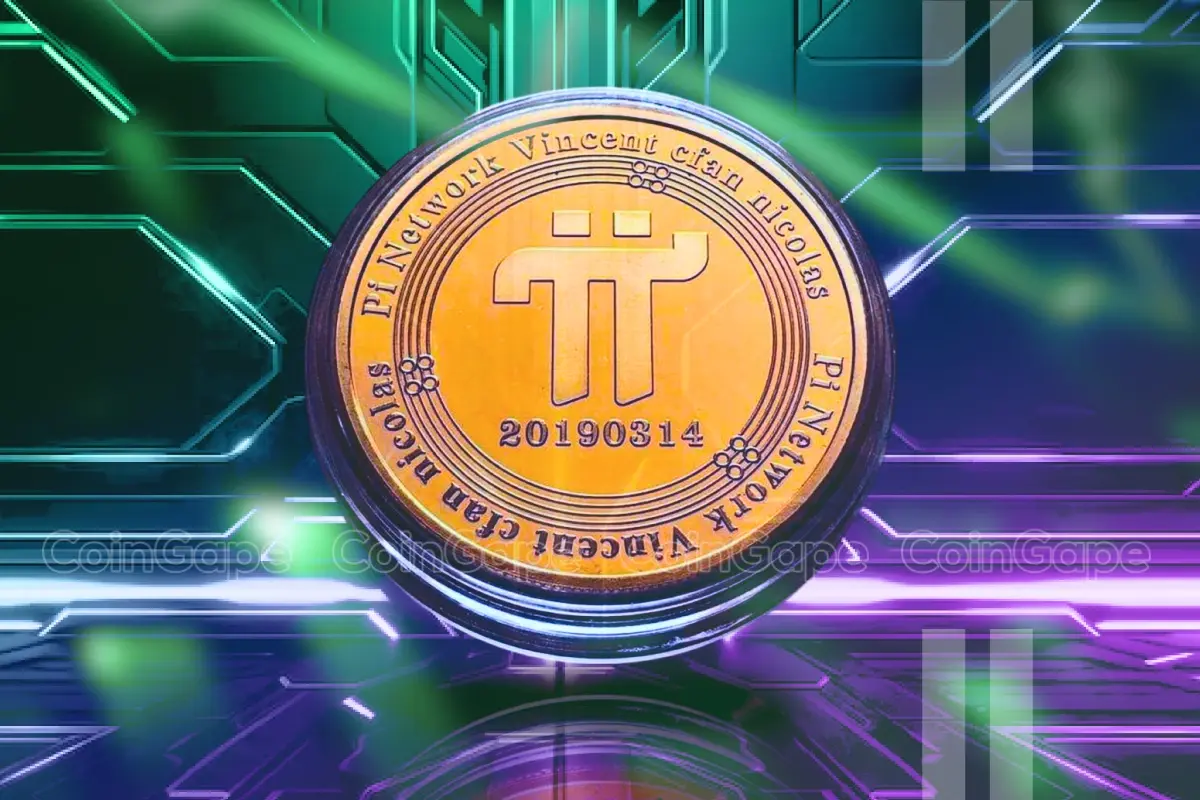
Pi Network price has seen a rally of 10% amid a market resurgence over the past 24-hours. The PI price could potentially 3x before the year 2024 concludes, supported by strengthening technical indicators and the market recovery. However, rising volatility remains a critical factor to monitor closely. The recent bullish rally highlights growing investor confidence, suggesting Pi Network might continue its upward momentum in the coming months.
Will Pi Network Price 3x By End of December?
The Pi Network price is currently hovering above $48, recording a notable surge within the past 24-hours, fueled by growing excitement around its forthcoming mainnet launch. This milestone transition, set for December 31, 2024, could potentially redefine the project’s trajectory and expand its utility.
Since its inception in 2019, Pi Network has attracted significant attention for its unique approach to cryptocurrency mining and community-driven growth. The shift from testnet to mainnet marks a pivotal development, enabling users to migrate their Pi coins to a fully operational blockchain.
With the mainnet’s launch, the ecosystem aims to unlock complete functionality, paving the way for real-world transactions and token trading. The move could solidify Pi Network’s place among notable blockchain projects.
The broader crypto market recovery, highlighted by Bitcoin hovering above $97,000, has added
to the bullish sentiment. As Pi Network prepares to unveil its open mainnet, market analysts speculate its price could triple, bolstering optimism among investors and users alike.
PI Price Gains Momentum, Eyes Key Resistance Levels
The PI price has experienced notable movement, reflecting growing market interest. As of the latest data, the token is trading at $47.43, marking a 4.52% increase on the day. Analysts are closely monitoring the token’s trajectory within its established ascending channel.
The chart highlights a critical resistance at the $67 level, which has historically acted as a turning area for the token. Breaking this level could propel the price further into bullish territory.
However, failure to sustain momentum might lead to a pullback toward the channel’s midline.
The histogram of MACD is seen to go upward insignificantly which is signal for a cautious optimism. Yet the RSI is neutral 47.89 implying that the tape could still trend higher or cast a pause.
The upper boundary of the ascending channel near $184 is being eyed as a potential long term target of market participants. Levels above this would mean a 254.80% rally from current prices. Support on the flipside comes in near $44, just above the channel’s lower boundary. This trend indicates strong market activity as traders weigh the token’s potential in the coming months.


Pi Network Price rally reflects huge investor confidence with upcoming significant milestones. Despite the challenges, its forthcoming mainnet launch could lead its price to multiply up to three times before 2024 ends.
Frequently Asked Questions (FAQs)
Analysts speculate it could, given bullish market sentiment.
Scheduled for December 31, 2024.
It transitions Pi to a fully operational blockchain for real transactions.
Coingape Staff
CoinGape comprises an experienced team of native content writers and editors working round the clock to cover news globally and present news as a fact rather than an opinion. CoinGape writers and reporters contributed to this article.
Disclaimer: The presented content may include the personal opinion of the author and is subject to market condition. Do your market research before investing in cryptocurrencies. The author or the publication does not hold any responsibility for your personal financial loss.
Source link

The crypto market shows signs of resurgence, offering investors lucrative opportunities. These four Altcoin to Hold stand out with potential for significant growth before 2025. Backed by promising fundamentals, they are strong contenders for a surge during the anticipated bull market.
Altcoins to Hold: XRP
XRP price has surged by 100% over the past month, reaching $2.24 during a strong market rally. Ripple’s legal battle with the U.S. Securities and Exchange Commission (SEC), which appears close to a favourable resolution, has significantly boosted investor confidence.
Market bulls are defending the $2.05–$2.20 support range, a key area attracting substantial buyer interest. Analysts suggest a break above $2.60 could lead to more upside momentum, with $3.00 as the next psychological target. XRP continues to shine as one of the top altcoins to hold before 2025.

DexBoss (DEBO)
DexBoss (DEBO), selling for $0.01 in its presale, is drawing attention from cryptocurrency enthusiasts. This memecoin stands out by combining humor with blockchain-based utility. Unlike typical short-lived memecoins, DexBoss offers a robust ecosystem featuring decentralized token swaps, staking opportunities, and exclusive NFT releases.
Its unique approach appeals to both speculative investors and long-term holders. DexBoss’s foundation of blockchain technology positions it as more than a fleeting trend. The coin’s diverse features make it an intriguing option for those seeking innovation and potential in the cryptocurrency market.
Sui (SUI)
Sui (SUI) price has risen to $4.59, marking a 2% surge and highlighting its growing market appeal. The Layer 1 blockchain platform is gaining recognition for delivering fast, private, and secure digital asset management making it altcoin to buy.
Known for its efficiency, Sui has seen a steady rise in Total Value Locked (TVL). Analysts view this momentum as a sign of investor confidence ahead of the anticipated 2025 altcoin season. With its innovative smart contract solutions, Sui continues positioning itself as a top contender among altcoins in the competitive blockchain ecosystem.


Dogecoin (DOGE)
Dogecoin (DOGE), a prominent meme-based cryptocurrency, recently recorded a significant price surge despite slight market corrections. The DOGE price has climbed 250% over the past year, trading at $0.332 at the time of writing. This remarkable growth underscores its rising popularity among investors and its appeal as a potential altcoin to hold before the anticipated 2025 alt season.
Notably, whale transactions involving Dogecoin have spiked, reflecting heightened activity among large holders. In late October, transactions exceeding $100,000 saw a sharp increase. This trend signals growing whale interest, which could further influence market dynamics and fuel continued momentum for DOGE’s price trajectory.


As crypto market dynamics shift, focusing on Altcoin to hold can yield substantial returns. These four assets offer growth potential, innovation, and community-driven resilience, making them a must-watch for 2025.
Frequently Asked Questions (FAQs)
XRP, DexBoss, Sui, and Dogecoin are top recommendations.
XRP shows bullish trends with potential legal clarity boosting confidence.
DexBoss offers utility through token swaps, staking, and NFTs.
Coingape Staff
CoinGape comprises an experienced team of native content writers and editors working round the clock to cover news globally and present news as a fact rather than an opinion. CoinGape writers and reporters contributed to this article.
Disclaimer: The presented content may include the personal opinion of the author and is subject to market condition. Do your market research before investing in cryptocurrencies. The author or the publication does not hold any responsibility for your personal financial loss.
Source link

Solana L2 Sonic includes TikTok users in airdrop

5 Tokens Ready For A 20X After Solana ETF Approval

Solana beats Ethereum in a key metric 3 months in a row

SCENE’s 2024 Person of the Year: Iggy Azalea

BTC Risks Falling To $20K If This Happens

Most Layer 2 solutions are still struggling with scalability

Here’s why Stellar Price Could Go Parabolic Soon

Perp-Focused HyperLiquid Experiences Record $60M in USDC Net Outflows

Experts say these 3 altcoins will rally 3,000% soon, and XRP isn’t one of them

Robert Kiyosaki Hints At Economic Depression Ahead, What It Means For BTC?

BNB Steadies Above Support: Will Bullish Momentum Return?

Metaplanet makes largest Bitcoin bet, acquires nearly 620 BTC

Tron’s Justin Sun Offloads 50% ETH Holdings, Ethereum Price Crash Imminent?

Investors bet on this $0.0013 token destined to leave Cardano and Shiba Inu behind

End of Altcoin Season? Glassnode Co-Founders Warn Alts in Danger of Lagging Behind After Last Week’s Correction
182267361726451435

Why Did Trump Change His Mind on Bitcoin?

Top Crypto News Headlines of The Week

New U.S. president must bring clarity to crypto regulation, analyst says

Will XRP Price Defend $0.5 Support If SEC Decides to Appeal?

Bitcoin Open-Source Development Takes The Stage In Nashville

Ethereum, Solana touch key levels as Bitcoin spikes

Bitcoin 20% Surge In 3 Weeks Teases Record-Breaking Potential

Ethereum Crash A Buying Opportunity? This Whale Thinks So

Shiba Inu Price Slips 4% as 3500% Burn Rate Surge Fails to Halt Correction

Washington financial watchdog warns of scam involving fake crypto ‘professors’

‘Hamster Kombat’ Airdrop Delayed as Pre-Market Trading for Telegram Game Expands

Citigroup Executive Steps Down To Explore Crypto
Mostbet Güvenilir Mi – Casino Bonus 2024

NoOnes Bitcoin Philosophy: Everyone Eats
Trending

 3 months ago
182267361726451435

 Donald Trump5 months ago
Why Did Trump Change His Mind on Bitcoin?

 24/7 Cryptocurrency News4 months ago
Top Crypto News Headlines of The Week

 News4 months ago
New U.S. president must bring clarity to crypto regulation, analyst says

 Price analysis4 months ago
Will XRP Price Defend $0.5 Support If SEC Decides to Appeal?

 Opinion5 months ago
Bitcoin Open-Source Development Takes The Stage In Nashville

 Bitcoin5 months ago
Ethereum, Solana touch key levels as Bitcoin spikes

 Bitcoin5 months ago
Bitcoin 20% Surge In 3 Weeks Teases Record-Breaking Potential


✓ Share: