DeFi
Crypto Hackers Stole Half as Much in August as They Did in July, Says Immunefi
Published
4 months agoon
By
admin

Good news: August saw a significant decrease in cryptocurrency losses due to hacks and fraud, according to a recent report from Immunefi. Total losses amounted to $15,082,000 across five incidents, marking the lowest monthly total year-to-date and a 94.5% decrease from July.
As Decrypt reported at the time, July saw cross-chain DeFi protocol Li.Fi losing about $11 million to a hack. Reports indicate that hackers stole more than twice as much cryptocurrency in the first half of 2024—based on the U.S. dollar value of the coins—compared to the first six months of 2023.
The two largest incidents this month involved the Ronin Network, a gaming-focused blockchain, which lost $12 million, and Nexera, a DeFi protocol, which incurred a loss of $1.5 million. Notably, the $12 million stolen from Ronin Network was later recovered after white hat hackers who discovered and exploited the vulnerability returned the funds.
Despite the lower losses in August, the year-to-date total for 2024 stands at $1,210,741,330 lost to hacks and rug pulls across 154 incidents, a 15.5% increase from the same period in 2023.
“Most of the losses in 2024 are attributed to attacks targeting CeFi infrastructure,” Gonçalo Magalhães, Head of Security at Immunefi told Decrypt. “We’ve known for a while that infrastructure compromises tend to be the most devastating hacks in the cryptocurrency world.”
All reported hacks in August occurred in the DeFi sector, with no CeFi losses recorded.
“In DeFi, most losses are due to vulnerabilities in smart contracts, whereas in CeFi, attacks typically target the exchange infrastructure and focus on exploiting private keys,” Magalhães said.
Ethereum and BNB Chain were the only chains targeted for hacks in August.
“Ethereum and BNB Chain are consistently the most targeted chains due to the high value of funds locked within them,” he added. “Bad actors specifically target these chains because the potential payoff from a successful exploit is greater.”
Edited by Stacy Elliott.
Daily Debrief Newsletter
Start every day with the top news stories right now, plus original features, a podcast, videos and more.
Source link
You may like


Solana beats Ethereum in a key metric 3 months in a row


SCENE’s 2024 Person of the Year: Iggy Azalea


BTC Risks Falling To $20K If This Happens


Most Layer 2 solutions are still struggling with scalability


Here’s why Stellar Price Could Go Parabolic Soon

Perp-Focused HyperLiquid Experiences Record $60M in USDC Net Outflows
DeFi
Solana beats Ethereum in a key metric 3 months in a row
Published
10 minutes agoon
December 23, 2024By
admin
Solana’s continued doing well in December, as meme coins helped it gain market share against Ethereum and other blockchains.
According to DeFi Llama, Solana’s (SOL) protocols in the decentralized exchange industry were the most active in December.
Its volume rose to over $97 billion, much higher than the $22.6 billion it handled in the same period last year.
Notably, it was the third consecutive month that Solana outperformed Ethereum (ETH), which has dominated the industry for years. Ethereum’s protocols had a volume of over $74 billion, while Base and Arbitrum handled $42 billion and $37 billion.

Solana also performed great in November, where its DEX networks had a volume of $129 billion, higher than Ethereum’s $70.6 billion. A month earlier, Solana handled volume of $52 billion, while Ethereum processed $41 billion.
Most of Solana’s DEX volume was because of Raydium (RAY), a network that handled coins worth $65 billion in the last 30 days. Orca handled $24 billion, while Lifinity, Pump, and Phoenix had volumes worth over $5.93 billion.
Solana’s DEX volume has jumped because of the meme coin industry, which has continued doing well this year. Solana has attracted thousands of meme coins this year, helped by the creation of Pump, the biggest token generator. All Solana meme coins have a market cap of over $14.1 billion, led by Bonk, Dogwifhat, Popcat, and Peanut the Squirrel.
This growth has been highly profitable for Solana and its native apps. All Solana native dApps generated a record $365 million in revenue in November, a record high. Similarly, according to TokenTerminal, Solana’s blockchain generated a record $725 million in fees in 2024, making it the third-most profitable chain after Ethereum and Tron.
Developers and users love Solana because of its substantially lower fees and higher throughput.
Base, the layer-2 network launched by Coinbase, has also been a big breakout star in 2024 as its total fees rose to over $82 million. It has become the biggest layer 2 network in the blockchain industry, with its DEX networks handling over $181 billion in assets, while its total value locked soared to $2 billion.
Source link
DeFi
DeFi Protocol Usual’s Surge Catapults Hashnote’s Tokenized Treasury Over BlackRock’s BUIDL
Published
21 hours agoon
December 22, 2024By
admin
There’s been a change of guard at the rankings of the $3.4 billion tokenized Treasuries market.
Asset manager Hashnote’s USYC token zoomed over $1.2 billion in market capitalization, growing five-fold in size over the past three months, rwa.xyz data shows. It has toppled the $450 million BUIDL, issued by asset management behemoth BlackRock and tokenization firm Securitize, which was the largest product by size since April.

USYC is the token representation of the Hashnote International Short Duration Yield Fund, which, according to the company’s website, invests in reverse repo agreements on U.S. government-backed securities and Treasury bills held in custody at the Bank of New York Mellon.
Hashnote’s quick growth underscores the importance of interconnecting tokenized products with decentralized finance (DeFi) applications and presenting their tokens available as building blocks for other products — or composability, in crypto lingo — to scale and reach broader adoption. It also showcases crypto investors’ appetite for yield-generating stablecoins, which are increasingly backed by tokenized products.
USYC, for example, has greatly benefited from the rapid ascent of the budding decentralized finance (DeFi) protocol Usual and its real-world asset-backed, yield-generating stablecoin, USD0.
Usual is pursuing the market share of centralized stablecoins like Tether’s USDT and Circle’s USDC by redistributing a portion of revenues from its stablecoin’s backing assets to holders. USD0 is primarily backed by USYC currently, but the protocol aims to add more RWAs to reserves in the future. It has recently announced the addition of Ethena’s USDtb stablecoin, which is built on top of BUIDL.
“The bull market triggered a massive inflow into stablecoins, yet the core issue with the largest stablecoins remains: they lack rewards for end users and do not give access to the yield they generate,” said David Shuttleworth, partner at Anagram. “Moreover, users do not get access to the protocol’s equity by holding USDT or USDC.”
“Usual’s appeal is that it redistributes the yield along with ownership in the protocol back to users,” he added.

The protocol, and hence its USD0 stablecoin, has raked in $1.3 billion over the past few months as crypto investors chased on-chain yield opportunities. Another significant catalyst of growth was the protocol’s governance token (USUAL) airdrop and exchange listing on Wednesday. USUAL started trading on Binance on Wednesday, and vastly outperformed the shaky broader crypto market, appreciating some 50% since then, per CoinGecko data.
BlackRock’s BUIDL also enjoyed rapid growth earlier this year, driven by DeFi platform Ondo Finance making the token the key reserve asset of its own yield-earning product, the Ondo Short-Term US Government Treasuries (OUSG) token.
Source link
Aave
AAVE Dominates DeFi Lending – Metrics Reveal 45% Market Share
Published
1 week agoon
December 15, 2024By
admin
Aave (AAVE), the leading decentralized finance (DeFi) lending protocol, has captured the spotlight with an extraordinary surge of over 200% since November 5. Outperforming the broader market, AAVE has reached its highest levels since 2021, marking a remarkable recovery and reaffirming its dominance in the DeFi ecosystem.
Related Reading
Key metrics from IntoTheBlock underscore AAVE’s unmatched position in the lending sector. With an impressive 45% market share, it remains the top choice for users seeking decentralized borrowing and lending solutions.
With AAVE trading at multi-year highs and on-chain data suggesting robust activity, the altcoin’s trajectory remains a focal point for investors and analysts alike. The question is whether the price can sustain this momentum and reach new all-time highs in the coming months.
AAVE Keeps Growing
Aave (AAVE) has shown consistent growth over the past year, solidifying its position as a market leader in the DeFi lending sector. Known for its innovative approach to creating non-custodial liquidity markets, Aave enables users to earn interest on supplied and borrowed assets at variable interest rates. This approach has made Aave a go-to protocol for decentralized borrowing and lending.
For years, Aave has been at the forefront of DeFi innovation, continually enhancing its platform and user experience. Its success is evident in its market dominance. Metrics from IntoTheBlock highlight Aave’s unrivaled leadership, boasting an impressive 45% market share in the DeFi lending space.
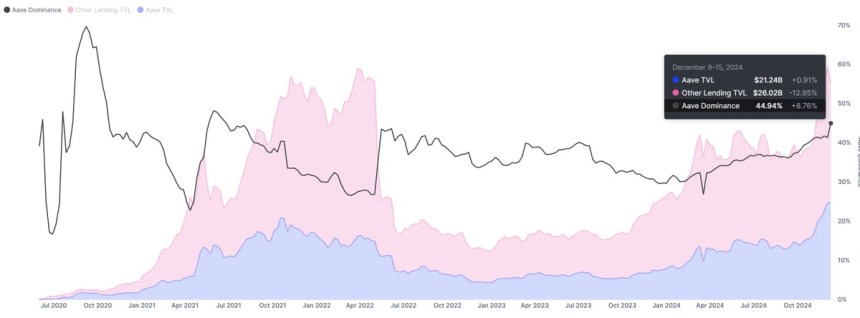
This dominance is further emphasized by Aave’s staggering total value locked (TVL), which stands at $21.2 billion—almost equal to the combined TVL of all other lending protocols.
Related Reading
Such figures underline Aave’s critical role in the DeFi ecosystem. Its established presence and robust infrastructure position it as a key player in the event of a broader DeFi resurgence. Should the sector heat up in the coming weeks, Aave is likely to attract significant attention from investors and traders.
Price Targets Fresh Supply Levels
Aave (AAVE) is currently trading at $366, following a surge to a multi-year high of $396 just hours ago. The altcoin continues its upward momentum as it approaches the critical $420 resistance level, a threshold last held in September 2021. This mark is seen as a pivotal area for AAVE’s next phase of price action, with many analysts expecting a significant reaction once tested.
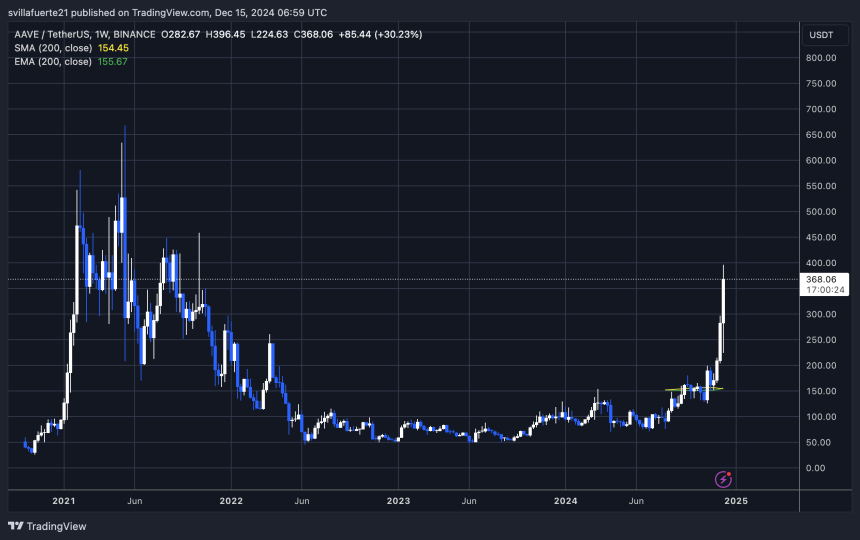
If AAVE manages to hold its current levels and sustain the bullish momentum, the next logical target would be the $420 resistance zone. Breaking above this level could signal a continuation of its multi-month rally, setting the stage for even higher price targets as investor confidence builds.
On the downside, failure to maintain support above the $320–$340 range could lead to a broader correction. A move below this zone might push the price lower, erasing some of its recent gains and dampening bullish sentiment in the short term.
Related Reading
AAVE remains in a strong position for now, but traders are closely monitoring its price action near these key levels. Whether it can sustain its upward trajectory or faces a pullback will depend on its ability to break and hold above significant resistance zones.
Featured image from Dall-E, chart from TradingView
Source link

Solana beats Ethereum in a key metric 3 months in a row

SCENE’s 2024 Person of the Year: Iggy Azalea

BTC Risks Falling To $20K If This Happens

Most Layer 2 solutions are still struggling with scalability

Here’s why Stellar Price Could Go Parabolic Soon

Perp-Focused HyperLiquid Experiences Record $60M in USDC Net Outflows

Experts say these 3 altcoins will rally 3,000% soon, and XRP isn’t one of them

Robert Kiyosaki Hints At Economic Depression Ahead, What It Means For BTC?

BNB Steadies Above Support: Will Bullish Momentum Return?

Metaplanet makes largest Bitcoin bet, acquires nearly 620 BTC

Tron’s Justin Sun Offloads 50% ETH Holdings, Ethereum Price Crash Imminent?

Investors bet on this $0.0013 token destined to leave Cardano and Shiba Inu behind

End of Altcoin Season? Glassnode Co-Founders Warn Alts in Danger of Lagging Behind After Last Week’s Correction

Can Pi Network Price Triple Before 2024 Ends?

XRP’s $5, $10 goals are trending, but this altcoin with 7,400% potential takes the spotlight
182267361726451435

Why Did Trump Change His Mind on Bitcoin?

Top Crypto News Headlines of The Week

New U.S. president must bring clarity to crypto regulation, analyst says

Will XRP Price Defend $0.5 Support If SEC Decides to Appeal?

Bitcoin Open-Source Development Takes The Stage In Nashville

Ethereum, Solana touch key levels as Bitcoin spikes

Bitcoin 20% Surge In 3 Weeks Teases Record-Breaking Potential

Ethereum Crash A Buying Opportunity? This Whale Thinks So

Shiba Inu Price Slips 4% as 3500% Burn Rate Surge Fails to Halt Correction

Washington financial watchdog warns of scam involving fake crypto ‘professors’

‘Hamster Kombat’ Airdrop Delayed as Pre-Market Trading for Telegram Game Expands

Citigroup Executive Steps Down To Explore Crypto
Mostbet Güvenilir Mi – Casino Bonus 2024

NoOnes Bitcoin Philosophy: Everyone Eats
Trending

 3 months ago
182267361726451435

 Donald Trump5 months ago
Why Did Trump Change His Mind on Bitcoin?

 24/7 Cryptocurrency News4 months ago
Top Crypto News Headlines of The Week

 News4 months ago
New U.S. president must bring clarity to crypto regulation, analyst says

 Price analysis4 months ago
Will XRP Price Defend $0.5 Support If SEC Decides to Appeal?

 Opinion5 months ago
Bitcoin Open-Source Development Takes The Stage In Nashville

 Bitcoin5 months ago
Ethereum, Solana touch key levels as Bitcoin spikes

 Bitcoin5 months ago
Bitcoin 20% Surge In 3 Weeks Teases Record-Breaking Potential


