
Altcoin
Dogecoin Hits Weekly Support Trendline, Analyst Signals Cycle Bottom Is In

Recent price decline action has seen Dogecoin rebounding at a recent multi-month low after the entire market started last week on a liquidation stretch. However, technical analysis from analyst Trader Tardigrade suggests that Dogecoin may have already established its cycle bottom before the next price surge.
Dogecoin Tests Key Weekly Support After 40% Drop
The cryptocurrency market faced a significant downturn last week, with widespread losses hitting various digital assets. Dogecoin was no exception to the sell-off, experiencing a sharp decline of nearly 40% before finding support around $0.22. This drop marked the lowest price Dogecoin has reached since the beginning of 2025, and the last time it traded at this level was in early November 2024.
Related Reading
Despite the severity of the drop, technical analysis from crypto analyst Trader Tardigrade suggests that Dogecoin’s recent 2025 low may be more significant than it appears at first glance. In a social media post on platform X, the analyst shared a weekly timeframe chart highlighting that $0.22 is part of a key trendline that played a crucial role in Dogecoin’s price movements throughout 2024.
Now, with the price falling back to this level and bouncing off it, Trader Tardigrade noted that the trendline has seemingly flipped into a strong support zone.
As of now, Dogecoin has rebounded to $0.2561, reflecting a positive reaction of approximately 16% from its recent low. Notably, on-chain data from IntoTheBlock shows buyers stepped in just around this support level. However, Dogecoin’s ability to hold above this support level in the coming weeks will determine if the cryptocurrency has truly reached a bottom for the rest of this cycle.
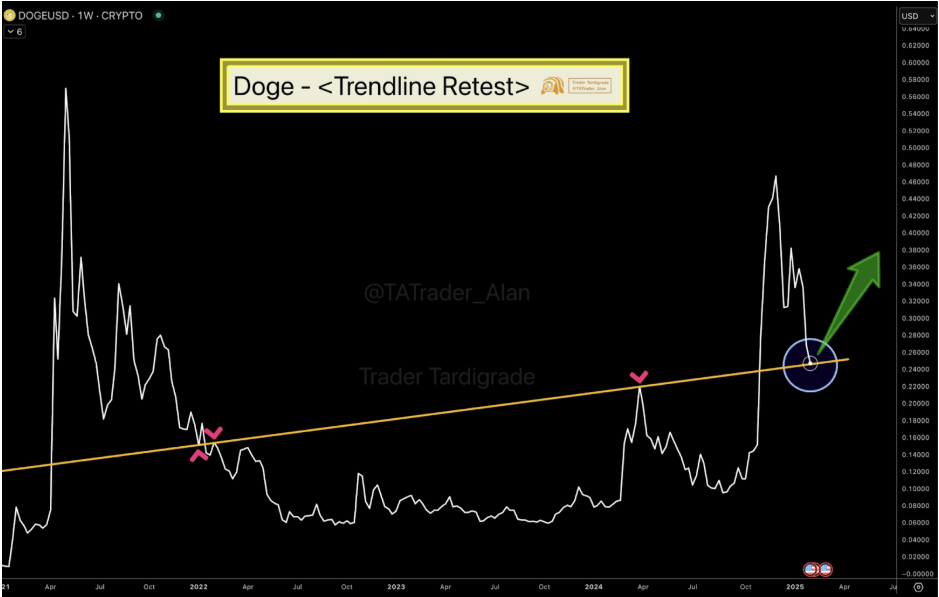
Image From X: Trader Tardigrade
Historical Pullbacks Point To $2 Price Target
In another analysis, Trader Tardigrade highlighted a recurring pattern in which the Dogecoin price tends to experience significant pullbacks of more than 50% after a strong multi-month rally. However, these pullbacks have always been accompanied by another strong rebound rally, and Dogecoin eventually reached a new peak.
His analysis noted three major pullbacks: the first saw a decline of 59.76%, the second dropped by 56.2%, and the most recent pullback registered a 58.25% drop. Based on this historical behavior, Tardigrade noted that the recent correction might be accompanied by another strong rebound.
The last such a rebound happened, Dogecoin went on a 23,000% increase to reach its current all-time high of $0.73. From here, Trader Tardigrade predicted a similar playout to reach a price target of $2.
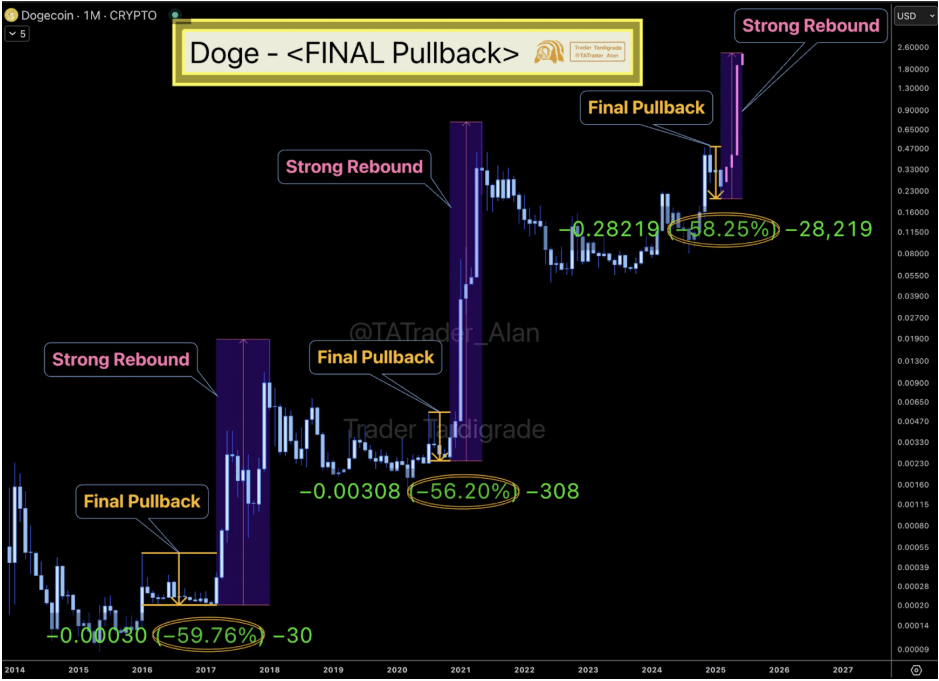
Image From X: Trader Tardigrade
Related Reading
The $2 price target has been a recurring prediction among crypto analysts for Dogecoin. One similar prediction came from crypto analyst Dima Potts, who predicted that Dogecoin is poised to target all-time highs between $1.50 and $2.10. For now, the first step for a bullish Dogecoin would be to break above $0.3.
Featured image from Mudrex, chart from TradingView
Source link


3M Bollinger Bands
Ethereum Price Hits 300-Week MA For The Second Time Ever, Here’s What Happened In 2022
Reason to trust
![]()
Strict editorial policy that focuses on accuracy, relevance, and impartiality
Created by industry experts and meticulously reviewed
The highest standards in reporting and publishing
Strict editorial policy that focuses on accuracy, relevance, and impartiality
Morbi pretium leo et nisl aliquam mollis. Quisque arcu lorem, ultricies quis pellentesque nec, ullamcorper eu odio.
Ethereum has once again fallen below the $2,000 mark, a psychological level it had briefly reclaimed earlier this week. The market-wide correction over the past 24 hours has weighed on Ethereum’s recovery momentum, and the leading altcoin has seen a dip in sentiment that could lead to a deeper decline or a sharp mid-term rebound.
Short-term sentiment is cautious, but a new analysis from a well-followed crypto analyst has brought attention to a significant technical event that opens up a bullish perspective for the Ethereum price.
Ethereum Hits 300-Week Moving Average Again: What Happened The Last Time?
Taking to social media platform X, crypto analyst CryptoBullet pointed out that Ethereum has now touched the 300-week moving average for only the second time in its history. The first instance was in June 2022, during the market-wide crash that saw the Ethereum price plummet to as low as $880 before beginning a long, slow recovery.
Related Reading
The second occurrence has come this month, March 2025, just as Ethereum continues to extend its struggles in gaining a footing above $2,000. With Ethereum touching the 300-week moving average again, we can only look back to see what happened last time to get a perspective of what to expect now.
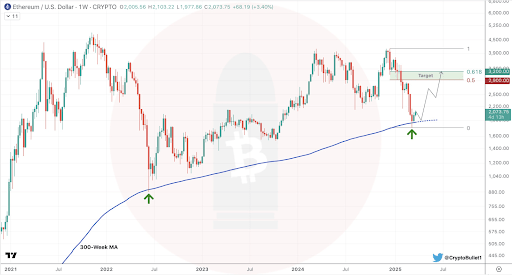
In June 2022, Ethereum’s touch of the 300-week moving average marked the beginning of a long-term recovery phase. After the bounce from that level, the Ethereum price surged more than 140% over the next eight weeks, eventually pushing above $2,100 in August 2022 before another correction.
Mid-Term Rebound In Focus For ETH, But Resistance Ahead
CryptoBullet noted the significance of this moving average, framing it as a key historical support zone. The analyst argued that regardless of bearish sentiment in the short term, this kind of macro-level support typically sets the stage for a meaningful bounce.
Related Reading
“Even if you’re a bear, you can’t deny that we hit a very important support level,” he wrote, adding that his price target for the coming bounce is between $2,900 and $3,200. Nonetheless, the bounce will depend on how the Ethereum price reacts to the level, as a continued downside move would cancel out any bullish momentum.
For now, Ethereum’s price is trapped under bearish sentiment, and bulls will need to reclaim the $2,000 zone before any sustainable bounce toward the $2,900 and $3,200 range can begin to materialize. Furthermore, the recent price correction in the past 24 hours increases the risks of the Ethereum price closing March below the 3M Bollinger bands, which is currently just around $2,000. A close below the 3M Bollinger bands could spell trouble for the leading altcoin.
However, if CryptoBullet’s analysis proves to be accurate, Ethereum may soon enter a period of stronger price action that plays out over the coming weeks. At the time of writing, Ethereum is trading at $1,907, down by 5.82% in the past 24 hours.
Featured image from Unsplash, chart from Tradingview.com
Source link

Dogecoin rallied nearly 10% this week, resilient in the face of the U.S. President Donald Trump’s tariff war and macroeconomic developments. Most altcoins have suffered the negative impact of Trump’s announcements, DOGE continues to gain, back above $0.2058 for the first time in nearly two weeks.
Dogecoin rallies in double-digits, what to expect from DOGE price?
Dogecoin (DOGE) hit a near two-week peak at $0.20585 on Wednesday, March 26. In the past seven days, DOGE rallied nearly 10%, even as altcoins struggled with recovery in the ongoing macroeconomic developments in the U.S.
The largest meme coin in the crypto market could continue its climb, extending gains by nearly 11%, and testing resistance at the lower boundary of the imbalance zone between $0.24040 and $0.21465.
The upper boundary of the zone at $0.24040 is the next key resistance for DOGE, nearly 24% above the current price.
Two key momentum indicators, the RSI and MACD support a bullish thesis for Dogecoin. RSI is 52, above the neutral level. MACD flashes green histogram bars above the neutral line, meaning there is an underlying positive momentum in Dogecoin price trend.

Dogecoin on-chain analysis
On-chain analysis of the largest meme coin shows that the number of holders of DOGE is on the rise. If Dogecoin’s number of holders keep climbing or steady in the coming week, the meme coin could remain relevant among traders.
The network realized profit/loss metric shows that DOGE holders have realized profits on a small scale. Typically, large scale profit-taking increases selling pressure on the meme coin and could negatively impact price.
The metric supports a bullish thesis for DOGE in the coming week. Dogecoin’s active address count has been steady since mid-March, another sign of the meme coin’s resilience.

DOGE derivatives analysis and price forecast
The analysis of Dogecoin derivatives positions across exchanges shows that open interest is recovering from its March 12 low. Open Interest is $1.98 billion, as Dogecoin trades at $0.19. Coinglass data shows a steady climb in OI in the chart below.

The total liquidations data shows $4.29 million in long positions were liquidated on March 27. Sidelined buyers need to watch liquidations data and prices closely before adding to their derivatives position.
The long/short ratio on top exchanges, Binance and OKX exceeds 1, meaning derivatives traders are betting on an increase in DOGE price.

When technical analysis and derivatives data is combined, it is likely Dogecoin price could test resistance at $0.21465 next week, if spot prices follow the cue of derivatives traders.
What to expect from DOGE
Dogecoin wallets holding between 1 million and 10 million DOGE tokens added to their portfolio consistently between March 10 and 27, while the other two categories, holding between 10 million and 100 million DOGE and 100 million and 1 billion DOGE tokens held nearly steady in the same timeframe.
The data from Santiment shows that DOGE’s traders holding between 1 million and 10 million tokens are rapidly accumulating, even as the token’s price rises. This supports demand for DOGE and a bullish thesis for the meme coin.

Dogecoin ETF and DOGE catalysts
DOGE holders are closely watching developments in Bitwise’s Dogecoin ETF filing with the SEC. The ETF filing is an effort to legitimize the meme coin as an investment category for institutional investors, as DOGE price holds steady among altcoins rapidly eroding in value.
Bitcoin flashcrashes dragged Dogecoin down with it, to a small extent, however the meme token recovered each time and consistent gains could signal an end to DOGE’s multi-month downward trend.
Other key catalysts for Dogecoin are positive updates in crypto regulation, passage of the stablecoin bill in the Congress, and demand for DOGE among whales and large wallet investors.
Disclosure: This article does not represent investment advice. The content and materials featured on this page are for educational purposes only.
Source link

Reason to trust
![]()
Strict editorial policy that focuses on accuracy, relevance, and impartiality
Created by industry experts and meticulously reviewed
The highest standards in reporting and publishing
Strict editorial policy that focuses on accuracy, relevance, and impartiality
Morbi pretium leo et nisl aliquam mollis. Quisque arcu lorem, ultricies quis pellentesque nec, ullamcorper eu odio.
XRP remains stuck around the $2 level, with experts issuing warnings of restricted near-term growth prospects. According to recent analysis, the digital currency is going through a phase of uncommon stability that has investors speculating about its next step.
Related Reading
Investor Sentiment Dampens Market Momentum
According to financial commentator Austin Hilton, millions of crypto traders have withdrawn from active participation. The market is stuck in neutral, as traders are simply waiting for a big event to set things into motion. The volumes of trade have been above $4 billion at peak levels, but the price itself remains virtually unchanged.
Summer Slowdown Impacts Crypto Trading
Analysts cite seasonal patterns as the major reason for XRP’s current behavior. Hilton describes how summer months usually experience lower trading volumes, with investors more inclined to engage in private activities than respond to market activity. This pattern might continue until July, possibly maintaining XRP’s price relatively stable.
A realistic XRP price prediction!
– Lets talk about the resistance levels for $XRP
– Also, discussed are the support levels that you need to know about
– What you need to know about your XRP holdings – so that you can navigate what is going on right now pic.twitter.com/h9kxG3a0Ex— Austin Hilton (@austinahilton) March 23, 2025
Price Barriers Create Market Challenges
Technical analysis indicates key price levels for XRP. Resistance levels are found at $2.61 and $2.81, while support levels are at $2.22 and $2.31. Experts caution that in the absence of heavy buy pressure, the cryptocurrency might not be able to overcome these levels. Currently, XRP is trading at $2.44, with a modest 0.04% gain over the last 24 hours.
XRP market cap currently at $141 billion. Chart: TradingView.com
Long-Term Outlook Remains Hopeful
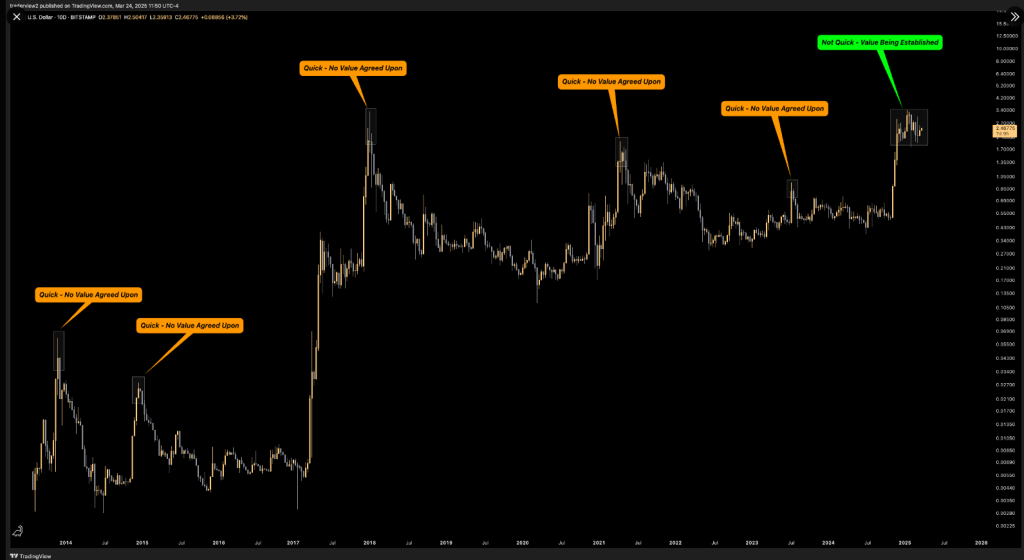
Despite current market challenges, some experts remain optimistic. Market analyst Dom suggests the current price consolidation might indicate a strong foundation for future growth. Unlike previous market cycles where XRP experienced rapid price spikes and drops, the current stability suggests a more measured approach.
There’s one reason I will be pretty surprised if $XRP does not go higher this year, read along –
Every time $XRP has historically put in a multi month or year top, it did it quickly (as shown below)
Essentially, it never showed any mid term acceptance at those higher… pic.twitter.com/RahjM2xHwz
— Dom (@traderview2) March 24, 2025
A number of possible catalysts are on the horizon, such as developments in XRP ETF products, continued action in the SEC vs. Ripple case, and possible reserve disclosures. As of yet, however, none of these events have caused major market activity.
Related Reading
Institutional investors remain quietly accumulating digital assets, creating yet another level of sophistication to the current market dynamics. Hilton advises not to anticipate extreme price increases in the near term, highlighting that there needs to be a major positive event for drastic change.
As the cryptocurrency market keeps growing, XRP investors are warned to keep close watch on the market conditions. The fourth quarter could see things pick up once again, but for the meantime, patience seems to be the main approach for those who possess the cryptocurrency.
Featured image from Gemini Imagen, chart from TradingView
Source link
Bitcoin Plunges Below $84K as Crypto Sell-Off Wipes Out Weekly Gains

Top 4 Crypto to Buy Now as XRP Price Struggles above $2
Ethereum Price Hits 300-Week MA For The Second Time Ever, Here’s What Happened In 2022

US regulators FDIC and CFTC ease crypto restrictions for banks, derivatives

US Authorities Seize $201,400 Worth of USDT Held in Crypto Wallets Allegedly Intended to Support Hamas

Is Bitcoin’s Bull Market Truly Back?

Stablecoin Bills Unfairly Box Out Foreign Issuers Like Tether, Says House Majority Whip

THORChain price prediction | Is THORChain a good investment?

Strategy (MSTR) Holders Might be at Risk From Michael Saylor’s Financial Wizardry

3 Altcoins to Sell Before March 31 to Prepare for Crypto Bull Market

A Big Idea Whose Time Has Finally Come

XRP price may drop another 40% as Trump tariffs spook risk traders

Trader Says Ethereum-Based Altcoin Primed for 240%+ Rally if Major Resistance Level Breaks, Updates XRP Outlook

Congressman Ro Khanna Says Democrats Are Changing Their Tune On Bitcoin

France’s Public Investment Bank Bpifrance to Invest $27 Million in Crypto


 24/7 Cryptocurrency News5 months ago
Arthur Hayes, Murad’s Prediction For Meme Coins, AI & DeFi Coins For 2025

 Bitcoin2 months ago
Expert Sees Bitcoin Dipping To $50K While Bullish Signs Persist

 24/7 Cryptocurrency News3 months ago
Aptos Leverages Chainlink To Enhance Scalability and Data Access

 Bitcoin5 months ago
Bitcoin Could Rally to $80,000 on the Eve of US Elections

 Altcoins2 months ago
Sonic Now ‘Golden Standard’ of Layer-2s After Scaling Transactions to 16,000+ per Second, Says Andre Cronje

 Bitcoin4 months ago
Institutional Investors Go All In on Crypto as 57% Plan to Boost Allocations as Bull Run Heats Up, Sygnum Survey Reveals

 Opinion5 months ago
Crypto’s Big Trump Gamble Is Risky

 Price analysis5 months ago
Ripple-SEC Case Ends, But These 3 Rivals Could Jump 500x
