
doge
Dogecoin May Face An ‘Ugly’ Drop Before The Weekend: Analyst

In a freshly shared four-hour chart of the DOGE/USDT trading pair on Binance, crypto analyst Carlos Garcia Tapia warns of potential downside for Dogecoin as weekend trading approaches. “If bears break this pattern, it’ll get ugly… especially since the weekend is coming,” Tapia warns.
Dogecoin Price Crash Incoming?
His chart posted via X depicts an ascending wedge formation running into a confluence of resistance between $0.338 and $0.343, as well as a notable support zone in the $0.31 region.
The chart highlights higher lows (marked as “LL” on the chart) forming the lower boundary of an ascending wedge. Meanwhile, overhead resistance (a rectangular zone around $0.338–$0.343) has repeatedly capped upward price movements. This wedge appears to be compressing price action—often a setup for a significant breakout or breakdown.
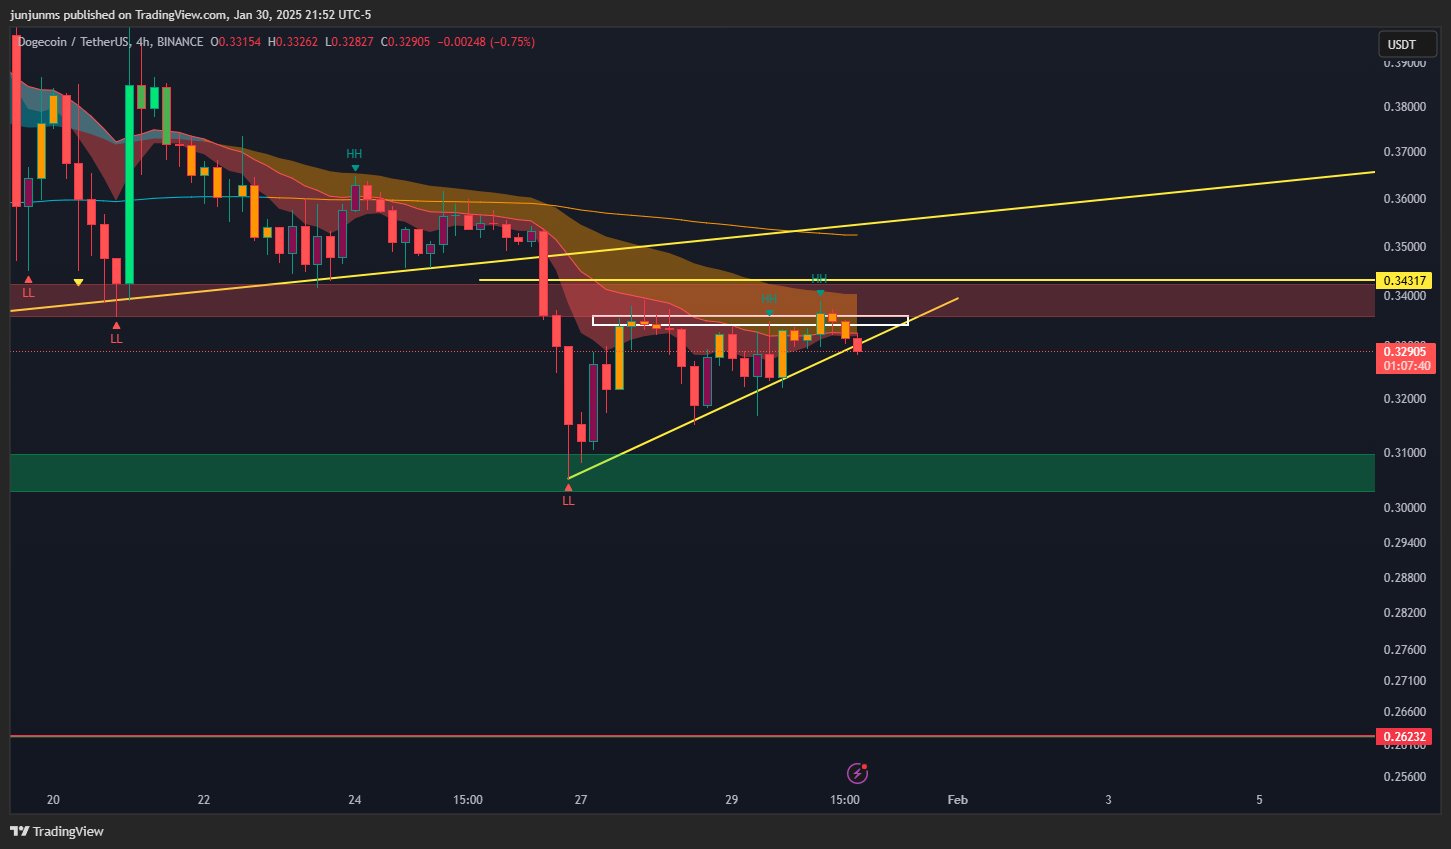
A horizontal resistance zone around $0.34 stands out. DOGE’s price has attempted multiple short-term moves above this level but failed to secure a confirmed breakout, suggesting sellers are firmly defending that zone.
Related Reading
On the downside, a green box spanning roughly $0.310 marks an area where buying interest has historically picked up. Below that level, the chart references a lower support marker near $0.262, indicating a more substantial potential drop if the wedge pattern breaks down decisively.
The analyst specifically points to the upcoming weekend as a wildcard. Historically, lower trading volumes on Saturdays and Sundays can exacerbate volatility. If Dogecoin fails to hold its rising trend line—currently near $0.328–$0.330—and liquidity thins out, the price could swiftly test the lower support around $0.310, or potentially slide toward the $0.262 zone if the selling momentum accelerates.
Related Reading
While a breakout above $0.343 could invalidate this bearish setup, Tapia’s cautionary note underscores the significance of a potential breakdown from the wedge formation. Weekend price action often diverges from midweek patterns due to reduced participation, meaning a sharp move in either direction could unfold more quickly than usual.
DOGE Needs To Hold $0.31
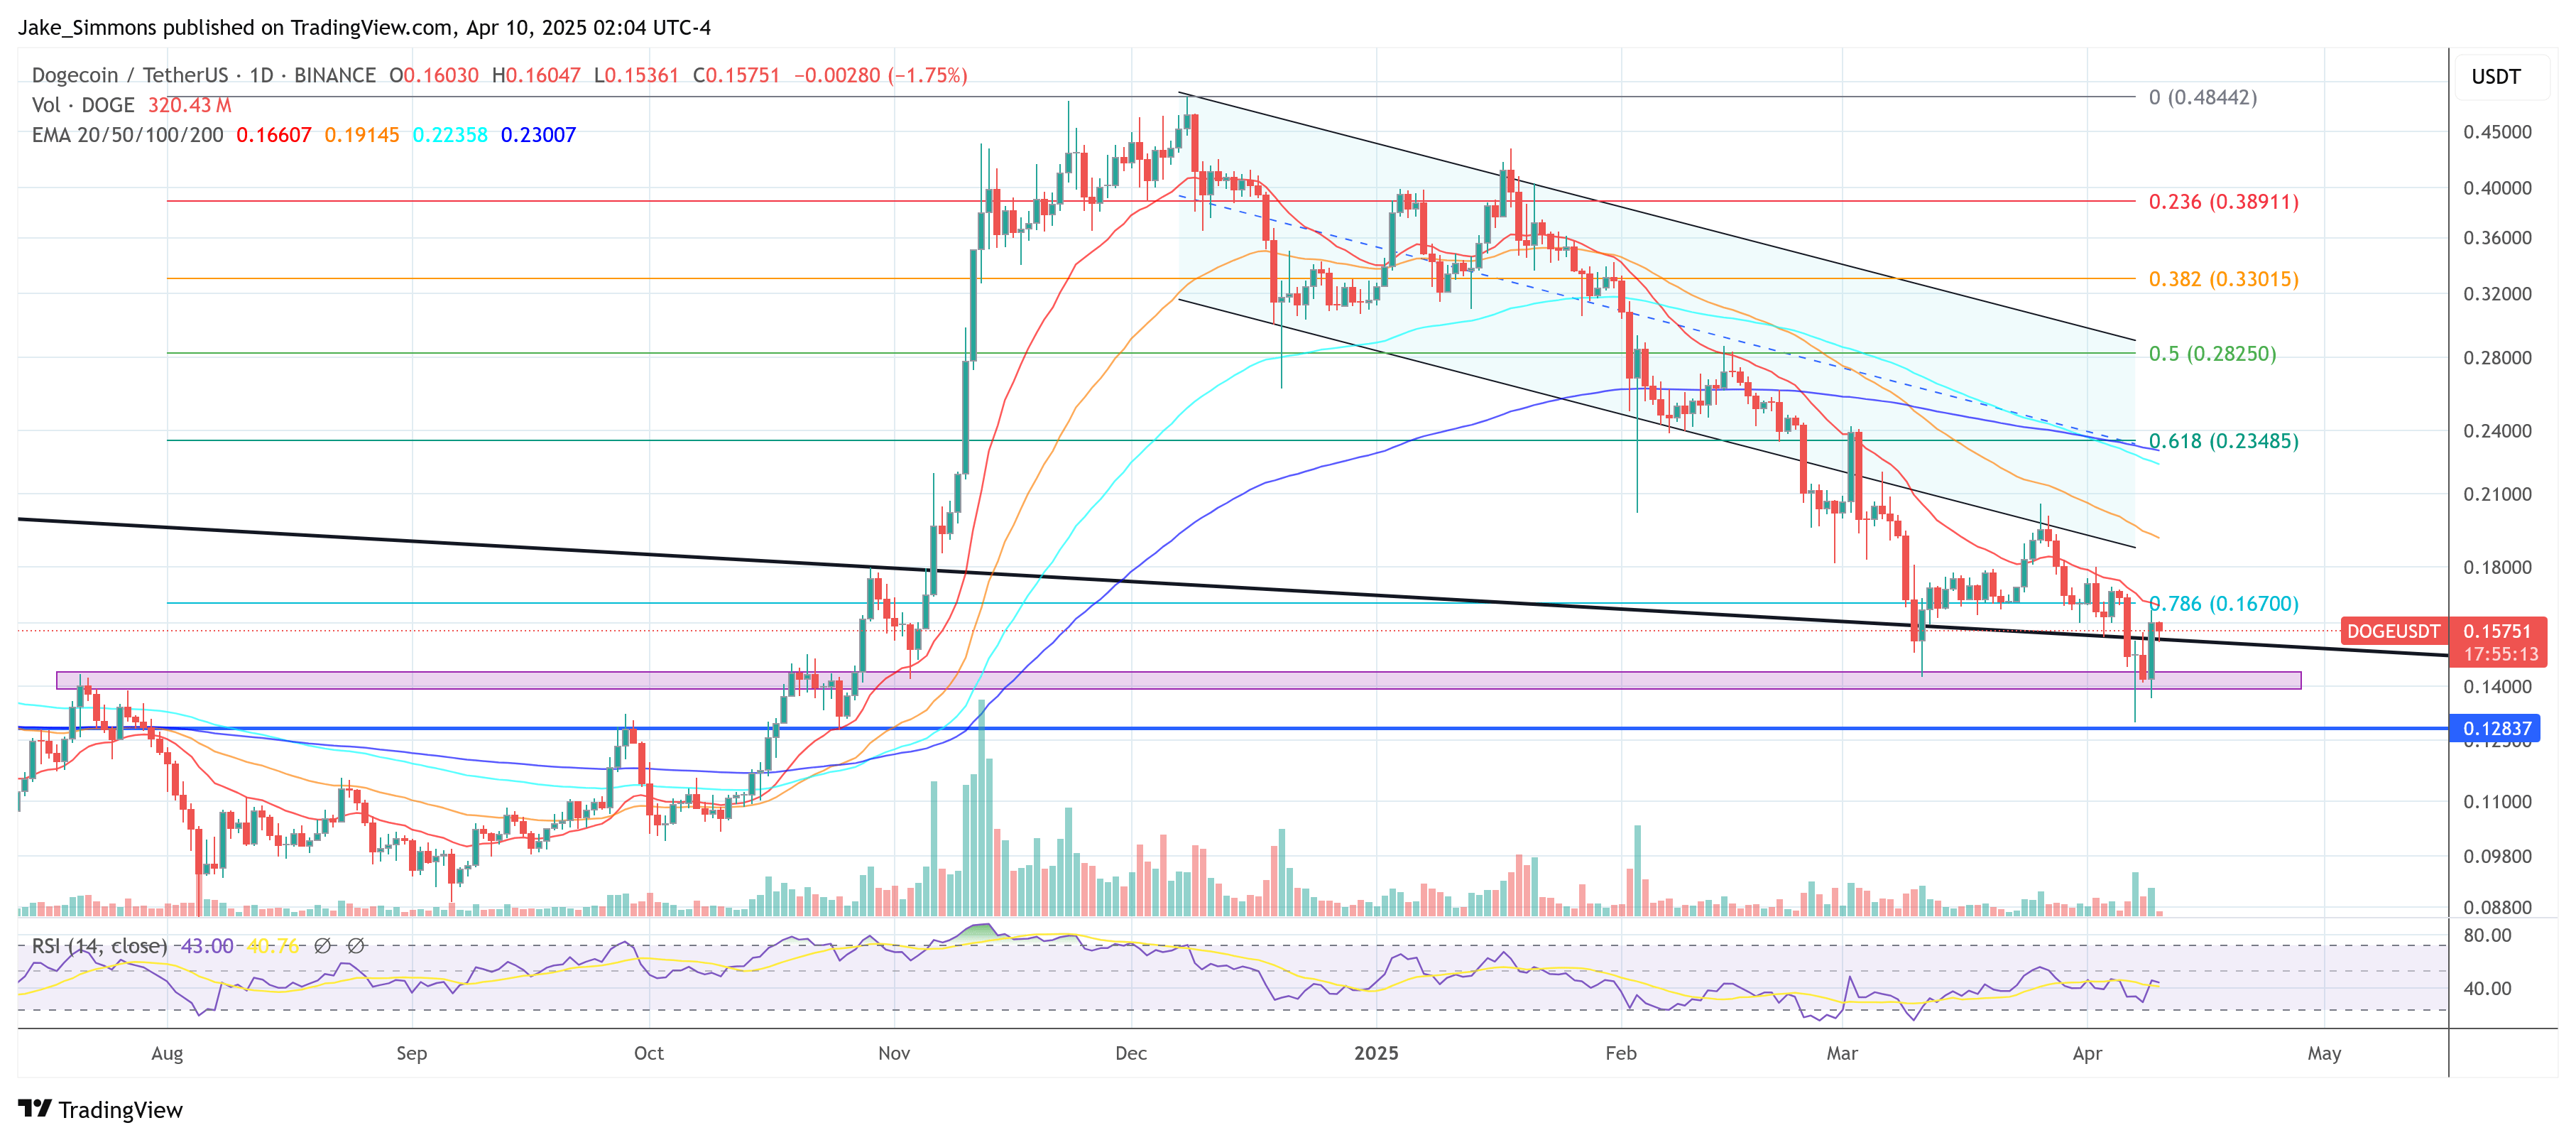
The daily chart supports Tapia’s thesis. There, Dogecoin (DOGE) finds itself under intensifying downward pressure as price action hugs a persistent downtrend line. After hitting a local high in December, DOGE has retreated below key exponential moving averages (EMAs). The 20-day EMA (currently at approximately $0.3457) and the 50-day EMA (near $0.3473) have both curved lower, signaling waning short-term momentum.
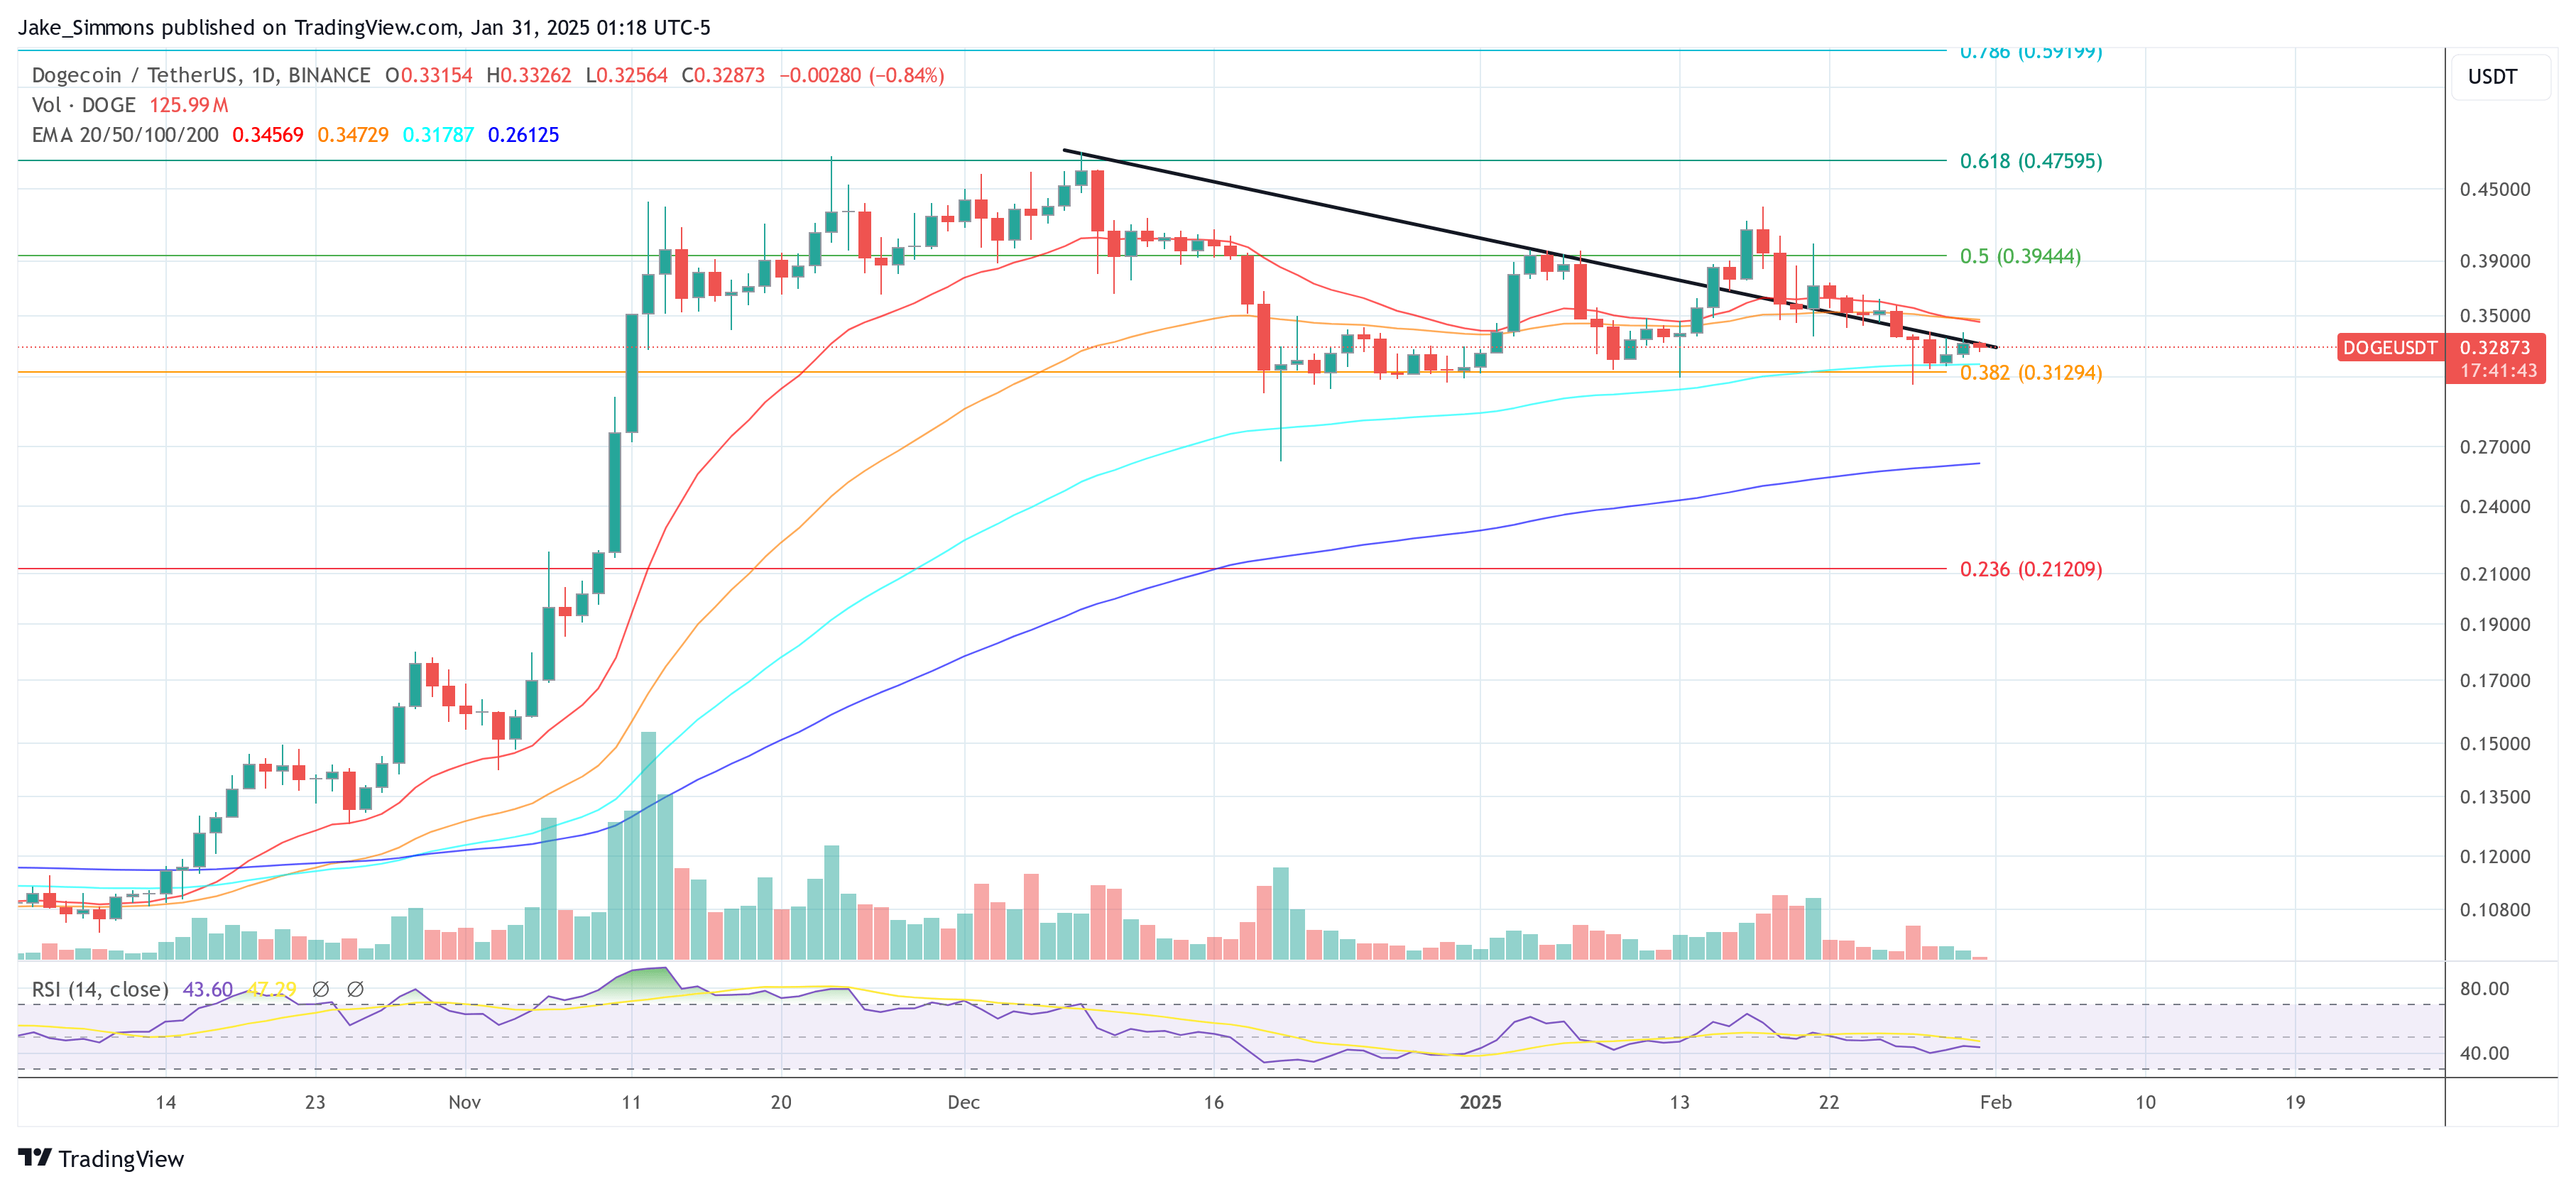
A glance at the chart reveals that DOGE is now just slightly above the 0.382 Fibonacci retracement level, calculated around $0.313. This Fib zone has acted as the most crucial support since mid-December, but any decisive daily close beneath it could accelerate selling. Traders are keeping a close eye on the 100-day EMA (around $0.3179), which is sandwiched just above this Fib level.
If the price fails to defend the area between $0.313 and $0.317, then eyes will turn to the 200-day EMA at roughly $0.2613 as a critical long-term support. If this level breaks to the downside as well, the 0.236 Fib at $0.212 could quickly become a reality.
Featured image created with DALL.E, chart from TradingView.com
Source link


Reason to trust
![]()
Strict editorial policy that focuses on accuracy, relevance, and impartiality
Created by industry experts and meticulously reviewed
The highest standards in reporting and publishing
Strict editorial policy that focuses on accuracy, relevance, and impartiality
Morbi pretium leo et nisl aliquam mollis. Quisque arcu lorem, ultricies quis pellentesque nec, ullamcorper eu odio.
Dogecoin’s momentum has shifted dramatically following macroeconomic developments and a series of strong technical signals, according to crypto chartist Kevin (@Kev_Capital_TA). Yesterday, the broader crypto market surged after President Donald Trump announced a 90-day pause on tariffs for 75 countries, while raising China’s tariffs to 125%.
Bullish Momentum For Dogecoin
The news sent Bitcoin above the $80,000 threshold and catapulted several major altcoins, including Dogecoin, higher. “Daily Bullish divergence on Dogecoin starting to play here,” Kevin writes in his latest update, while cautioning that “obviously macro news has most to do with this, but nonetheless the charts were giving us hints ahead of time that the opportunity was not guaranteed but there.”
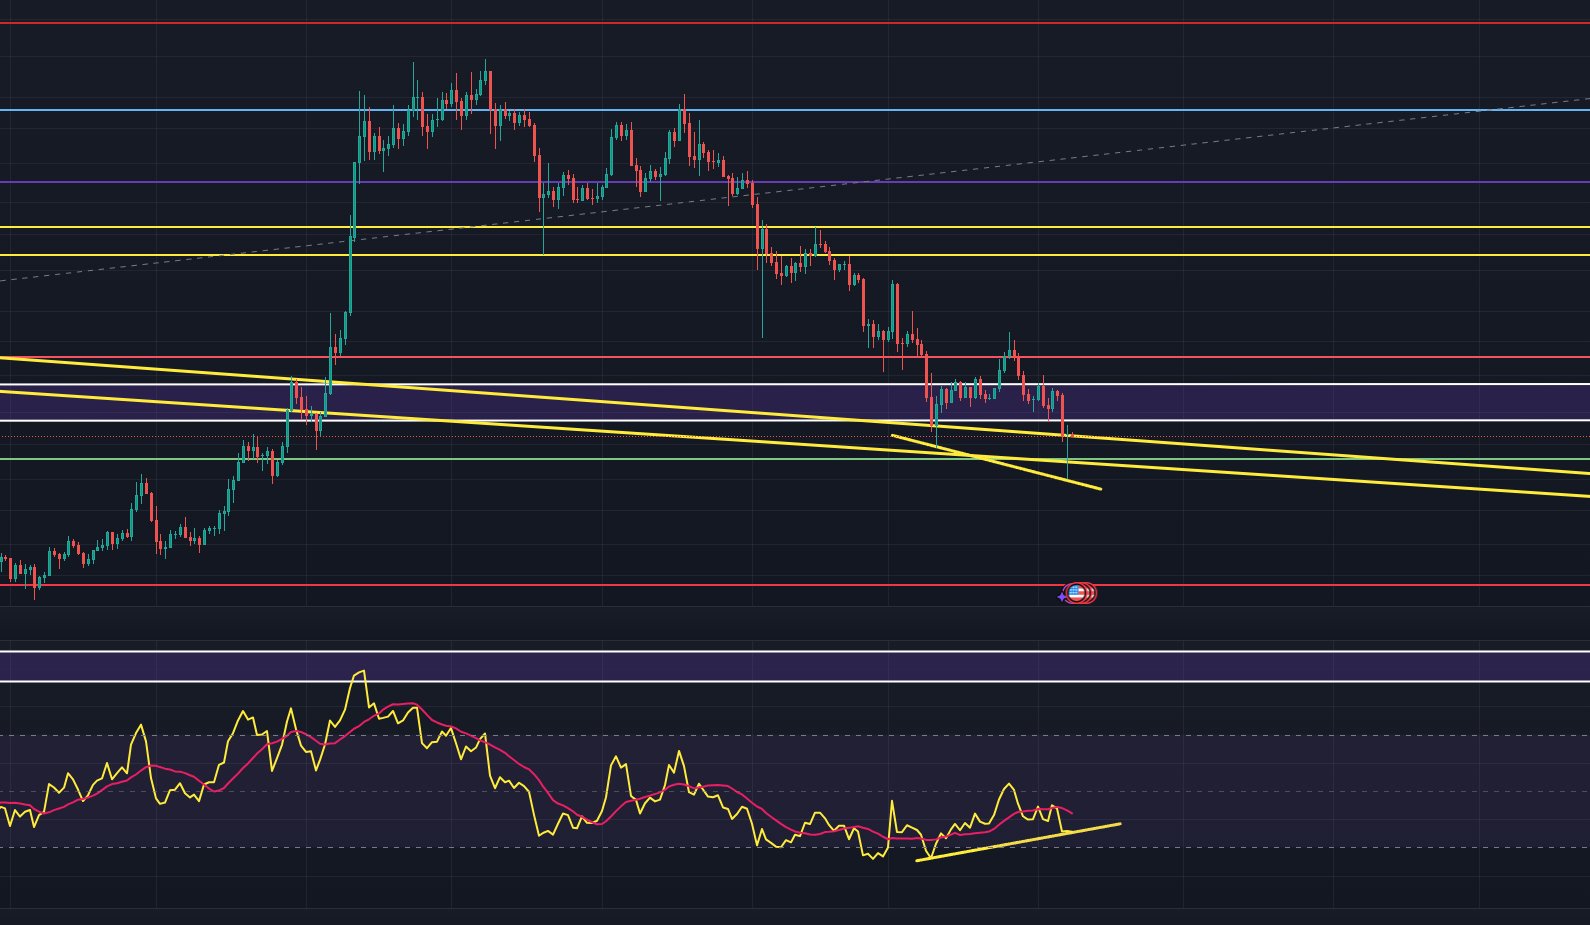
In the hours following the tariff announcement, Dogecoin rallied by approximately 13%, strengthening signs of a bullish divergence Kevin first flagged two days earlier. “Dogecoin came down once again to test the bull market structure ‘lines in the sand’ and somehow even though it cleanly broke through earlier in the day was able to recover and close the daily candle slightly above this support level,” he explained.
Related Reading
Kevin noted the parallel between Dogecoin’s bullish divergence and that of Bitcoin on the daily time frame, suggesting that renewed optimism for DOGE may be tied, in part, to the leading cryptocurrency’s resilience above its own pivotal support.
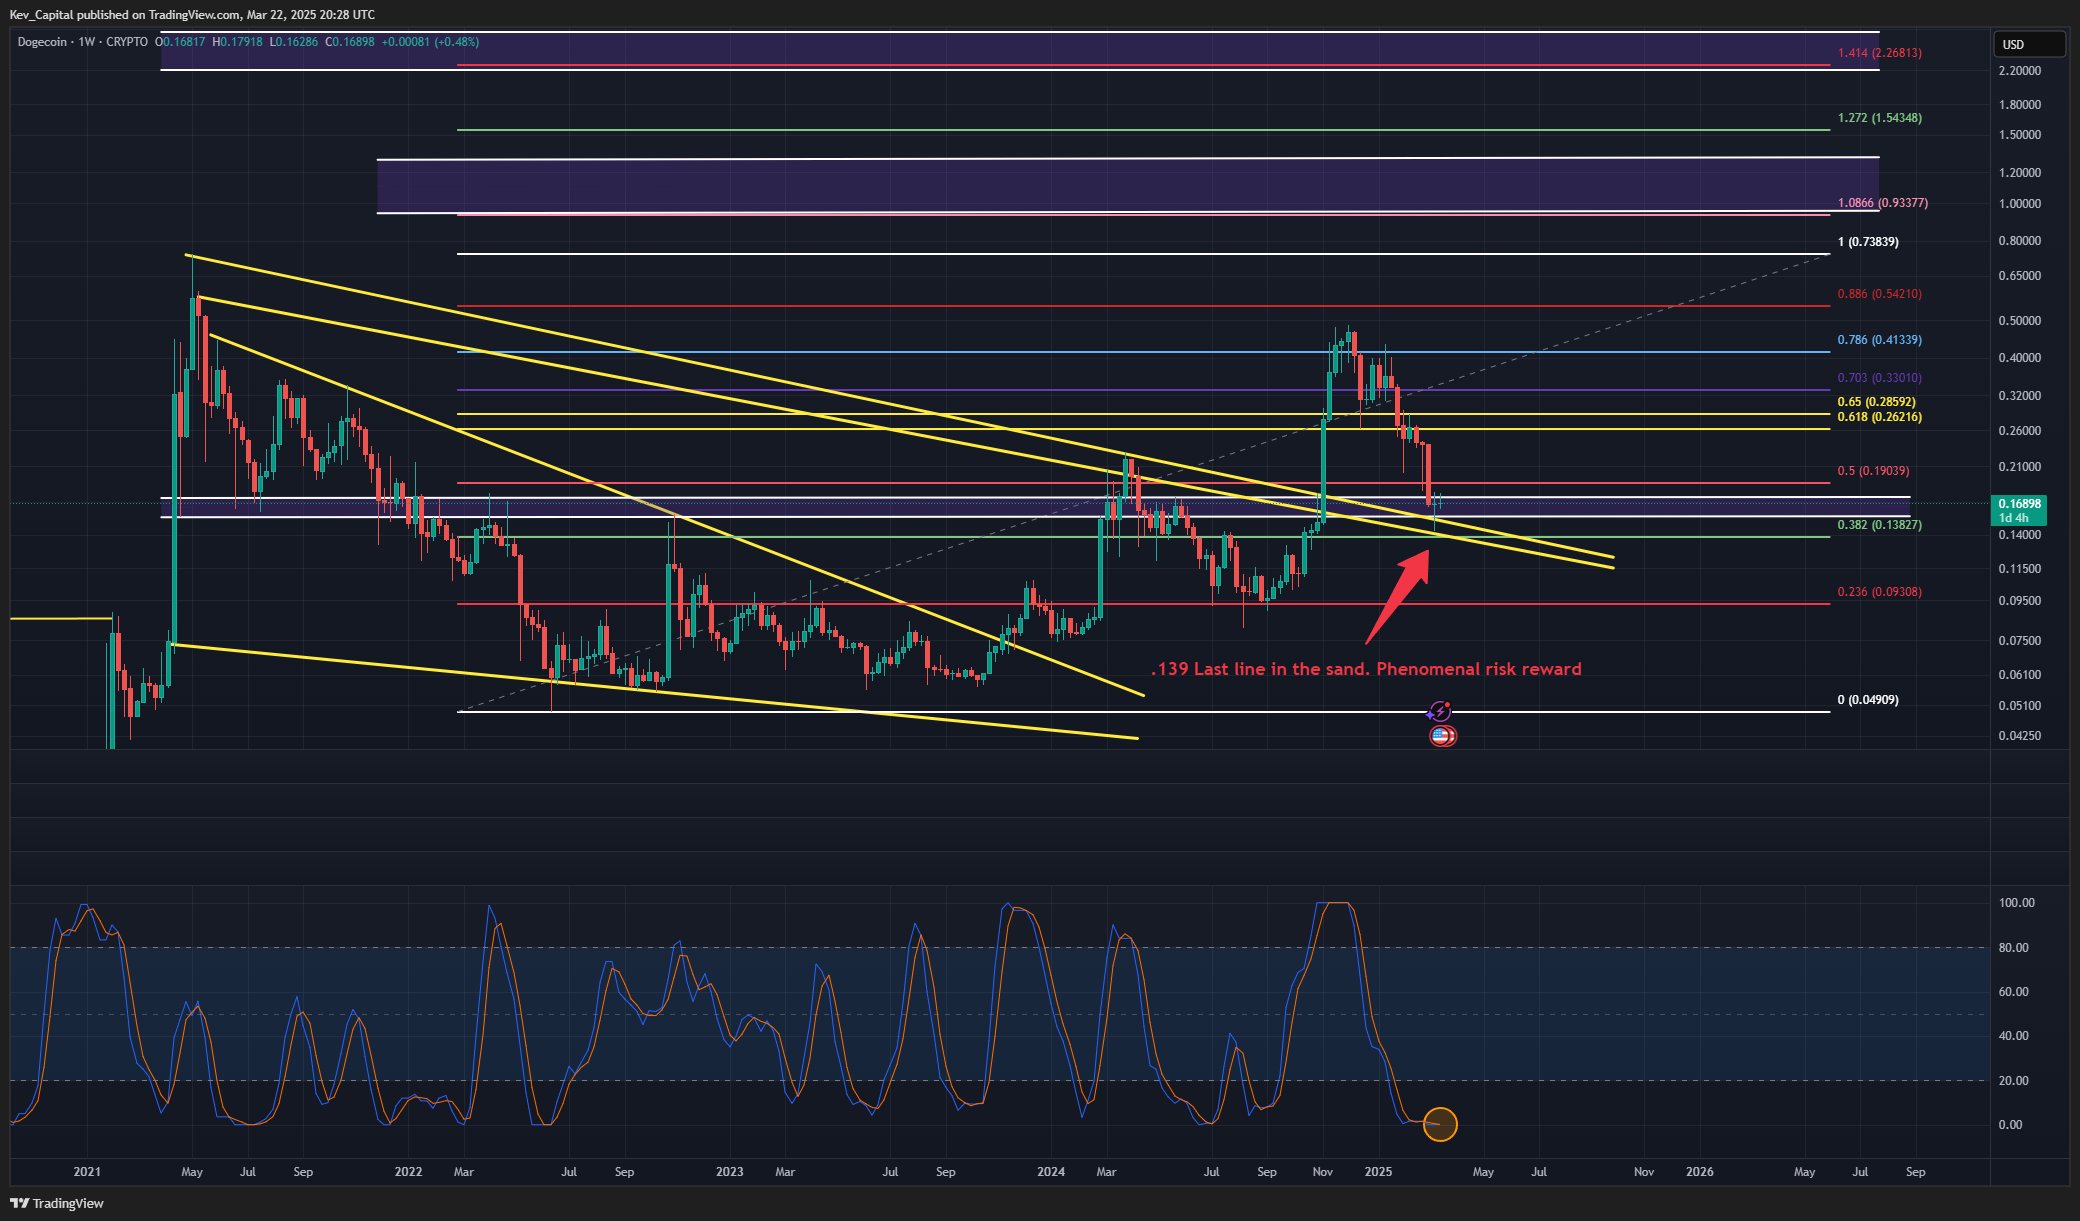
Kevin’s outlook is rooted in a multi-week assessment of Dogecoin’s technical posture. At the end of March, he pointed to a “weekly demand candle” and the ‘Last line of bull market support.” He emphasized how crucial it remains for Dogecoin to hold above the 0.139 mark. “It will continue to be absolutely vital that Dogecoin hold this level while it resets higher time frame indicators like the 3 Day MACD, Weekly Stoch RSI and 2W Stoch RSI all of which are getting very close to being fully reset,” he said.
DOGE Price Targets
He also described the potential upside for Dogecoin as “phenomenal” relative to the risk of losing that $0.139 threshold for multiple weekly closes. The chart’s Fibonacci retracement and extension levels suggest potential technical targets for Dogecoin that remain relevant for traders seeking directional cues.
Related Reading
These levels begin with the 0.236 at $0.09038, the 0.382 at $0.13827, the 0.5 at $0.19039, the 0.618 at $0.26216, the 0.65 at $0.28529, and the 0.70 at $0.3310. Higher up, the 0.786 reads $0.41339, the 0.88 is $0.54210, the 1.0 level marks $0.73839, and the 1.0866 is $0.93377.
Further on the extension side, the 1.272 stands at $1.54348, and the 1.414 appears at $2.26813. The analyst underscored that “as long as BTC holds these levels and does not lose $70K then I absolutely love this spot on DOGE,” highlighting how the broader market’s trajectory could shape Dogecoin’s path along these technical markers.
However, the coming days will reveal whether Dogecoin can build on the momentum that emerged amid the tariff-related market surge—and whether the well-worn phrase “the trend is your friend” will keep Dogecoin enthusiasts in a bullish mindset.
At press time, DOGE traded at $0.15751.
Featured image created with DALL.E, chart from TradingView.com
Source link
Reason to trust
![]()
Strict editorial policy that focuses on accuracy, relevance, and impartiality
Created by industry experts and meticulously reviewed
The highest standards in reporting and publishing
Strict editorial policy that focuses on accuracy, relevance, and impartiality
Morbi pretium leo et nisl aliquam mollis. Quisque arcu lorem, ultricies quis pellentesque nec, ullamcorper eu odio.
Dogecoin is now trading at critical levels after enduring several days of sustained selling pressure and failing to break above the $0.18 mark. The popular meme coin is currently down 65% from its multi-year high around $0.48, and sentiment around DOGE remains underwhelming. As price action continues to weaken, investors are growing cautious, and bulls are struggling to regain control.
Related Reading
The broader financial landscape is not helping. Macroeconomic uncertainty, rising geopolitical tensions, and sweeping trade tariffs are shaking global markets, pushing risk-on assets like cryptocurrencies deeper into correction territory. In this environment, volatility and instability are becoming the norm — particularly for highly speculative assets such as meme coins. Dogecoin, known for its price-driven hype cycles, could be especially vulnerable if market conditions continue to deteriorate.
Crypto analyst Ali Martinez shared a technical analysis on X, revealing that Dogecoin is currently testing a key support level. According to Martinez, this level will likely determine the coin’s next big move — either triggering a rebound or opening the door to deeper losses. With sentiment still fragile and volatility high, DOGE’s next steps will be closely watched as it teeters on the edge of further downside.
Dogecoin Trades At Make-Or-Break Level As Bears Dominate
Dogecoin is trading at a critical demand zone after enduring weeks of aggressive selling pressure that has dragged the price below key resistance levels. Among all crypto sectors, meme coins have taken the hardest hit during the recent market correction, and DOGE is no exception. The asset continues to follow a strong bearish trend, and unless bulls can defend the current support, the downtrend could accelerate.
At present, Dogecoin is hovering just above the $0.17 level — a key threshold that may decide whether the coin rebounds or continues to slide. Martinez’s insights highlight the significance of this zone. According to Martinez, Dogecoin is now at a “make-or-break” level, and how it behaves here will shape its short-term and possibly long-term trajectory.
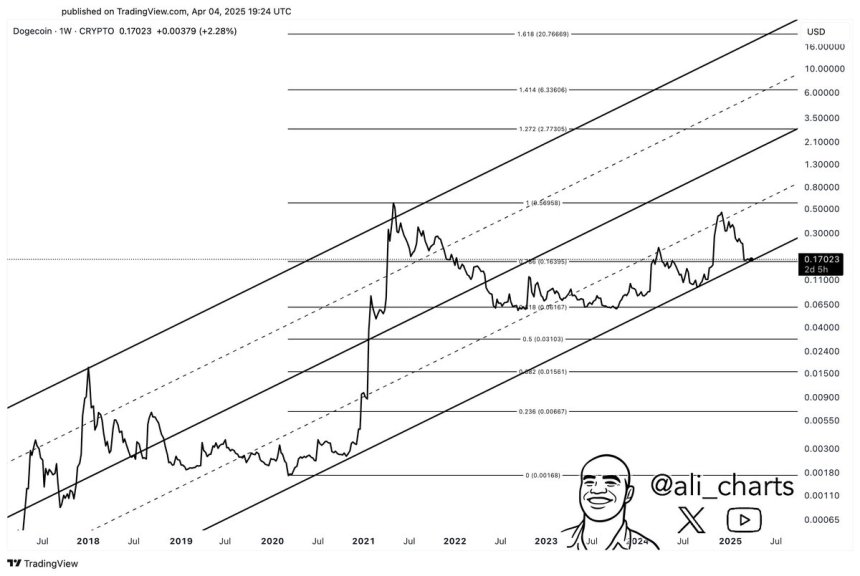
Martinez pointed out that DOGE has been trading within a long-standing bullish channel, and the $0.17 level sits at the lower boundary of this structure. A decisive hold at this level could act as a launchpad for a significant rally, especially if broader market sentiment improves. Conversely, if DOGE loses this support, the bullish structure would break down — opening the door to deeper losses.
Related Reading
With meme coins underperforming and macro uncertainty still in play, all eyes are on DOGE’s next move. If bulls fail to defend the $0.17 mark, Dogecoin could face another leg lower. However, if this crucial support holds, a powerful rebound may follow, offering a rare window of opportunity for patient investors.
DOGE Trades Below Key Averages As Bulls Defend $0.16 Support
Dogecoin is currently trading at $0.169 after several days of struggling to regain momentum below the 4-hour 200 MA and EMA, both hovering near the $0.18 level. The recent rejection from this technical zone has kept DOGE under pressure, with price action showing signs of continued weakness. Bulls are now in a tight spot, needing to defend current levels to avoid a deeper correction.
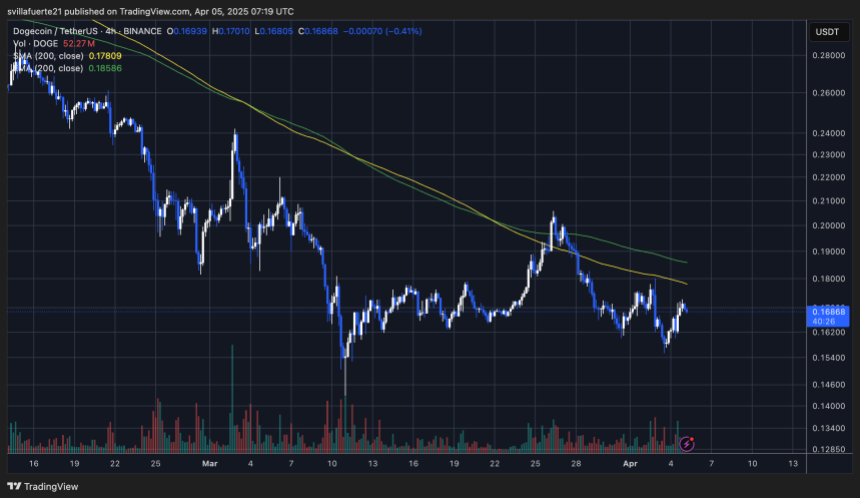
To confirm a potential recovery rally, DOGE must not only hold above the $0.169 mark but also break decisively above the $0.205 resistance level. This area has acted as a key barrier in recent weeks, and a breakout would signal a shift in momentum and open the path toward higher levels.
Related Reading
However, the downside risks remain. If DOGE loses the $0.16 support — a level that has held through previous dips — it could quickly fall below the $0.15 mark, deepening the bearish trend. With meme coins underperforming across the board and overall market sentiment still fragile, Dogecoin’s next move will be crucial. A bounce from here could mark the beginning of a recovery phase, but failure to reclaim key technical levels could result in another leg down.
Featured image from Dall-E, chart from TradingView
Source link
Avalanche
Crypto Trader Says Dogecoin Is at a Critical ‘Make-or-Break’ Level, Updates Outlook on Solana and Avalanche

Cryptocurrency trader Ali Martinez believes Dogecoin (DOGE) is at a critical level that could determine its price direction over the near term.
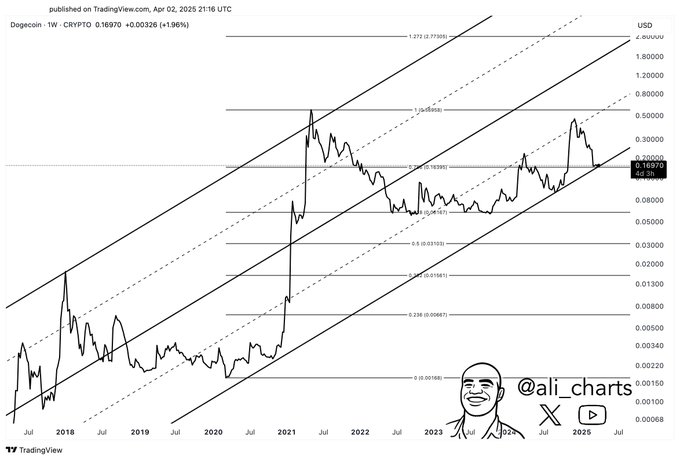
Martinez tells his 134,800 followers on the social media platform X that Dogecoin is at a “make-or-break level” of around $0.16.
According to Martinez, Dogecoin could either go up substantially by up to 256% from the support zone if the critical level holds as support or fall precipitously by around 60% if the critical level fails as support.
Based on a chart by the crypto trader, it appears he’s suggesting that Dogecoin is in an ascending channel on the weekly time frame and the make-or-break level is the lower boundary of the pattern.
“If $0.16 holds, a rally to $0.57 could follow. If it fails, a drop to $0.06 becomes likely.”
Dogecoin is trading at $0.158 at time of writing.
Next up is Solana (SOL). Martinez says the seventh-largest crypto asset by market cap is primed to go lower after breaking down below a descending triangle pattern on the daily time frame. Based on Martinez’s chart, it appears he is suggesting that Solana could plummet to around $60, about 47% from the current level.
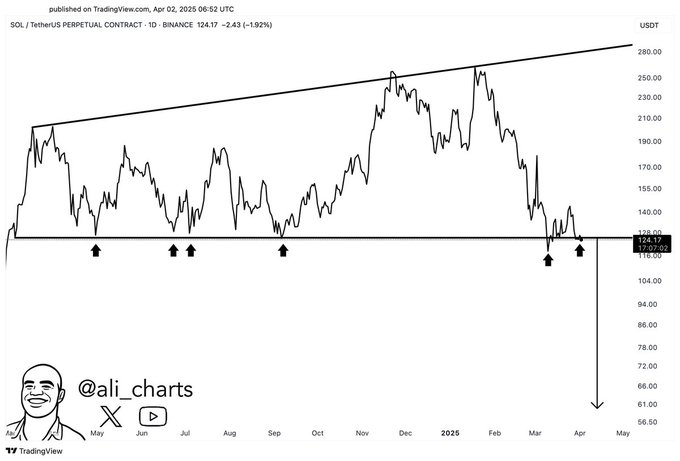
Solana is trading at $114 at time of writing.
Turning to Avalanche (AVAX), Martinez says that the utility token of the layer-one blockchain is primed to break down from the lower boundary of a rectangle pattern that has formed on the daily time frame. According to Martinez, Avalanche could fall by up to 61% from the current level.
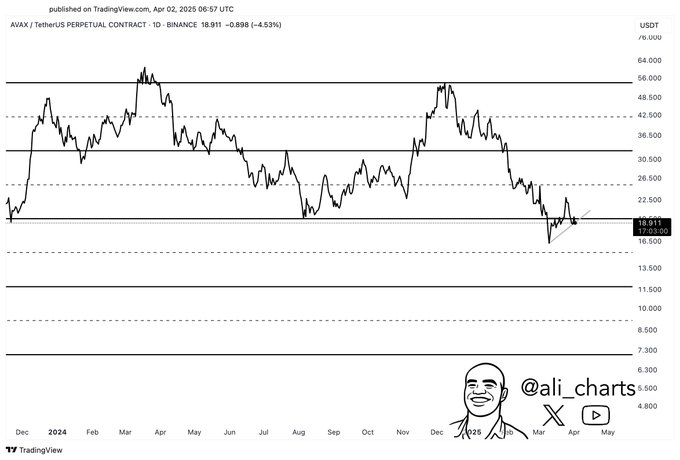
Avalanche is trading at $18 at time of writing.
Follow us on X, Facebook and Telegram
Don’t Miss a Beat – Subscribe to get email alerts delivered directly to your inbox
Check Price Action
Surf The Daily Hodl Mix
 

Disclaimer: Opinions expressed at The Daily Hodl are not investment advice. Investors should do their due diligence before making any high-risk investments in Bitcoin, cryptocurrency or digital assets. Please be advised that your transfers and trades are at your own risk, and any losses you may incur are your responsibility. The Daily Hodl does not recommend the buying or selling of any cryptocurrencies or digital assets, nor is The Daily Hodl an investment advisor. Please note that The Daily Hodl participates in affiliate marketing.
Generated Image: Midjourney
Source link

This Week in Crypto Games: Gaming Tokens Crash Out, Eve Frontier Opens Up

Commerce Secretary Lutnick walks back tariff relief on electronics

Gold ETF Inflows Hit Three-Year High as PAXG, XAUT Outperform Wider Crypto Market

Israel’s New Study Shows 51% Of Public Is Interested In Adopting CBDC (Digital Shekel) – Is That So?

Solana Price Eyes Breakout Toward $143 As Inverse Head & Shoulders Pattern Takes Shape On 4-hour Chart

Crypto malware silently steals ETH, XRP, SOL from wallets

Binance Executives Met With US Government Officials To Discuss Easing of Regulatory Supervision: Report

Michael Saylor Hints At Another MicroStrategy Bitcoin Purchase, BTC Price To Rally?

From the Crypto Trenches to the Hill: Why Solana Is Making a Big Push in Washington

Bitcoin price tags $86K as Trump tariff relief boosts breakout odds

Where Top VCs Think Crypto x AI Is Headed Next

India’s Leading Bitcoin And Crypto Exchange Unocoin Integrates Lightning

Solana Triggers Long Thesis After Pushing Above $125 – Start Of A Bigger Rally?

Popcat price surges as exchange reserves fall, profit leaders hold

Crypto Analyst Says Bitcoin Back in Business, Calls for BTC Uptrend if One Support Level Holds


 24/7 Cryptocurrency News5 months ago
Arthur Hayes, Murad’s Prediction For Meme Coins, AI & DeFi Coins For 2025

 Bitcoin3 months ago
Expert Sees Bitcoin Dipping To $50K While Bullish Signs Persist

 24/7 Cryptocurrency News3 months ago
Aptos Leverages Chainlink To Enhance Scalability and Data Access

 Bitcoin5 months ago
Bitcoin Could Rally to $80,000 on the Eve of US Elections

 Opinion5 months ago
Crypto’s Big Trump Gamble Is Risky

 Altcoins2 months ago
Sonic Now ‘Golden Standard’ of Layer-2s After Scaling Transactions to 16,000+ per Second, Says Andre Cronje

 Bitcoin5 months ago
Institutional Investors Go All In on Crypto as 57% Plan to Boost Allocations as Bull Run Heats Up, Sygnum Survey Reveals

 Price analysis5 months ago
Ripple-SEC Case Ends, But These 3 Rivals Could Jump 500x
