doge
Dogecoin Price Targets $0.15 Breakout As Open Interest Spikes 42% in July
Published
5 months agoon
By
admin
On Sunday, the Dogecoin price experienced a minor decline, tempering the recovery gains seen earlier in the week. As it consolidates in line with Bitcoin, the leading digital asset, there’s potential to stabilize market sentiment and rejuvenate the waning bullish momentum for a stronger rally. Currently, with Dogecoin down 1.9%, it’s approaching the lower support of a newly forming triangle pattern, indicating a possible opportunity for a breakout rally.
Also Read: Bitcoin Price Dips to $67K Despite Pro-Crypto Remarks from Trump, More Correction Ahead?
Dogecoin Price: Triangle Pattern Hints at Uptrend Continuation
Over the past four months, Dogecoin, the popular dog-themed memecoin, has experienced a steady downtrend, shaped by a wedge pattern with prices fluctuating between two descending trendlines. During this time, the Dogecoin price plummeted from a high of $0.228 to a low of $0.091, resulting in a significant 60% decline.

Amid July market recovery, the Dogecoin price made a sharp rebound, breaking through the pattern’s resistance on July 20th, signaling a potential trend reversal and providing a robust base for a potential rally.
The data from derivatives market data provider CoinGlass shows a notable trend in DOGE Futures Open Interest. From a July low of $492 million, Open Interest has surged to a current value of $706 million, reflecting a significant 42% increase.


This growth indicates an escalating interest and bullish sentiment among traders regarding Dogecoin’s future market movements.
Also Read: Senator Cynthia Lummis Unveils Major Pro-Bitcoin Bill At BTC Conference
Currently, the DOGE price forecast shows a consolidation breached trendline, stabilizing before potentially breaking out again. A closer look at the 4-hour chart reveals the price moving within two converging trend lines, forming a triangle pattern. Dogecoin trades at $0.129 with a market cap of $18.8 billion. Following this pattern, it might drop another 5% to retest the triangle’s support.
After this brief consolidation, Dogecoin is poised to potentially break through the triangle and continue its upward trajectory. With continued buying support, the post-breakout rally could aim for targets of $0.15 and then $0.175.
Technical Indicator
EMAs: The flattish 200D Exponential Moving Average hints the broader trend is sideways. However, a golden crossover between the 50-and-200-day EMA would intensify the bullish momentum.
RSI: The daily Relative Strength Index slope at 54% indicates a neutral to positive market sentiment among market participants.
Frequently Asked Questions (FAQs)
Open Interest refers to the total number of outstanding futures contracts that have not been settled. It provides an indication of the money flowing into a market and can reflect the strength or weakness of a particular asset.
A Golden Crossover occurs when a short-term moving average crosses above a long-term moving average. In this case, if the 50-day Exponential Moving Average (EMA) crosses above the 200-day EMA, it suggests a bullish signal.
The breakout from a 4-months correction lead by wedge pattern signals a higher potential for trend recovery. However, the ongoing triangle pattern may offer additonal confirmation if breached on upside
Related Articles
Sahil is a dedicated full-time trader with over three years of experience in the financial markets. Armed with a strong grasp of technical analysis, he keeps a vigilant eye on the daily price movements of top assets and indices. Drawn by his fascination with financial instruments, Sahil enthusiastically embraced the emerging realm of cryptocurrency, where he continues to explore opportunities driven by his passion for trading
The presented content may include the personal opinion of the author and is subject to market condition. Do your market research before investing in cryptocurrencies. The author or the publication does not hold any responsibility for your personal financial loss.
Source link
You may like


BTC Risks Falling To $20K If This Happens


Most Layer 2 solutions are still struggling with scalability


Here’s why Stellar Price Could Go Parabolic Soon

Perp-Focused HyperLiquid Experiences Record $60M in USDC Net Outflows


Experts say these 3 altcoins will rally 3,000% soon, and XRP isn’t one of them


Robert Kiyosaki Hints At Economic Depression Ahead, What It Means For BTC?
ADA
Crypto Whales Gobble Up Nearly $149,600,000 Worth of Cardano and Large-Cap Memecoin in Just Two Days: Analyst
Published
1 week agoon
December 16, 2024By
admin
An on-chain analyst says deep-pocketed investors are loading up massive amounts of Cardano (ADA) and a top memecoin as the market went sideways for the past week.
Analyst Ali Martinez tells his 98,800 followers on the social media platform X that crypto whales accumulated $85.6 million worth of ADA in a couple of days.
“Cardano whales bought over 80 million ADA in 48 hours!”
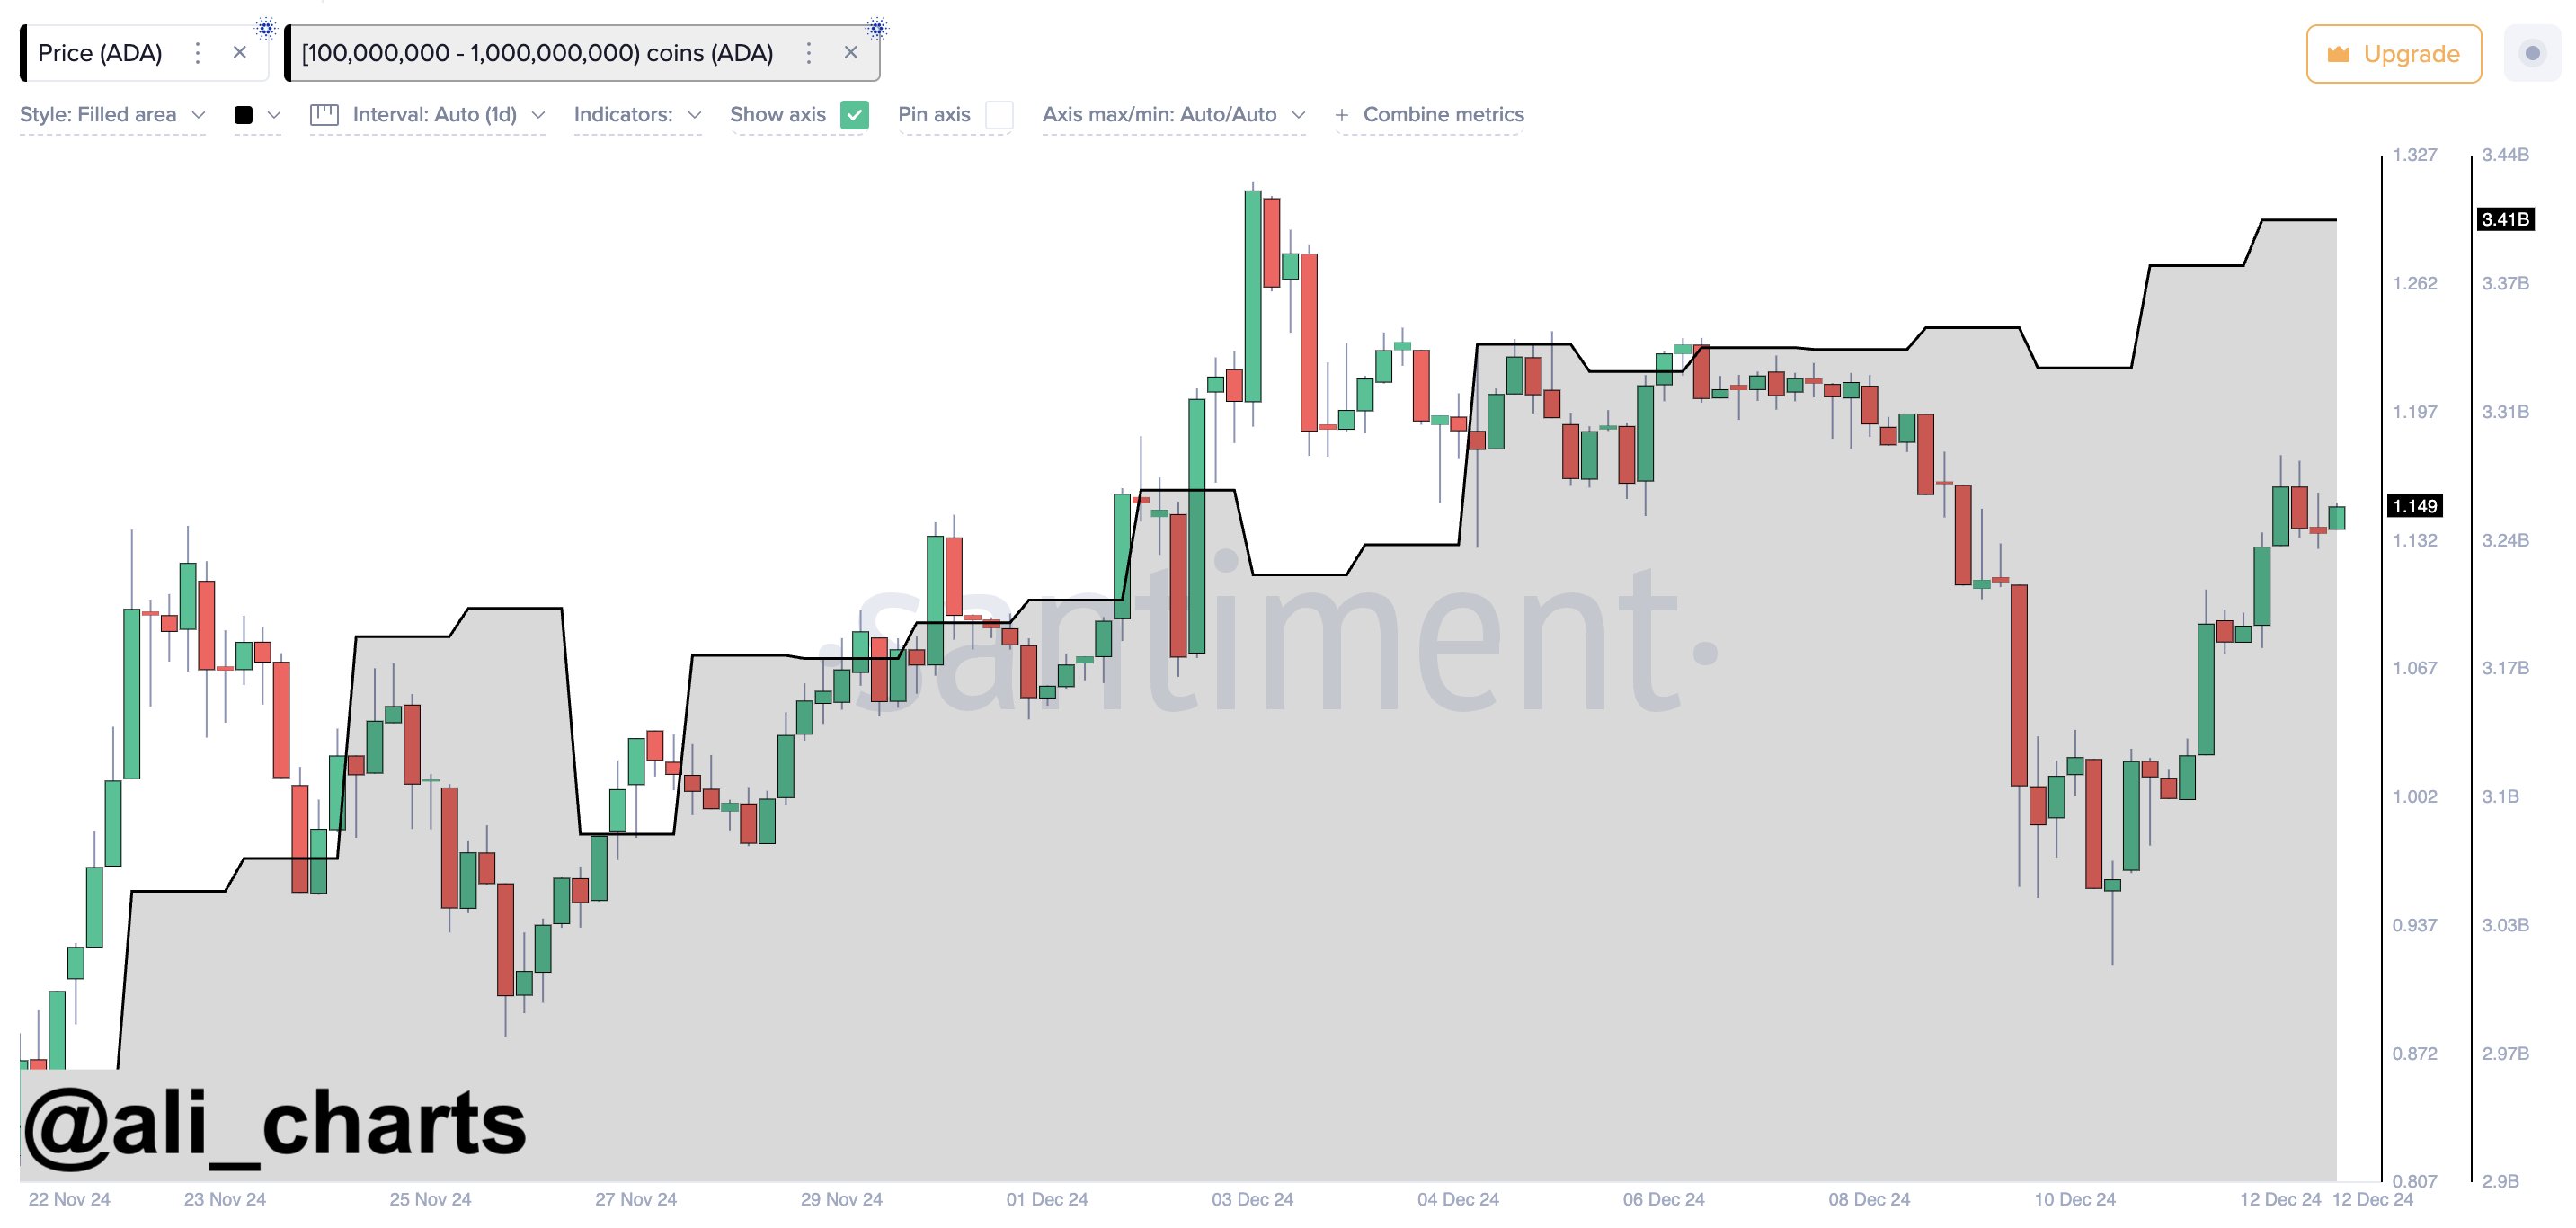
At time of writing, ADA is trading for $1.07.
Martinez also says deep-pocketed investors snapped up $64 million worth of the large-cap memecoin Dogecoin (DOGE).
“Whales bought another 160 million Dogecoin DOGE in 24 hours!”
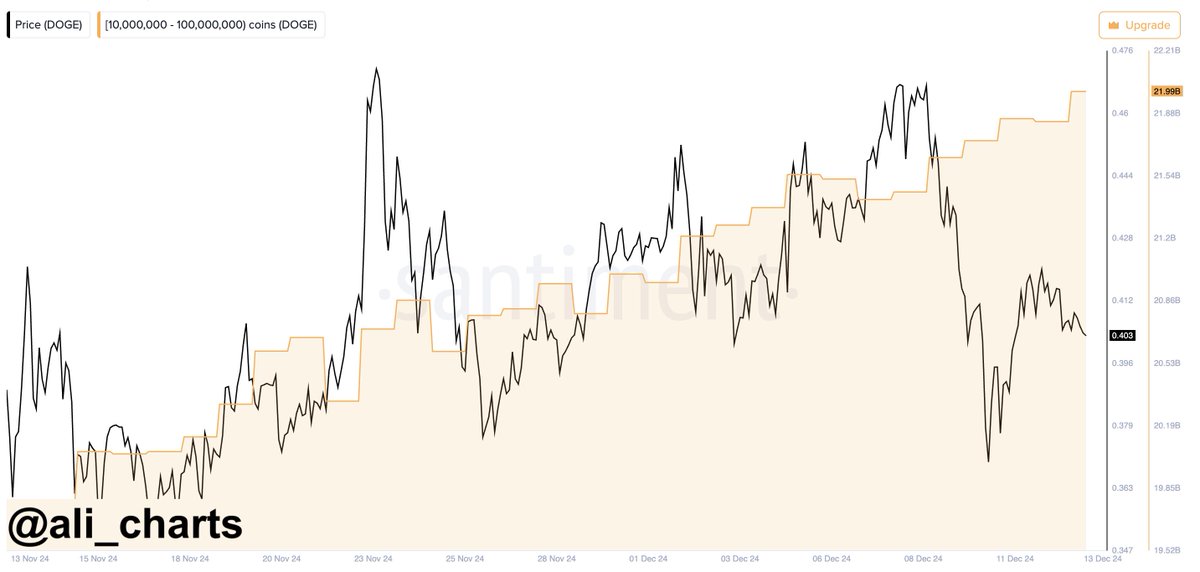
At time of writing, DOGE is worth $0.40.
In total, the crypto whales accumulated nearly $150 million worth of ADA and DOGE in just two days during the past week.
Turning to Bitcoin, Martinez says he’s looking at BTC‘s In/Out of the Money Around Price (IOMAP) metric. IOMAP classifies crypto addresses as either profiting, breaking even, or losing money – to determine support and resistance levels for BTC.
According to the analyst, Bitcoin has a fortress of support above $94,000 as millions of wallets accumulated millions of BTC around and above the price area.
“Bitcoin sits on top of a significant support wall between $94,300 and $100,250, where 2.25 million wallets bought over 2.18 million BTC.”

At time of writing, Bitcoin is trading for $101,946.
Don’t Miss a Beat – Subscribe to get email alerts delivered directly to your inbox
Check Price Action
Follow us on X, Facebook and Telegram
Surf The Daily Hodl Mix
 

Disclaimer: Opinions expressed at The Daily Hodl are not investment advice. Investors should do their due diligence before making any high-risk investments in Bitcoin, cryptocurrency or digital assets. Please be advised that your transfers and trades are at your own risk, and any losses you may incur are your responsibility. The Daily Hodl does not recommend the buying or selling of any cryptocurrencies or digital assets, nor is The Daily Hodl an investment advisor. Please note that The Daily Hodl participates in affiliate marketing.
Generated Image: Midjourney
Source link
ADA
Analyst Says Dogecoin in Early Bull Market Stage, Sees DOGE Skyrocketing to Huge Target ‘If Things Go Wild’
Published
2 weeks agoon
December 12, 2024By
admin
A closely followed crypto trader believes that top memecoin Dogecoin (DOGE) could soar to double digits based on historical patterns.
Crypto strategist Ali Martinez tells his 97,000 followers on the social media platform X that DOGE appears to be in the phase of the cycle when it pauses before skyrocketing to new record highs.
The trader shares a chart suggesting that DOGE is mirroring its price action during the 2017 and 2021 market cycles while trading in a large ascending channel.
“Check out where we are in the Dogecoin DOGE bull cycle! Very early, right?
For that reason, I’m thankful for the dip and will buy more between $0.40-$0.30. The target remains $3, and if things go wild, $18!”
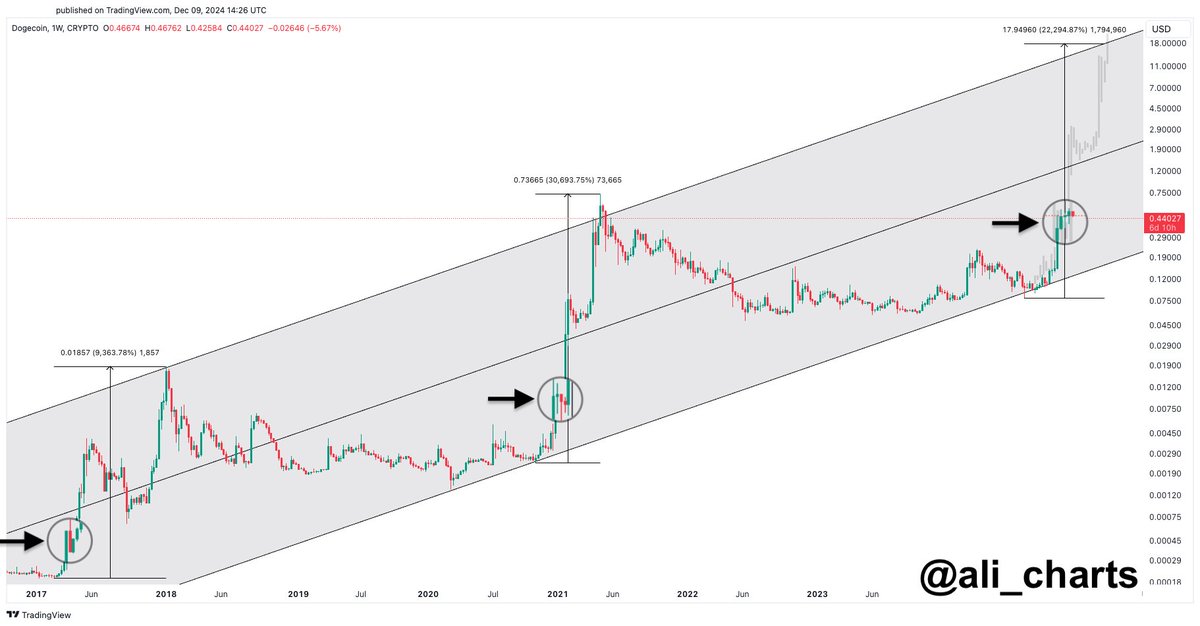
At time of writing, DOGE is trading for $0.391, down nearly 5% on the day.
Turning to the layer-1 protocol Cardano (ADA), Martinez says that the altcoin can find support at the $1 level based on the In/Out of the Money Around Price (IOMAP) metric.
IOMAP classifies crypto addresses as either profiting, breaking even, or losing money – to determine support and resistance levels for ADA. According to the metric, 41,720 addresses have accumulated over one billion ADA at $1.

Zooming out, Martinez says Cardano appears to be following its 2020 price action when it witnessed a period of retracement before soaring to fresh highs.
“Cardano is doing the same as it did in 2020, which is why I’m buying! Even if it dips down to $0.76, I’m buying more and plan to book profits between $4 and $6.”
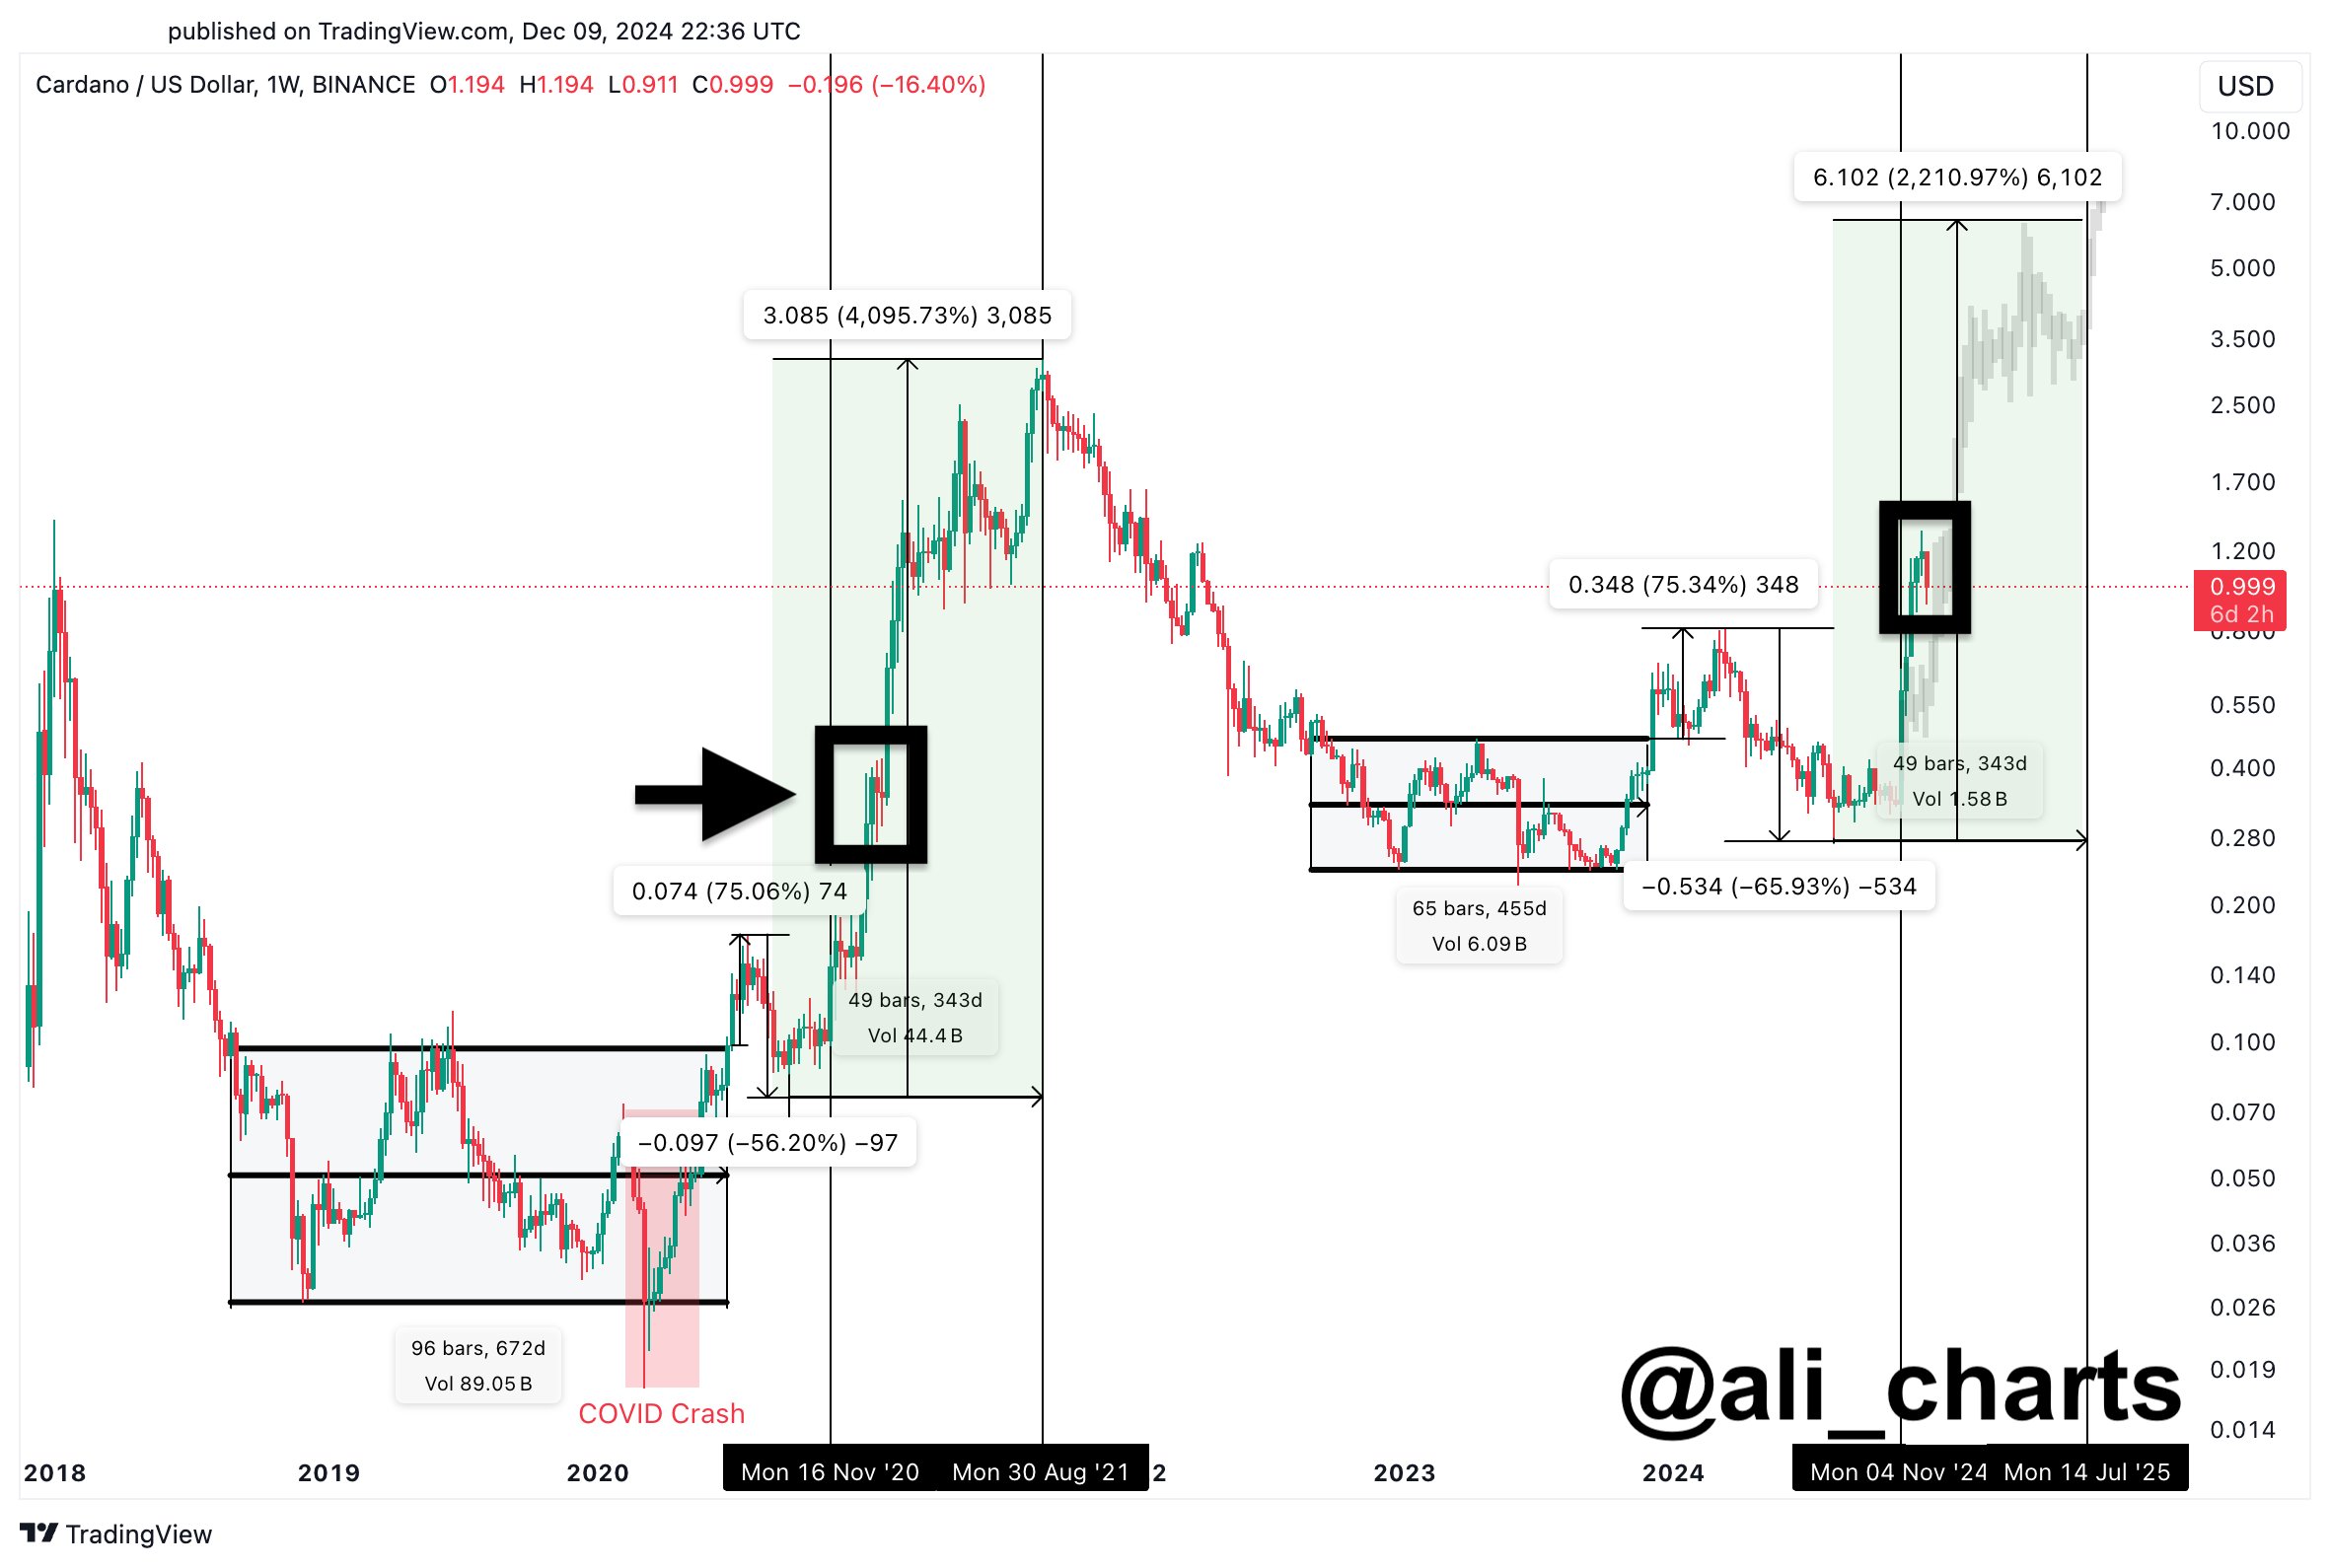
At time of writing, ADA is trading at $1.
Don’t Miss a Beat – Subscribe to get email alerts delivered directly to your inbox
Check Price Action
Follow us on X, Facebook and Telegram
Surf The Daily Hodl Mix
 

Disclaimer: Opinions expressed at The Daily Hodl are not investment advice. Investors should do their due diligence before making any high-risk investments in Bitcoin, cryptocurrency or digital assets. Please be advised that your transfers and trades are at your own risk, and any losses you may incur are your responsibility. The Daily Hodl does not recommend the buying or selling of any cryptocurrencies or digital assets, nor is The Daily Hodl an investment advisor. Please note that The Daily Hodl participates in affiliate marketing.
Generated Image: Midjourney
Source link
Analyst
Dogecoin Price Continues Trading Sideways But Bullish Pennant Says Get Ready For $1.30
Published
3 weeks agoon
December 4, 2024By
admin
The Dogecoin price action in the past 48 hours has been highlighted by a consolidation below the $0.45 price level. Interestingly, technical analysis shows that this consolidation is part of a bullish pennant that has been in formation since early November. Particularly, Dogecoin is currently in the flag phase of the bullish pennant formation, which is known to be the consoldation phase before the next leg up.
According to Crypto analyst KrissPax, this Dogecoin price movement is creating a “great springboard for the next big Doge pump.”
Dogecoin’s Sideways Trading Forms The Foundation For Growth
The Dogecoin price has been trading within range since it reached the $0.47 mark on November 23. This range has been highlighted by a key support level around $0.37 that prevented further declines on November 26. Crypto analyst KrissPax noted that this consolidation has held above support, which he interprets as constructive rather than negative.
Related Reading
In terms of a Dogecoin price outlook, KrissPax highlighted that the consolidation has led to the formation of a bullish pennant, which is set to be broken at the upper trendline. For his price prediction, he highlighted the $1.3 level as the prime target after the breakout.
The bullish pennant typically forms after a strong upward rally followed by consolidation, with price movements resembling a triangle. A breakout from this pattern often signals the continuation of the prior trend, making $1.30 a plausible target if the pattern holds true.
The current Dogecoin sideways trading is holding support and making for a great springboard for the next big Doge pump. This bullish pennant targets a big move up to $1.30!
Chart: Trader Tardigrade pic.twitter.com/cho062TLNU
— KrissPax (@krisspax) December 3, 2024
What Could Drive The Dogecoin Price To $1.3?
At the time of writing, Dogecoin is trading at $0.419, according to CoinMarketCap, reflecting an impressive surge of about 178% over the past 30 days. Should Dogecoin manage to sustain its upward trajectory and achieve a breakout toward the $1.30 target, it would represent an additional 210% increase from its current price, as well as a decisive move beyond its all-time high of $0.7316.
Related Reading
However, the path to $1.30 depends on other market factors that extend beyond the bullish pennant pattern currently forming in Dogecoin’s price chart. Nonetheless, current market factors suggest that the meme coin’s price is still in a good position to keep growing. A key contributor to this outlook is the recent surge in activity on the Dogecoin blockchain, particularly among large holders.
According to data from blockchain analytics firm Santiment, there has been a significant whale accumulation over the past several days. According to Santiment’s data, Dogecoin whales collectively acquired an additional 160 million $DOGE tokens within just 48 hours. This increase in demand could help sustain Dogecoin’s price rally and support its bid to surpass previous highs.
Featured image created with Dall.E, chart from Tradingview.com
Source link

BTC Risks Falling To $20K If This Happens

Most Layer 2 solutions are still struggling with scalability

Here’s why Stellar Price Could Go Parabolic Soon

Perp-Focused HyperLiquid Experiences Record $60M in USDC Net Outflows

Experts say these 3 altcoins will rally 3,000% soon, and XRP isn’t one of them

Robert Kiyosaki Hints At Economic Depression Ahead, What It Means For BTC?

BNB Steadies Above Support: Will Bullish Momentum Return?

Metaplanet makes largest Bitcoin bet, acquires nearly 620 BTC

Tron’s Justin Sun Offloads 50% ETH Holdings, Ethereum Price Crash Imminent?

Investors bet on this $0.0013 token destined to leave Cardano and Shiba Inu behind

End of Altcoin Season? Glassnode Co-Founders Warn Alts in Danger of Lagging Behind After Last Week’s Correction

Can Pi Network Price Triple Before 2024 Ends?

XRP’s $5, $10 goals are trending, but this altcoin with 7,400% potential takes the spotlight

CryptoQuant Hails Binance Reserve Amid High Leverage Trading

Trump Picks Bo Hines to Lead Presidential Crypto Council
182267361726451435

Why Did Trump Change His Mind on Bitcoin?

Top Crypto News Headlines of The Week

New U.S. president must bring clarity to crypto regulation, analyst says

Will XRP Price Defend $0.5 Support If SEC Decides to Appeal?

Bitcoin Open-Source Development Takes The Stage In Nashville

Ethereum, Solana touch key levels as Bitcoin spikes

Bitcoin 20% Surge In 3 Weeks Teases Record-Breaking Potential

Ethereum Crash A Buying Opportunity? This Whale Thinks So

Shiba Inu Price Slips 4% as 3500% Burn Rate Surge Fails to Halt Correction

Washington financial watchdog warns of scam involving fake crypto ‘professors’

‘Hamster Kombat’ Airdrop Delayed as Pre-Market Trading for Telegram Game Expands

Citigroup Executive Steps Down To Explore Crypto
Mostbet Güvenilir Mi – Casino Bonus 2024

NoOnes Bitcoin Philosophy: Everyone Eats
Trending

 3 months ago
182267361726451435

 Donald Trump5 months ago
Why Did Trump Change His Mind on Bitcoin?

 24/7 Cryptocurrency News4 months ago
Top Crypto News Headlines of The Week

 News4 months ago
New U.S. president must bring clarity to crypto regulation, analyst says

 Price analysis4 months ago
Will XRP Price Defend $0.5 Support If SEC Decides to Appeal?

 Opinion5 months ago
Bitcoin Open-Source Development Takes The Stage In Nashville

 Bitcoin5 months ago
Ethereum, Solana touch key levels as Bitcoin spikes

 Bitcoin5 months ago
Bitcoin 20% Surge In 3 Weeks Teases Record-Breaking Potential


✓ Share: