
ETH
Ethereum Price Targets a Comeback: Will the Bounce Last?

Ethereum price extended losses and tested the $2,320 support. ETH is now correcting losses and might aim for a fresh increase above the $2,420 resistance.
- Ethereum remained in a bearish zone and traded below the $2,360 zone.
- The price is trading below $2,420 and the 100-hourly Simple Moving Average.
- There is a connecting bearish trend line forming with resistance at $2,420 on the hourly chart of ETH/USD (data feed via Kraken).
- The pair must stay above the $2,350 support level to start decent increase in the near term.
Ethereum Price Aims Upside Break
Ethereum price failed to start a fresh increase above the $2,450 resistance zone. ETH remained in a bearish zone like Bitcoin and traded below the $2,365 support zone.
There was also a move below the $2,350 level. The price tested the $2,320 support zone. A low was formed at $2,329 and the price is now rising. There was a move above the $2,350 and $2,365 levels. The price climbed above the 23.6% Fib retracement level of the downward wave from the $2,468 swing high to the $2,329 low.
Ethereum price is now trading below $2,420 and the 100-hourly Simple Moving Average. On the upside, the price seems to be facing hurdles near the $2,420 level. There is also a connecting bearish trend line forming with resistance at $2,420 on the hourly chart of ETH/USD.
The trend line is close to the 61.8% Fib retracement level of the downward wave from the $2,468 swing high to the $2,329 low. A clear move above the $2,420 resistance might send the price toward the $2,450 resistance.

An upside break above the $2,420 resistance might call for more gains in the coming sessions. In the stated case, Ether could rise toward the $2,500 resistance zone in the near term. The next hurdle sits near the $2,550 level or $2,560.
More Losses In ETH?
If Ethereum fails to clear the $2,420 resistance, it could start another decline. Initial support on the downside is near the $2,380 level. The first major support sits near the $2,350 zone.
A clear move below the $2,350 support might push the price toward $2,320. Any more losses might send the price toward the $2,265 support level in the near term. The next key support sits at $2,220.
Technical Indicators
Hourly MACD – The MACD for ETH/USD is gaining momentum in the bullish zone.
Hourly RSI – The RSI for ETH/USD is now above the 50 zone.
Major Support Level – $2,320
Major Resistance Level – $2,420
Source link


Altcoins
Trader Predicts ‘God Candle’ Breakout for Ethereum, Says New All-Time High Loading for One Memecoin

A popular crypto analyst thinks that Ethereum (ETH) is on the verge of printing a massive breakout rally also known as a god candle.
Pseudonymous analyst Inmortal tells his 221,100 followers on the social media platform X that Ethereum’s two-hour chart looks similar to Bitcoin’s (BTC) price action over the last two weeks.
The analyst says that while Ethereum struggles to clear resistance at $4,000, he notes that BTC also had trouble breaching $100,000 for weeks before surging to new all-time highs.
“Same price action, but with one difference.
God candle after the breakout.
ETH.”
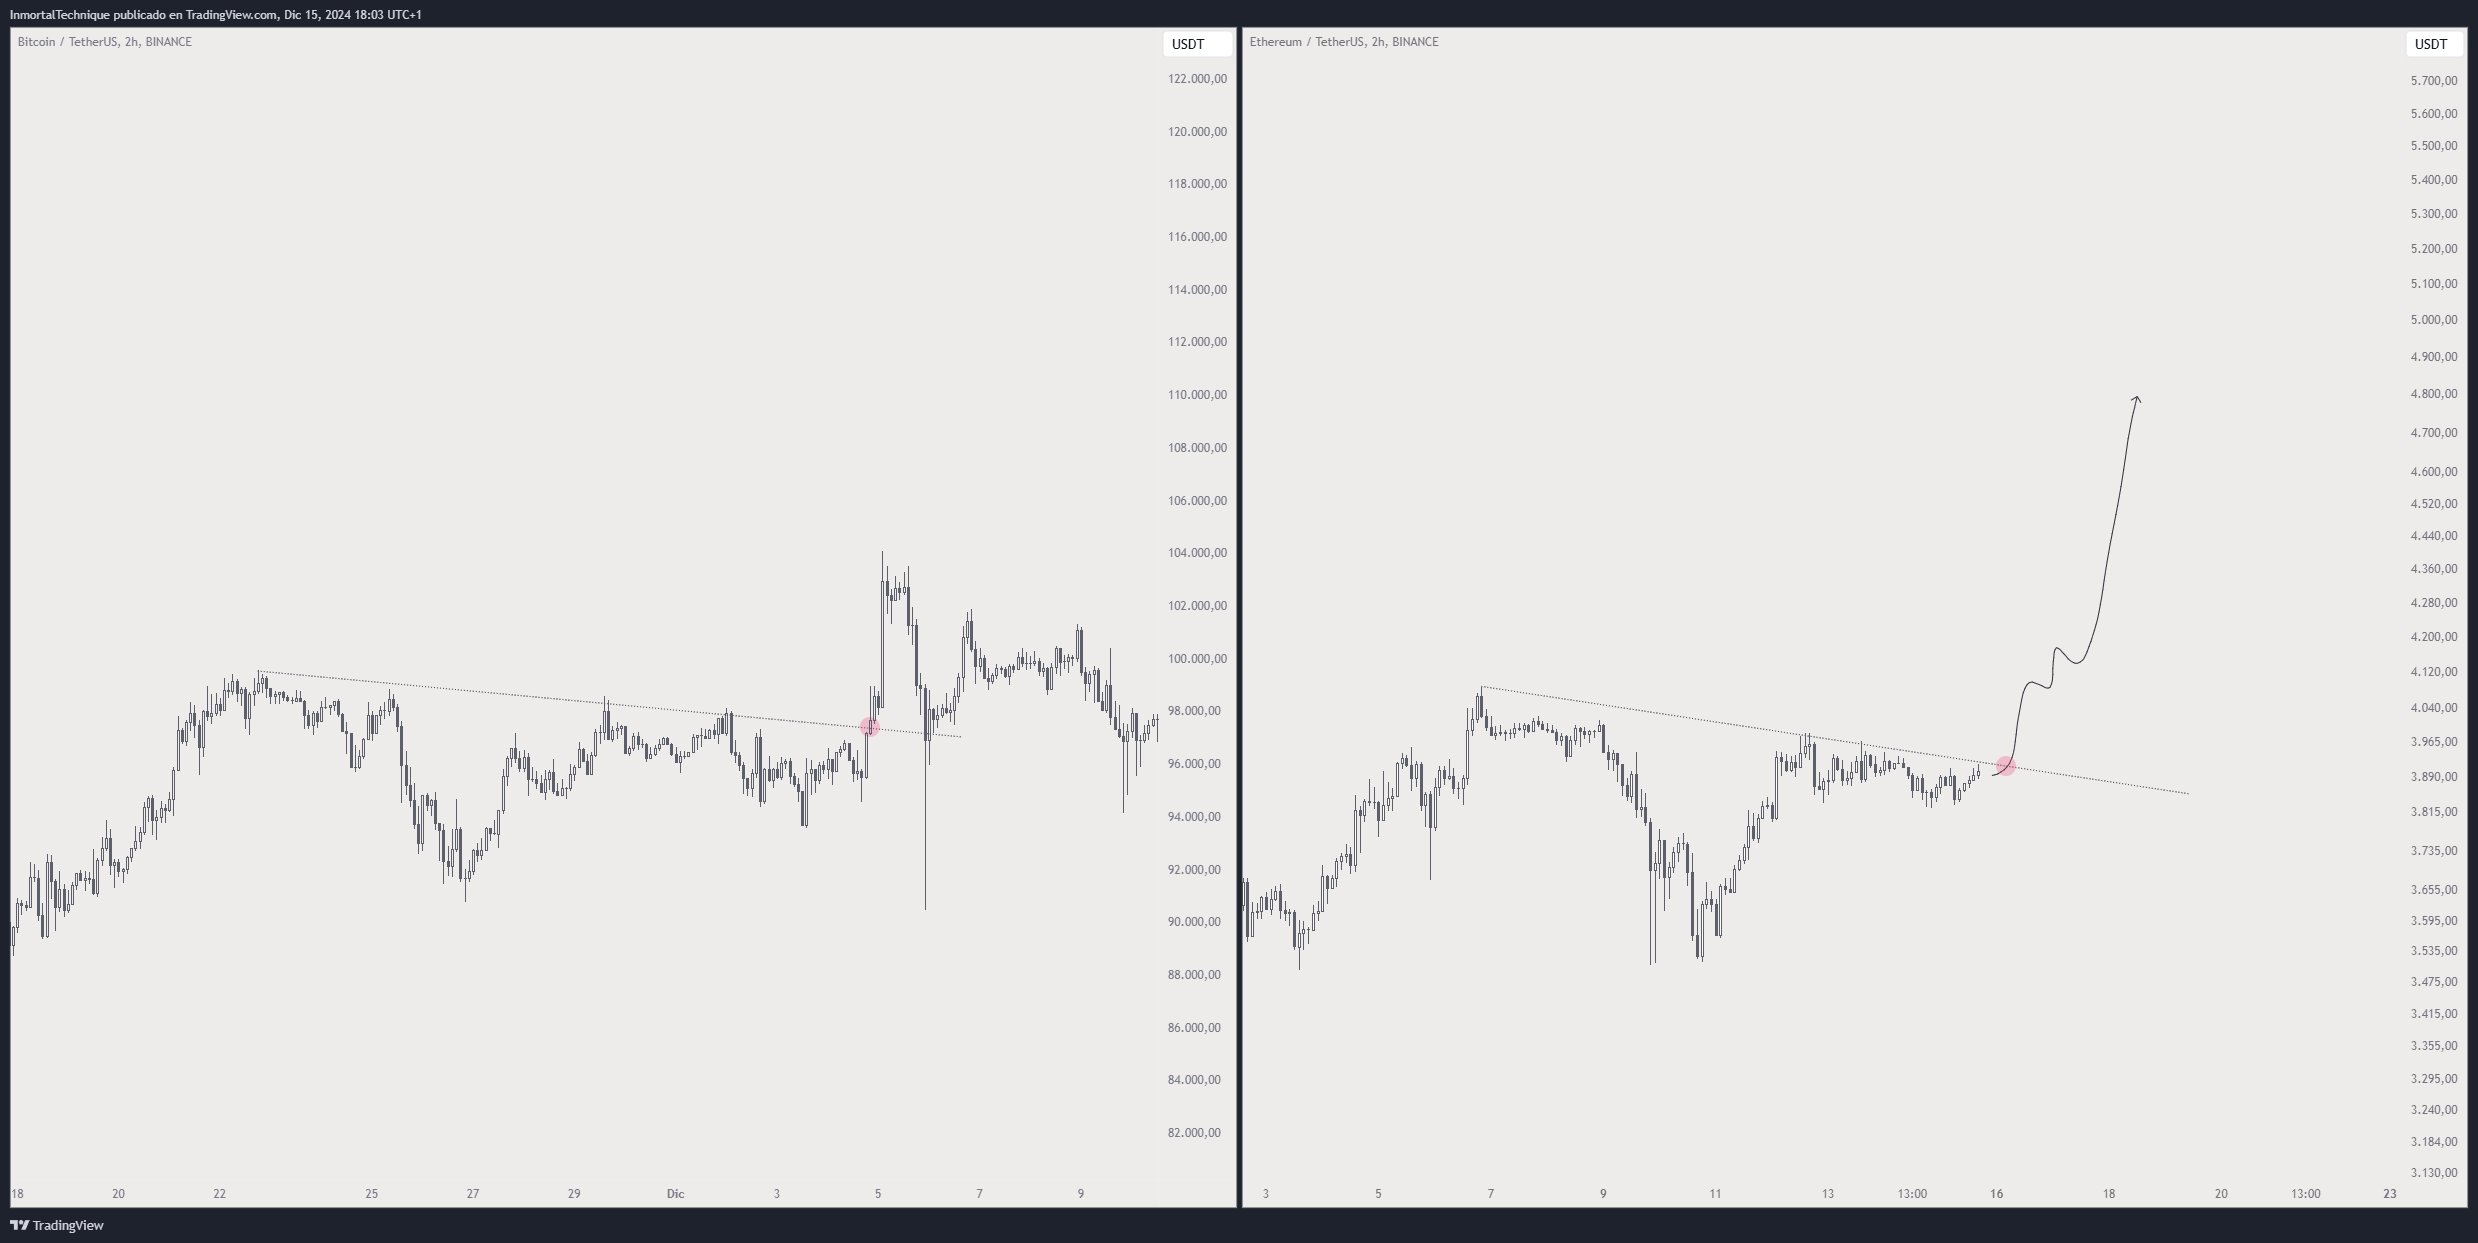
Based on the trader’s chart, he seems to predict that ETH will surge close to its all-time high of $4,800 after the breakout. At time of writing, ETH is worth $3,892.
The trader also has his radar locked on the memecoin Floki (FLOKI). According to the trader, FLOKI appears to be trading in a symmetrical triangle pattern and is gearing up to shatter the structure’s diagonal resistance en route to new record highs.
“Second leg up – loading.
New ATH – loading.
Price discovery – loading.
FLOKI.”
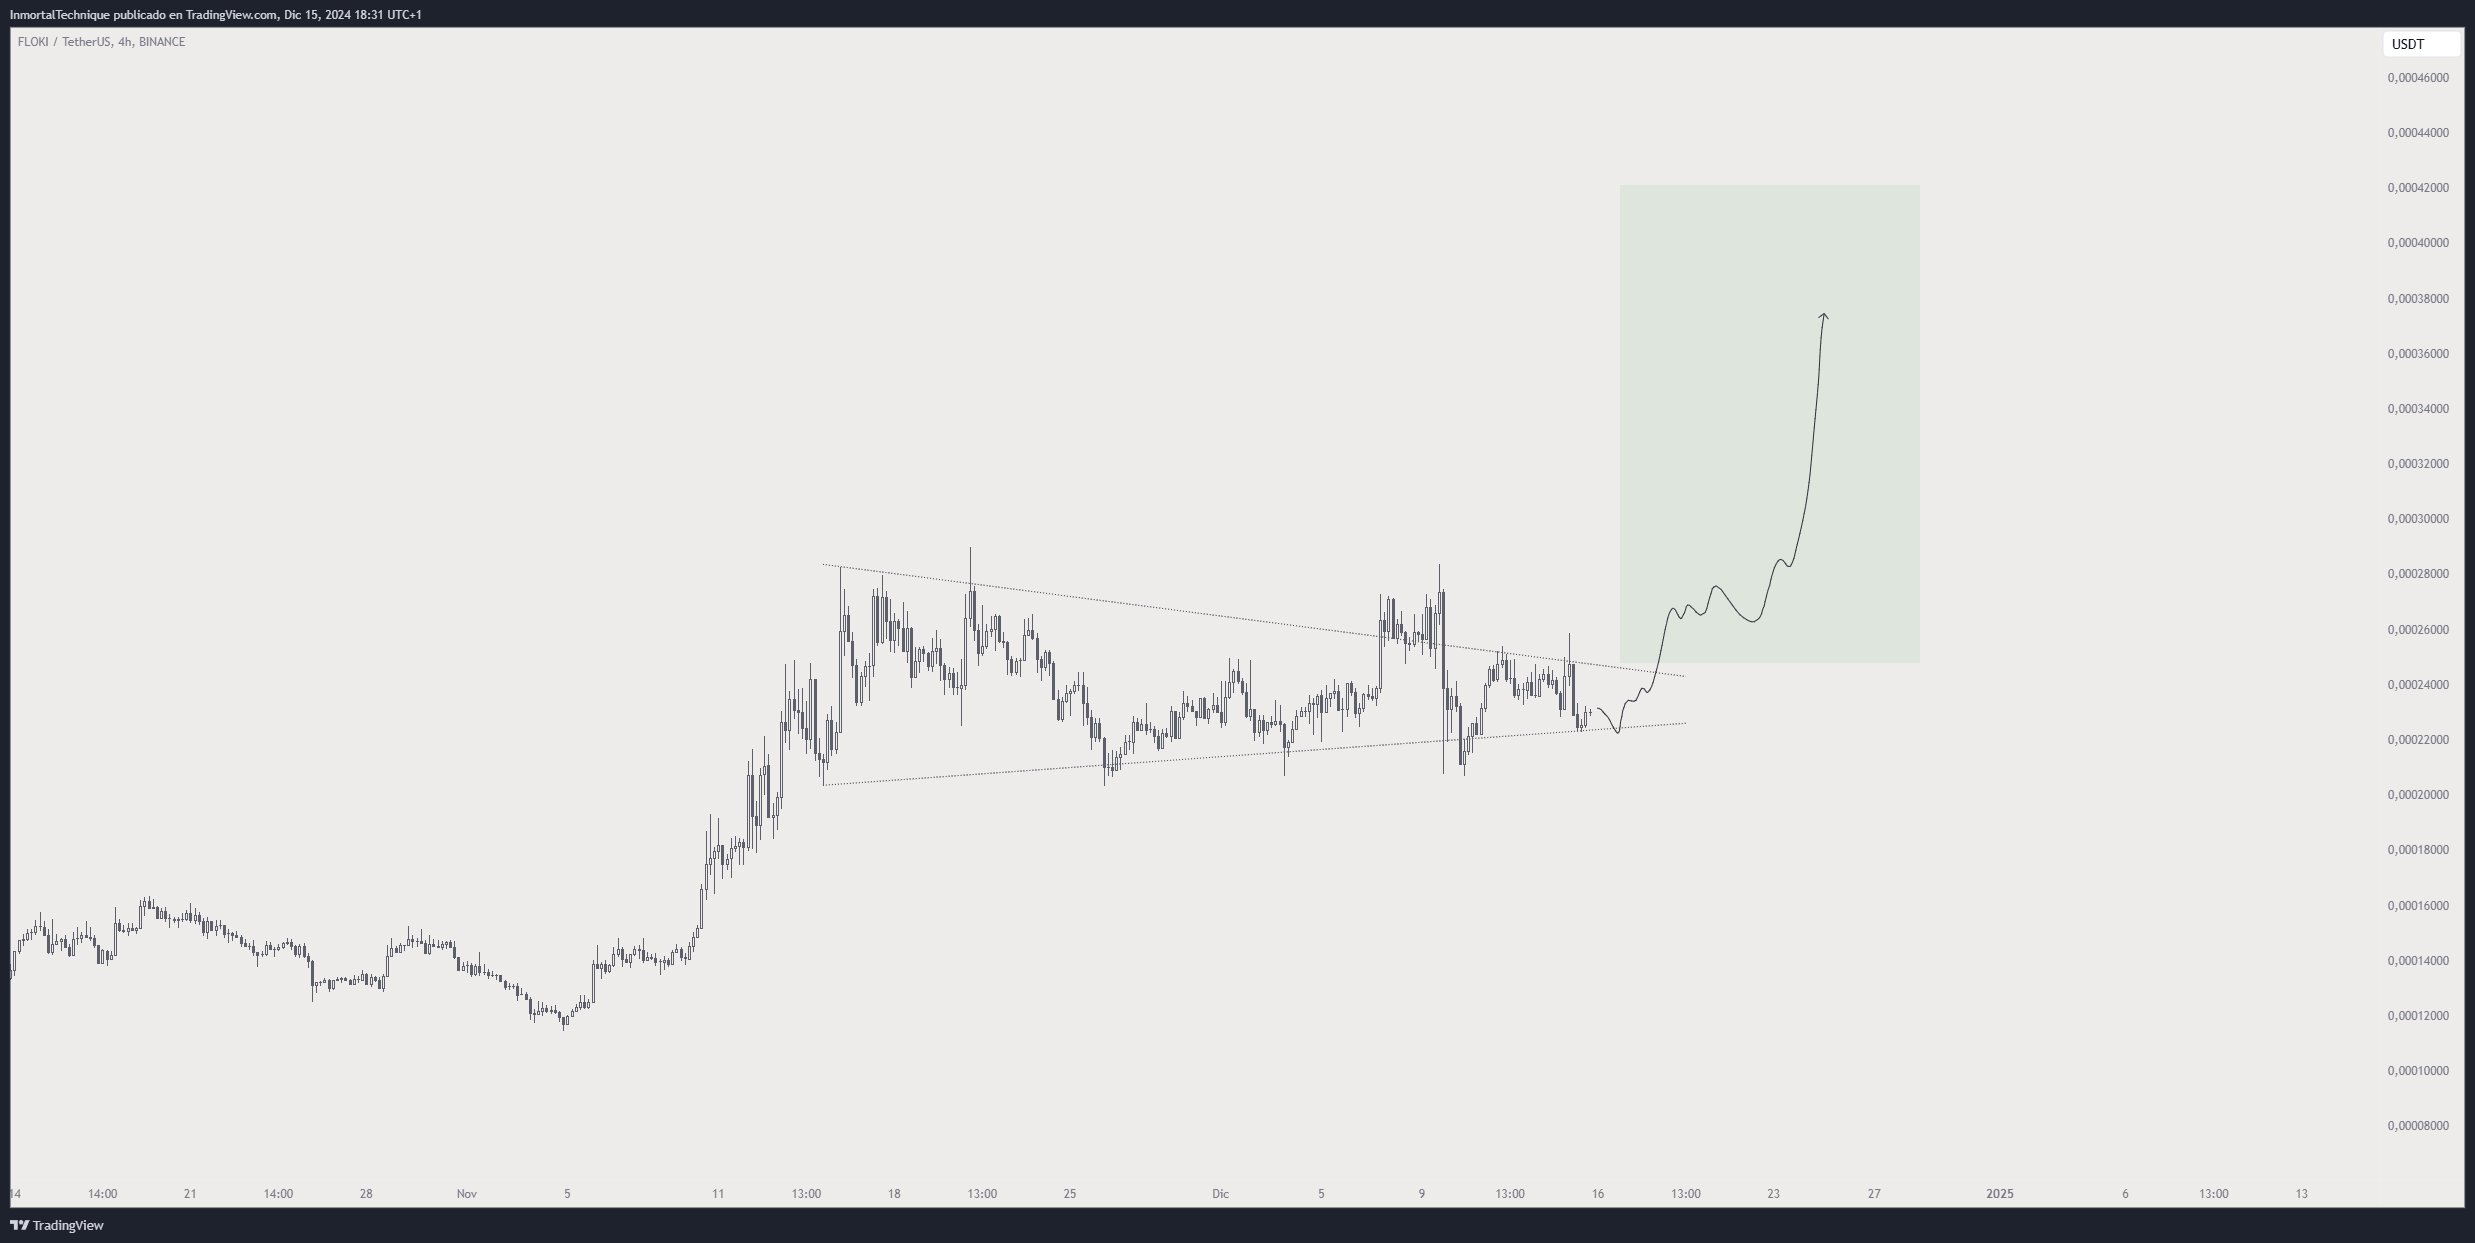
Based on the trader’s chart, he seems to predict that FLOKI will explode to a new all-time high of $0.00038. At time of writing, FLOKI is worth $0.000219.
Looking at Solana (SOL), the trader sees the Ethereum rival bursting above its diagonal resistance to rally toward $300.
“Something like this.
SOL.”
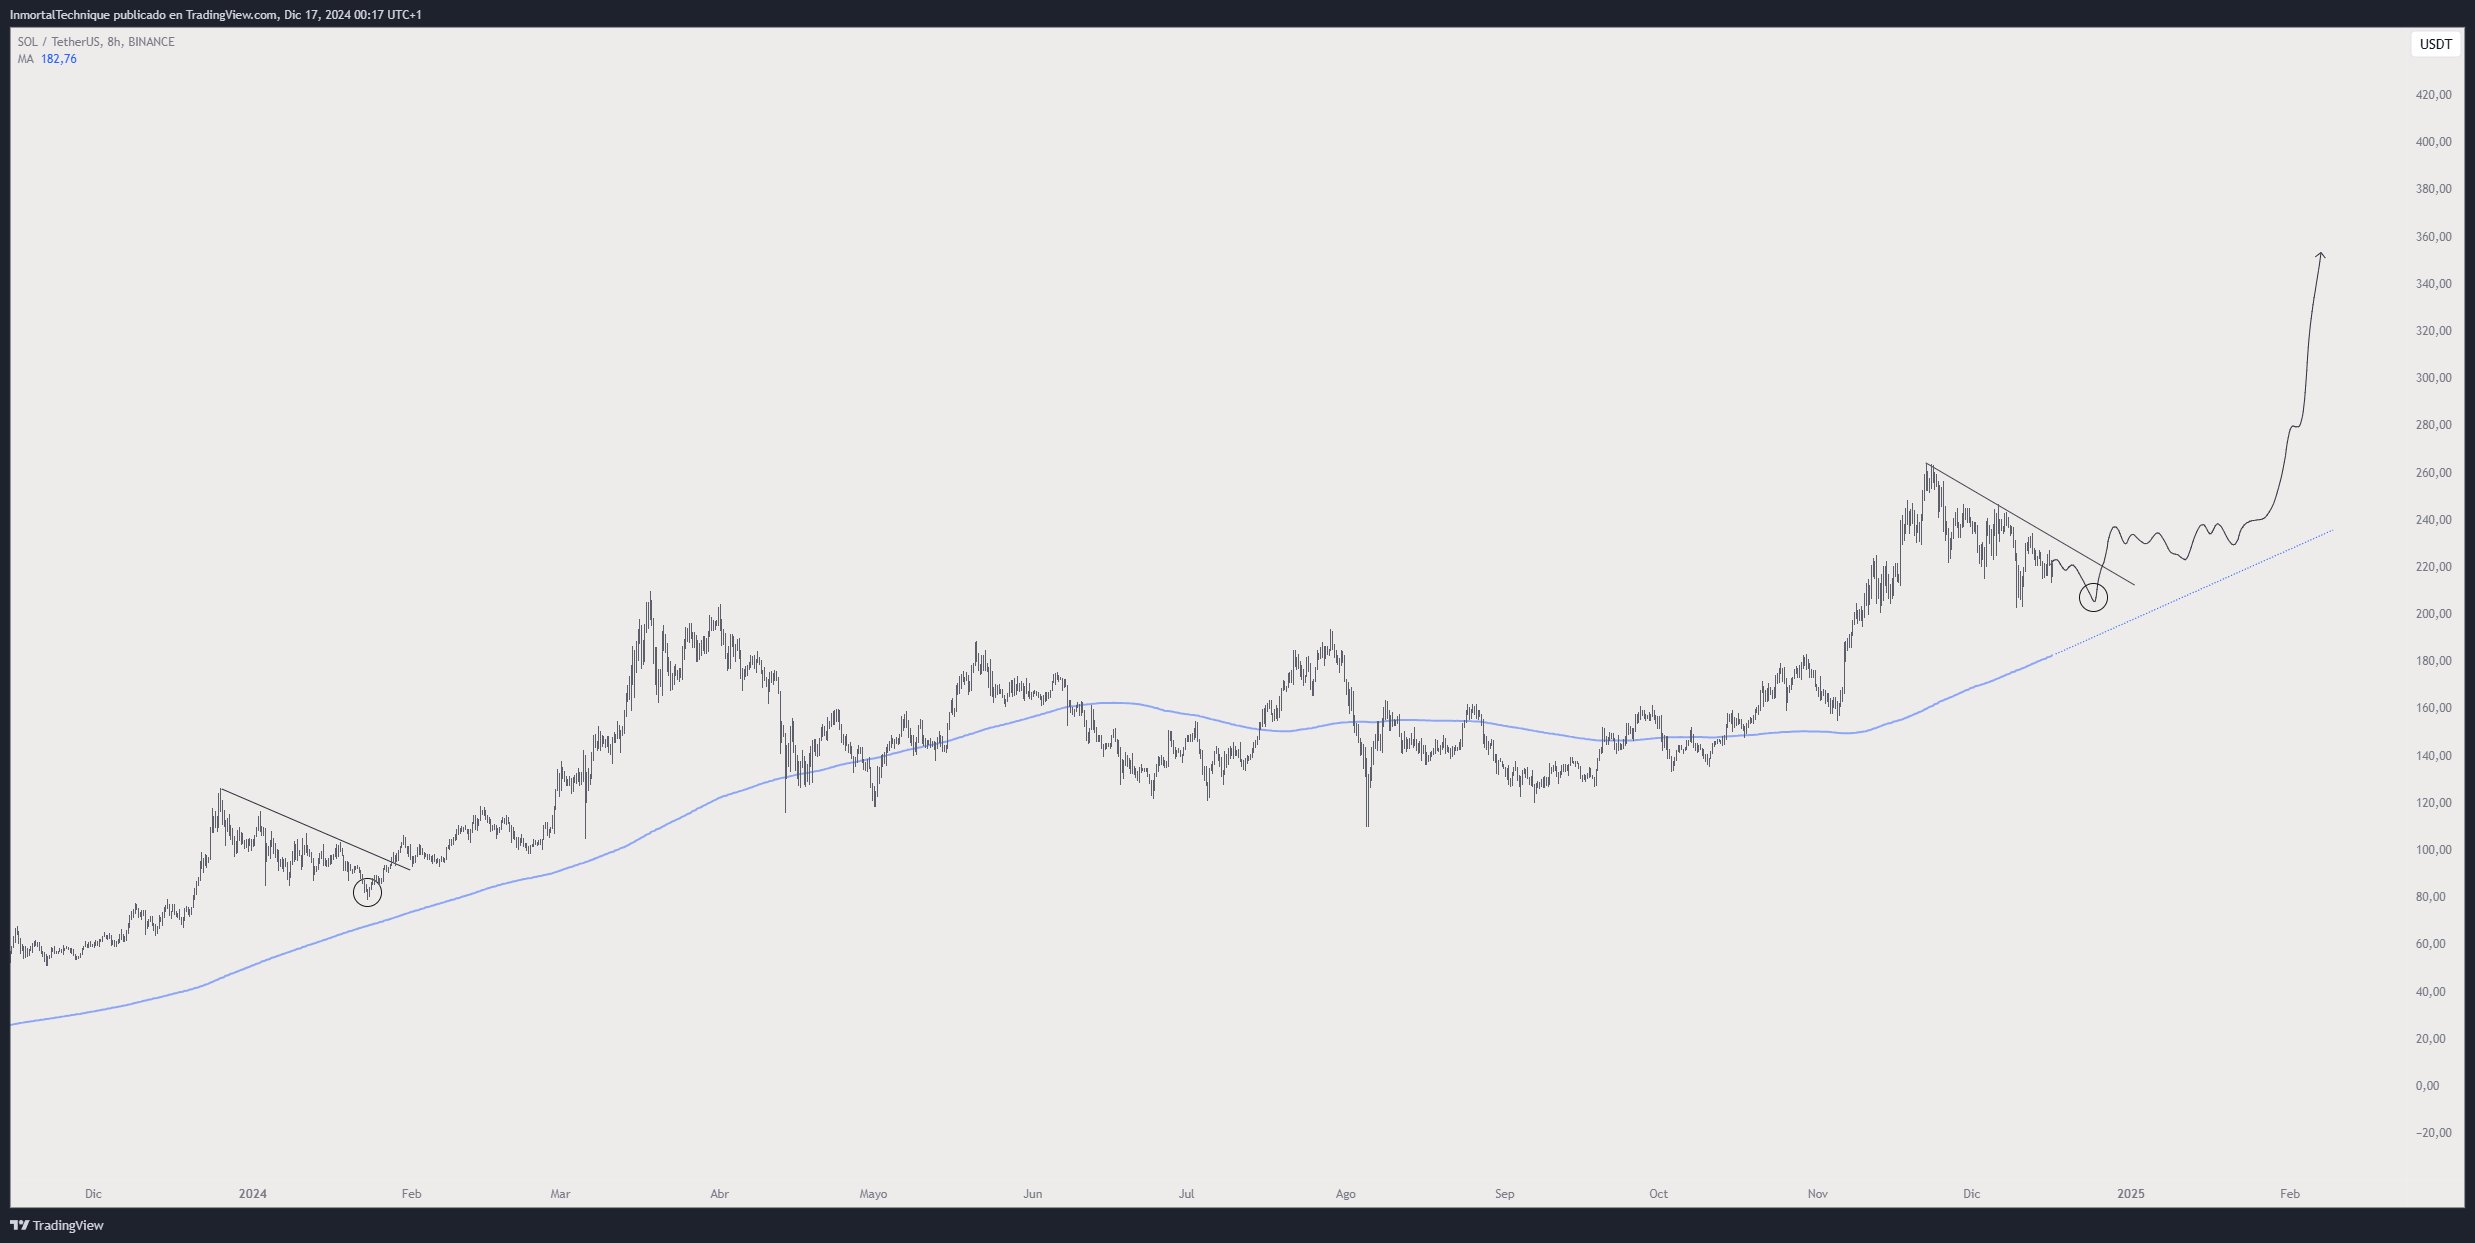
At time of writing, SOL is worth $222.60.
Don’t Miss a Beat – Subscribe to get email alerts delivered directly to your inbox
Check Price Action
Follow us on X, Facebook and Telegram
Surf The Daily Hodl Mix
 

Disclaimer: Opinions expressed at The Daily Hodl are not investment advice. Investors should do their due diligence before making any high-risk investments in Bitcoin, cryptocurrency or digital assets. Please be advised that your transfers and trades are at your own risk, and any losses you may incur are your responsibility. The Daily Hodl does not recommend the buying or selling of any cryptocurrencies or digital assets, nor is The Daily Hodl an investment advisor. Please note that The Daily Hodl participates in affiliate marketing.
Generated Image: Midjourney
Source link
Bitcoin
Analyst Says It’s Time for New Ethereum All-Time High, Sees Bitcoin Going ‘Full Santa Claus Mode’

A closely followed crypto trader believes that conditions are nearly ripe for Ethereum (ETH) to witness a surge to fresh record highs.
Crypto strategist Justin Bennett tells his 115,400 followers on the social media platform X that it’s only a matter of time before Ethereum fully reclaims resistance at $4,000 as support.
According to Bennett, Bitcoin has been on a grind-up this month and traders will eventually rotate some of their BTC profits to ETH to capture more upside potential.
“ETH has struggled at $4,000 for obvious technical reasons, and BTC has stolen the show so far in December.
But I’m betting we will see some of those Bitcoin profits flow into Ethereum soon.
If ETH can clear $4,000-$4,100, there isn’t much stopping a sprint to $4,800 and potentially mid $5,000 to complete this channel.
Time for a new Ethereum ATH (all-time high).”
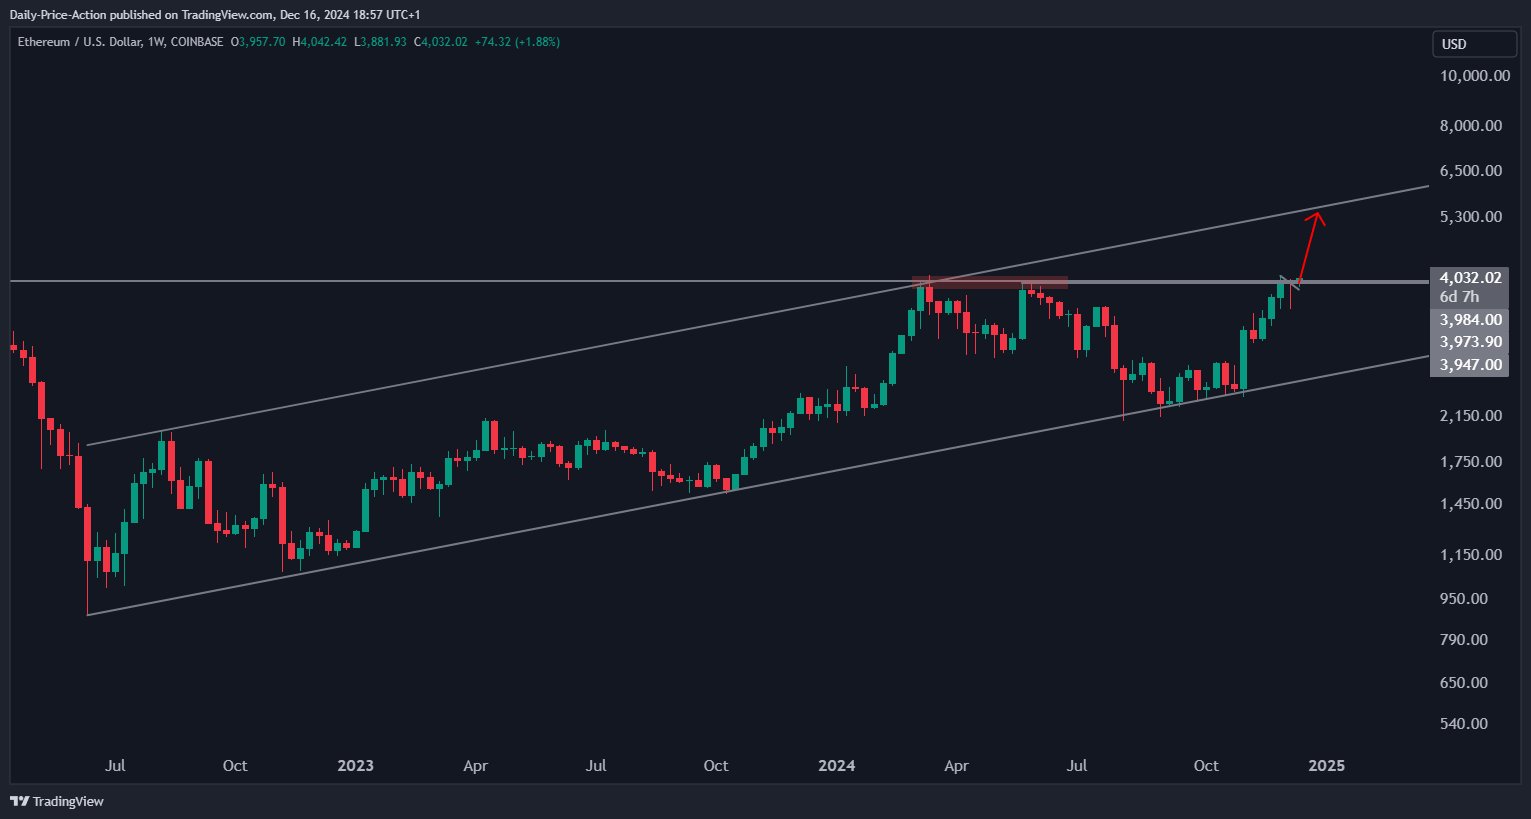
At time of writing, Ethereum is trading for $3,873.
For the rest of December, Bennett thinks that the two largest crypto assets by market cap will outperform the rest of the digital asset market.
“Focusing on BTC and ETH for the next two weeks makes the most sense, IMO (in my opinion).
Alts will have their time again, but probably not before we see some crazy bullish moves from Bitcoin and Ethereum through the end of the year.”
Looking at Bitcoin itself, the trader says that BTC is in the midst of a Christmas rally, and he expects the crypto king to shatter its diagonal resistance en route to new all-time highs.
“Bitcoin going full Santa Claus mode.
Pullbacks might be hard to come by through the end of the year, especially with the speculation of BTC becoming a US reserve asset under Trump.
Wouldn’t be surprised to see $116,000 or even $125,000 through the end of December.”
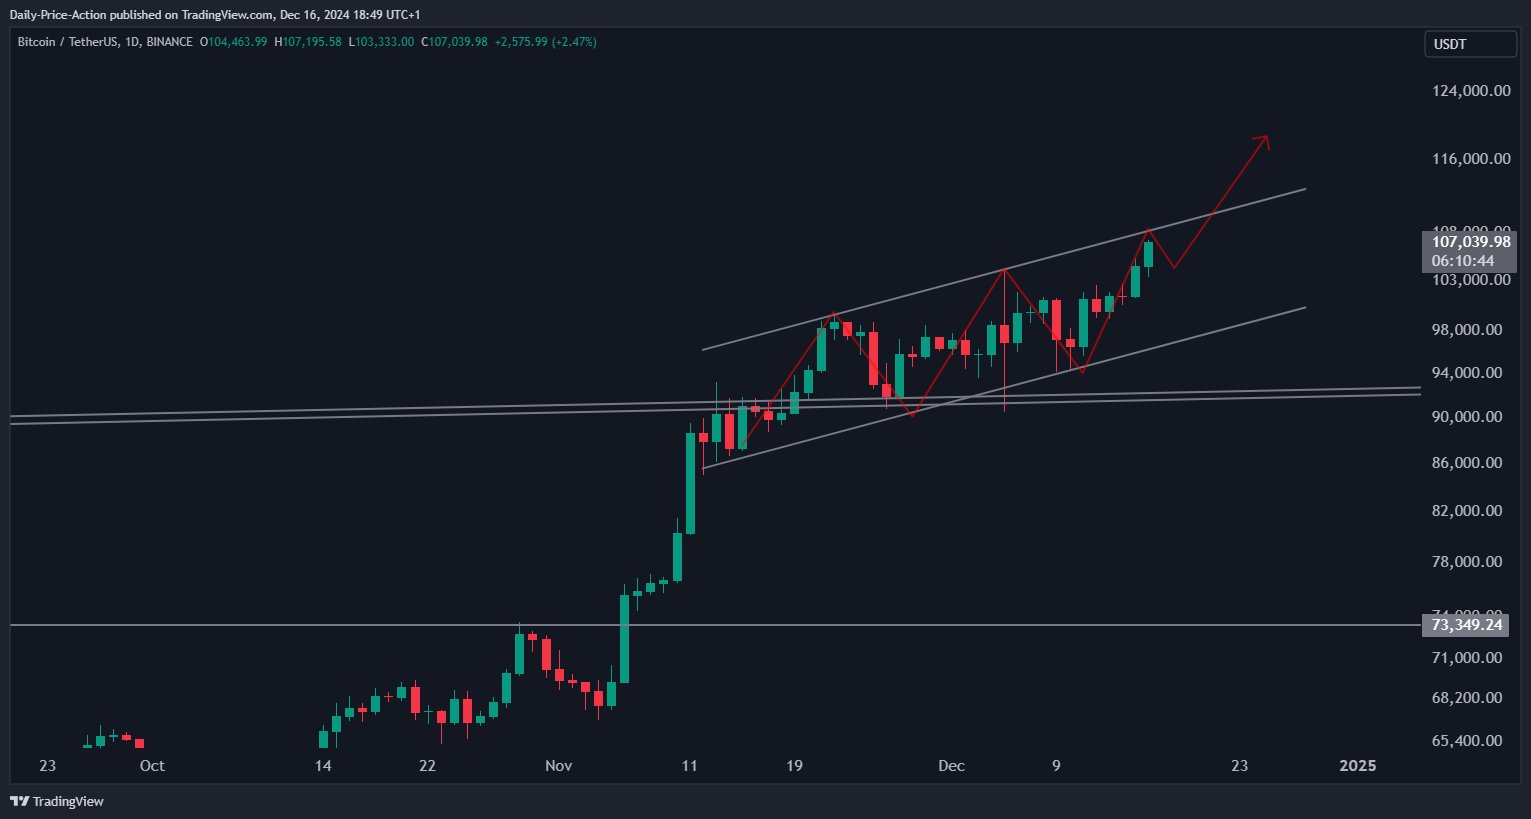
At time of writing, Bitcoin is trading for $106,339.
Don’t Miss a Beat – Subscribe to get email alerts delivered directly to your inbox
Check Price Action
Follow us on X, Facebook and Telegram
Surf The Daily Hodl Mix
 
Disclaimer: Opinions expressed at The Daily Hodl are not investment advice. Investors should do their due diligence before making any high-risk investments in Bitcoin, cryptocurrency or digital assets. Please be advised that your transfers and trades are at your own risk, and any losses you may incur are your responsibility. The Daily Hodl does not recommend the buying or selling of any cryptocurrencies or digital assets, nor is The Daily Hodl an investment advisor. Please note that The Daily Hodl participates in affiliate marketing.
Generated Image: Midjourney
Source link

Ethereum price failed to settle above the $4,000 zone. ETH is correcting gains and might struggle to stay above the $3,820 support zone.
- Ethereum started a downside correction from the $4,100 zone.
- The price is trading below $3,980 and the 100-hourly Simple Moving Average.
- There was a break below a key bullish trend line with support at $3,940 on the hourly chart of ETH/USD (data feed via Kraken).
- The pair could continue to move down if it fails to stay above the $2,820 support zone.
Ethereum Price Fails Again
Ethereum price struggled to stay above the $4,000 level and underperformed Bitcoin. ETH started a fresh decline and traded below the $4,000 support zone.
There was a move below the $3,980 and $3,940 support levels. Besides, there was a break below a key bullish trend line with support at $3,940 on the hourly chart of ETH/USD. The pair even dipped below the $3,850 level. A low was formed at $3,837 and the price is now consolidating losses.
Ethereum price is now trading below $3,920 and the 100-hourly Simple Moving Average. On the upside, the price seems to be facing hurdles near the $3,900 level. It is close to the 23.6% Fib retracement level of the downward move from the $4,107 swing high to the $3,837 low.
The first major resistance is near the $3,970 level or the 50% Fib retracement level of the downward move from the $4,107 swing high to the $3,837 low.

The main resistance is now forming near $4,000. A clear move above the $4,000 resistance might send the price toward the $4,120 resistance. An upside break above the $4,120 resistance might call for more gains in the coming sessions. In the stated case, Ether could rise toward the $4,250 resistance zone or even $4,320.
More Losses In ETH?
If Ethereum fails to clear the $3,900 resistance, it could continue to move down. Initial support on the downside is near the $3,820 level. The first major support sits near the $3,780 zone.
A clear move below the $3,780 support might push the price toward the $3,650 support. Any more losses might send the price toward the $3,550 support level in the near term. The next key support sits at $3,500.
Technical Indicators
Hourly MACD – The MACD for ETH/USD is gaining momentum in the bearish zone.
Hourly RSI – The RSI for ETH/USD is now below the 50 zone.
Major Support Level – $3,820
Major Resistance Level – $3,970
Source link

Most Layer 2 solutions are still struggling with scalability

Here’s why Stellar Price Could Go Parabolic Soon

Perp-Focused HyperLiquid Experiences Record $60M in USDC Net Outflows

Experts say these 3 altcoins will rally 3,000% soon, and XRP isn’t one of them

Robert Kiyosaki Hints At Economic Depression Ahead, What It Means For BTC?

BNB Steadies Above Support: Will Bullish Momentum Return?

Metaplanet makes largest Bitcoin bet, acquires nearly 620 BTC

Tron’s Justin Sun Offloads 50% ETH Holdings, Ethereum Price Crash Imminent?

Investors bet on this $0.0013 token destined to leave Cardano and Shiba Inu behind

End of Altcoin Season? Glassnode Co-Founders Warn Alts in Danger of Lagging Behind After Last Week’s Correction

Can Pi Network Price Triple Before 2024 Ends?

XRP’s $5, $10 goals are trending, but this altcoin with 7,400% potential takes the spotlight

CryptoQuant Hails Binance Reserve Amid High Leverage Trading

Trump Picks Bo Hines to Lead Presidential Crypto Council

The introduction of Hydra could see Cardano surpass Ethereum with 100,000 TPS
182267361726451435
Why Did Trump Change His Mind on Bitcoin?

Top Crypto News Headlines of The Week

New U.S. president must bring clarity to crypto regulation, analyst says

Will XRP Price Defend $0.5 Support If SEC Decides to Appeal?

Bitcoin Open-Source Development Takes The Stage In Nashville

Ethereum, Solana touch key levels as Bitcoin spikes

Bitcoin 20% Surge In 3 Weeks Teases Record-Breaking Potential

Ethereum Crash A Buying Opportunity? This Whale Thinks So

Shiba Inu Price Slips 4% as 3500% Burn Rate Surge Fails to Halt Correction

Washington financial watchdog warns of scam involving fake crypto ‘professors’

‘Hamster Kombat’ Airdrop Delayed as Pre-Market Trading for Telegram Game Expands

Citigroup Executive Steps Down To Explore Crypto
Mostbet Güvenilir Mi – Casino Bonus 2024

NoOnes Bitcoin Philosophy: Everyone Eats

 3 months ago
182267361726451435

 Donald Trump5 months ago
Why Did Trump Change His Mind on Bitcoin?
 24/7 Cryptocurrency News4 months ago
Top Crypto News Headlines of The Week
 News4 months ago
New U.S. president must bring clarity to crypto regulation, analyst says
 Price analysis4 months ago
Will XRP Price Defend $0.5 Support If SEC Decides to Appeal?
 Opinion5 months ago
Bitcoin Open-Source Development Takes The Stage In Nashville
 Bitcoin5 months ago
Ethereum, Solana touch key levels as Bitcoin spikes
 Bitcoin5 months ago
Bitcoin 20% Surge In 3 Weeks Teases Record-Breaking Potential
