
crypto
Expert Analysis Highlights 4 Strong Bullish Indicators

As the new week begins, Ethereum (ETH)—the second-largest cryptocurrency by market capitalization—has seen a significant decline, dropping nearly 10% below the critical support level of $2,500.
However, amidst this downturn, prominent crypto analyst Doctor Profit has identified four compelling bullish indicators that suggest Ethereum may be poised for a resurgence, potentially inching closer to its all-time high and even surpassing it.
Key Indicators Signal A Bullish Turn
In a recent post on X (formerly Twitter), Doctor Profit shared insights from a detailed long-term analysis of Ethereum. He emphasizes that this evaluation is not about short-term hype or quick profits but focuses on the upcoming months.
“Right now, ETH is the best opportunity in the market,” he stated, highlighting key indicators—technical, psychological, and on-chain—that support his bullish stance.
Related Reading
Doctor Profit’s analysis is grounded in extensive price action data, with a focus on high-timeframe signals that typically indicate significant market moves. Here are the four major indicators he outlined:
The 200-week Exponential Moving Average (EMA) has historically served as a critical support level for Ethereum. During past market downturns, such as the COVID crash in 2020 and the bear market in 2022, the price has quickly rebounded after dipping below this key threshold.
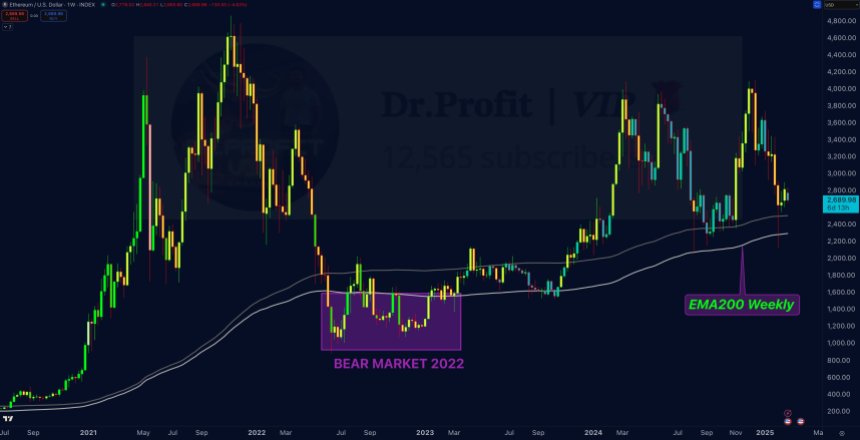
Given that a few weeks ago, the price was merely 4% from this support, the risk-reward ratio for potential investment is compelling. Doctor Profit estimates a possible move toward the $8,000 to $10,000 range, representing an approximate 200% upside, while the worst-case scenario offers a mere 20% downside.
Doctor Profit Sees Potential For Major Ethereum Price Surge
The analyst further highlighted that ETH’s price has been trending within a long-term ascending channel, currently approaching its lower boundary—a historically favorable entry point for investors.
Doctor Profit anticipates a breakout from this channel in the coming months, targeting the $4,000 mark, a level that has faced multiple rejections.
However, the analyst assures that each failed attempt brings the Ethereum price closer to a definitive breakout, with potential targets reaching as high as $8,000 to $10,000.
One of the most significant patterns currently forming is the weekly ascending triangle. This pattern has been consolidating since 2020, indicating a robust bullish setup.
Related Reading
Doctor Profit notes that moves stemming from such patterns often lead to substantial price expansions, similar to recent trends observed in XRP. The implications of this formation suggest that Ethereum may be on the brink of a powerful upward movement.
A substantial liquidity zone exists around the $4,000 region, aligning perfectly with both the anticipated breakout from the ascending channel and the ascending triangle.
This concentration of liquidity could facilitate a strong market response, according to the analyst, propelling Ethereum through this critical threshold and triggering a significant upward movement.
Despite the current bearish sentiment surrounding Ethereum, characterized by retail disinterest and high fear, Doctor Profit emphasizes that institutional accumulation is on the rise.
Record inflows into Ethereum exchange-traded funds (ETFs) and significant on-chain withdrawals further indicate that larger investors are positioning themselves for future gains.
ETH is currently trading at $2,420, down as much as 10% over the past 24 hours and over the past week.
Featured image from DALL-E, chart from TradingView.com
Source link


Altcoins
Helium (HNT) Jumps After SEC Dismisses Lawsuit Against Team Behind the Decentralized Wireless Network

A Solana (SOL)-based decentralized wireless network crypto project is skyrocketing after the U.S. Securities and Exchange Commission (SEC) dismissed its lawsuit against the protocol.
In a new thread on the social media platform X, the development team behind Helium (HNT) says that the regulatory agency has dropped its lawsuit against the crypto platform, which alleged that they violated securities laws.
According to a press release, Helium developer Nova Labs agreed to pay the SEC $200,000 to settle the accusation without admitting to any wrongdoing.
News of the dismissal caused HNT to rally as it went from a low of $2.62 on April 10th to a peak of $3.03 just a day later. It has since retraced and is trading for $2.96, a 9.9% increase during the last 24 hours.
The SEC, which originally filed the lawsuit in January, had accused Nova Labs of distributing unregistered securities.
“The SEC has agreed to dismiss its unregistered securities claims with prejudice. Helium Hotspots and the distribution of HNT, MOBILE, and IOT through the Helium Network are not securities. It also means that the SEC cannot bring these charges against Helium again.”
In a recent blog post, Helium says the dismissal of the case is a “landmark outcome” for the digital assets industry and DePIN (Decentralized Physical Infrastructure Networks) technology, which tokenizes real-world infrastructure.
“This landmark outcome is a pivotal turning point for the Helium community and the entire crypto industry, removing legal uncertainty for DePIN projects that use crypto incentives to build real-world infrastructure.
With the dismissal of the SEC’s unregistered securities claims with prejudice, the outcome establishes that selling hardware and distributing tokens for network growth does not automatically make them securities in the eyes of the SEC.”
This marks another lawsuit dropped by the SEC against crypto giants this year after President Donald Trump took office. Other dissolved cases include ones against the crypto exchanges Kraken and Coinbase, retail trading giant Robinhood, non-fungible token (NFT) marketplace OpenSea, and crypto wallet developer MetaMask.
Follow us on X, Facebook and Telegram
Don’t Miss a Beat – Subscribe to get email alerts delivered directly to your inbox
Check Price Action
Surf The Daily Hodl Mix
 

Disclaimer: Opinions expressed at The Daily Hodl are not investment advice. Investors should do their due diligence before making any high-risk investments in Bitcoin, cryptocurrency or digital assets. Please be advised that your transfers and trades are at your own risk, and any losses you may incur are your responsibility. The Daily Hodl does not recommend the buying or selling of any cryptocurrencies or digital assets, nor is The Daily Hodl an investment advisor. Please note that The Daily Hodl participates in affiliate marketing.
Generated Image: Midjourney
Source link

Sonic token has caught the eye of traders after a powerful bullish move from support. With price now consolidating under key resistance, the next breakout could be just around the corner—here’s what the chart is telling us.
Sonic (S) token has shown some serious momentum lately, catching the attention of traders with a powerful bullish engulfing candle. With price now grinding against key technical levels, the next few moves could be crucial in determining whether we see continuation—or signs of a reversal.
Key points:
- Strong bullish engulfing candle from the value area low and daily support at $0.39
- Price consolidating just under point of control, hinting at vertical accumulation
- $0.52 liquidity target aligns with 0.618 Fibonacci and VWAP resistance

The recent price action on Sonic Token has been notably impulsive, starting with a strong bullish engulfing candle that formed right at the value area low. This region also aligned perfectly with daily support around $0.39, giving the move significant technical weight.
The surge was accompanied by a rising volume profile, confirming buyer interest and demand at that level. Following the push, price now finds itself consolidating near the point of control—typically a sign that the market is building a base, not reversing.
Potential vertical accumulation
If Sonic continues to trade above the point of control, this could signal the presence of vertical accumulation. This kind of price action, characterized by higher lows on the lower time frame within a compact trading range, often leads to further bullish continuation.
One critical area to watch is the resting liquidity around $0.52. This level stands out as an untapped high and a magnet for price, especially with the 0.618 Fibonacci level and VWAP resistance stacked just above it.
Reaching that $0.52 region makes both technical and psychological sense. The theory of liquidity suggests that markets seek out areas of uncollected orders. Once price had taken the lower-side liquidity and bounced hard, the next logical move is to target the highs.
That target also lines up with the value area high of the current range, meaning a tap of that level would complete a full range rotation from low to high. If Sonic starts distributing around that resistance area, that could mark the start of a longer consolidation phase.
Right now, the chart is still showing signs of strength. There are no clear signals of weakness, and vertical accumulation patterns tend to continue until exhaustion. While it’s smart to be cautious near resistance, prematurely shorting Sonic without a clear rejection could be risky. For now, the bulls are in control—and the $0.52 target remains in play until proven otherwise.
Source link

Hyperliquid just pulled off a strong bounce back into its range after faking out to the downside. In this breakdown, we’ll go over what levels matter next, and where price could be heading if momentum continues.
Hyperliquid (HYPE) has recently shown strong signs of a bullish reversal following a deviation below its range low. With a confirmed reclaim and a clean bullish retest, the current price structure suggests that higher prices are on the horizon. As long as the deviation low remains intact, traders should keep a close eye on this setup as it continues to build bullish momentum.
Key Points:
- Price deviated below $9.34 before reclaiming the range — a failed auction signal
- Bullish retest of the range low aligned with the 0.618 Fibonacci retracement
- Current consolidation could lead to a breakout toward $18.50 — the range high

Deviation of the range low
Hyperliquid established a key swing low at $9.34 before quickly reclaiming the previous trading range. This price action formed what is considered a deviation or failed auction, a signal that sellers were unable to push the market lower and were instead trapped beneath the range.
The reclaim was not just emotional but technical, with a precise bullish retest of the range low that aligned perfectly with the 0.618 Fibonacci retracement level — a well-respected area of interest among technical traders.
Following this reclaim, two consecutive bullish engulfing candles confirmed renewed momentum, pushing price back into the point of control the zone where the highest volume has been traded within this range. This shows that market participants are stepping back in with conviction.
Now, price action finds itself consolidating in the middle of the range, forming a textbook bull flag or shallow pullback pattern. If this resolves upward, it could provide a springboard toward the next major resistance zone.
The next upside target lies at $18.50, the top of the range and another 0.618 Fibonacci resistance level. As long as the deviation low at $9.34 holds, this structure remains firmly bullish. However, traders should watch closely: any breakdown below that level could invalidate the setup and spark a downside move.
For now, the bullish scenario remains valid. This setup offers a strong opportunity for short-term swing traders, but only with proper confirmation. Wait for a breakout above local resistance with strong volume support before entering. Patience in such setups often leads to better trade entries and reduced risk exposure.
Source link

This Week in Crypto Games: Gaming Tokens Crash Out, Eve Frontier Opens Up

Commerce Secretary Lutnick walks back tariff relief on electronics

Gold ETF Inflows Hit Three-Year High as PAXG, XAUT Outperform Wider Crypto Market

Israel’s New Study Shows 51% Of Public Is Interested In Adopting CBDC (Digital Shekel) – Is That So?

Solana Price Eyes Breakout Toward $143 As Inverse Head & Shoulders Pattern Takes Shape On 4-hour Chart

Crypto malware silently steals ETH, XRP, SOL from wallets

Binance Executives Met With US Government Officials To Discuss Easing of Regulatory Supervision: Report

Michael Saylor Hints At Another MicroStrategy Bitcoin Purchase, BTC Price To Rally?

From the Crypto Trenches to the Hill: Why Solana Is Making a Big Push in Washington

Bitcoin price tags $86K as Trump tariff relief boosts breakout odds

Where Top VCs Think Crypto x AI Is Headed Next

India’s Leading Bitcoin And Crypto Exchange Unocoin Integrates Lightning

Solana Triggers Long Thesis After Pushing Above $125 – Start Of A Bigger Rally?

Popcat price surges as exchange reserves fall, profit leaders hold

Crypto Analyst Says Bitcoin Back in Business, Calls for BTC Uptrend if One Support Level Holds


 24/7 Cryptocurrency News5 months ago
Arthur Hayes, Murad’s Prediction For Meme Coins, AI & DeFi Coins For 2025

 Bitcoin3 months ago
Expert Sees Bitcoin Dipping To $50K While Bullish Signs Persist

 24/7 Cryptocurrency News3 months ago
Aptos Leverages Chainlink To Enhance Scalability and Data Access

 Bitcoin5 months ago
Bitcoin Could Rally to $80,000 on the Eve of US Elections

 Opinion5 months ago
Crypto’s Big Trump Gamble Is Risky

 Altcoins2 months ago
Sonic Now ‘Golden Standard’ of Layer-2s After Scaling Transactions to 16,000+ per Second, Says Andre Cronje

 Bitcoin5 months ago
Institutional Investors Go All In on Crypto as 57% Plan to Boost Allocations as Bull Run Heats Up, Sygnum Survey Reveals

 Price analysis5 months ago
Ripple-SEC Case Ends, But These 3 Rivals Could Jump 500x
