
Bitcoin
Expert Hints At Even Greater Heights Ahead

The recent presidential election has sent ripples through the cryptocurrency market, with Bitcoin prices reacting positively to Donald Trump’s victory over Kamala Harris.
As Trump prepares to take office for a second term, his ongoing commitment to making the United States the “crypto capital of the world” has ignited bullish sentiment among investors, positioning Bitcoin at the center of his economic proposals.
‘$13 Million Bitcoin Price Target Is Bearish’
Dennis Porter, CEO and co-founder of the Satoshi Action Fund has been vocal about the implications of Trump’s win for Bitcoin and the broader cryptocurrency landscape.
In a series of posts on social media platform X (formerly Twitter), Porter highlighted the potential for Bitcoin to experience significant price discoveries in the coming years. He emphasized that the election outcome signals a substantial shift in the political landscape regarding cryptocurrency.
Porter stated that after the 2024 presidential election, it is “abundantly clear” that Bitcoin is a “winning issue,” claiming that opposing Bitcoin support is “political suicide,” with a forecast that the United States will lead on BTC.
The Satoshi Act Fund CEO believes that as the global community comes to terms with this reality, a “dramatic” acceleration in Bitcoin adoption will follow.
Related Reading
In addition to Trump’s victory, the Republican Party has secured a majority in Congress, further enhancing the prospects for cryptocurrency legislation. Porter noted that over 250 members of Congress are now pro-Bitcoin, which could facilitate a more favorable regulatory environment for the crypto market to thrive.
This newfound political support could lead to legislation clarifying regulations and encouraging innovation and investment in the digital asset sector. It could also pave the way for the approval and introduction of one of Trump’s key promises: to make BTC a strategic reserve asset for the country.
One of Porter’s most striking comments came just 24 hours after the election when he suggested a forecast of $13 million per Bitcoin could be considered bearish. “Expect the unexpected,” he said, hinting at the possibility of even higher valuations for Bitcoin shortly.
Extended Bull Run For BTC?
In an update on social media, market expert Rekt Capital provided insights into BTC’s short-term price action. He highlighted the importance of a weekly candle close above $71,500, which could signal the start of a breakout from the current re-accumulation range.
Rekt Capital notes that Bitcoin has been in a prolonged re-accumulation phase for over 200 days since the last Halving event, which occurred earlier this year in April.
The expert points out that the historical trend suggests bullish sentiment, as Bitcoin’s cycle has dramatically reduced from an average of 260 days to just 13 days in the current post-Halving context.
This reduction in cycle duration indicates that Bitcoin is in a slightly accelerated phase compared to previous cycles. However, the current rate of acceleration is not as steep as earlier in the year, particularly in March 2024, suggesting a stabilizing trend.
Due to this extended consolidation period, Bitcoin has almost completely realigned with historical Halving cycles. Rekt believes this resynchronization could lead to a longer, more robust bull run than anticipated.
Related Reading
In a related analysis, crypto analyst Ali Martinez speculates on the potential timing of the next market peak for Bitcoin. He highlights a historical pattern wherein Bitcoin typically reaches market tops 8 to 12 months after achieving a monthly close above its previous all-time high.
Ali Martinez predicts that the next significant market top for the leading crypto could occur between July and November 2025 if this pattern holds.
At the time of writing, BTC was trading at $75,100.
Featured image from DALL-E, chart from TradingView.com
Source link


Bitcoin
Crypto Trader Unveils Massive Bitcoin Price Target Amid Extended BTC Bull Market – Here’s His Outlook

A widely followed crypto strategist believes that Bitcoin (BTC) can take the path of higher for longer this market cycle.
Pseudonymous analyst Jack tells his 268,200 followers on the social media platform X that he thinks Bitcoin will not print a new all-time high this year after US President Donald Trump instigated a global trade war and created uncertain market conditions.
The trader shares a chart suggesting that Bitcoin will create a durable bottom between $66,000 and $80,000 for the rest of the year before launching a new bull run in 2026.
“Trump path clearly is contraction for now.
But in that world of less globalization and trust, Bitcoin is a good asset to have, becoming a ball held under water.
Similar to how 2013 saw a short bear [market].”
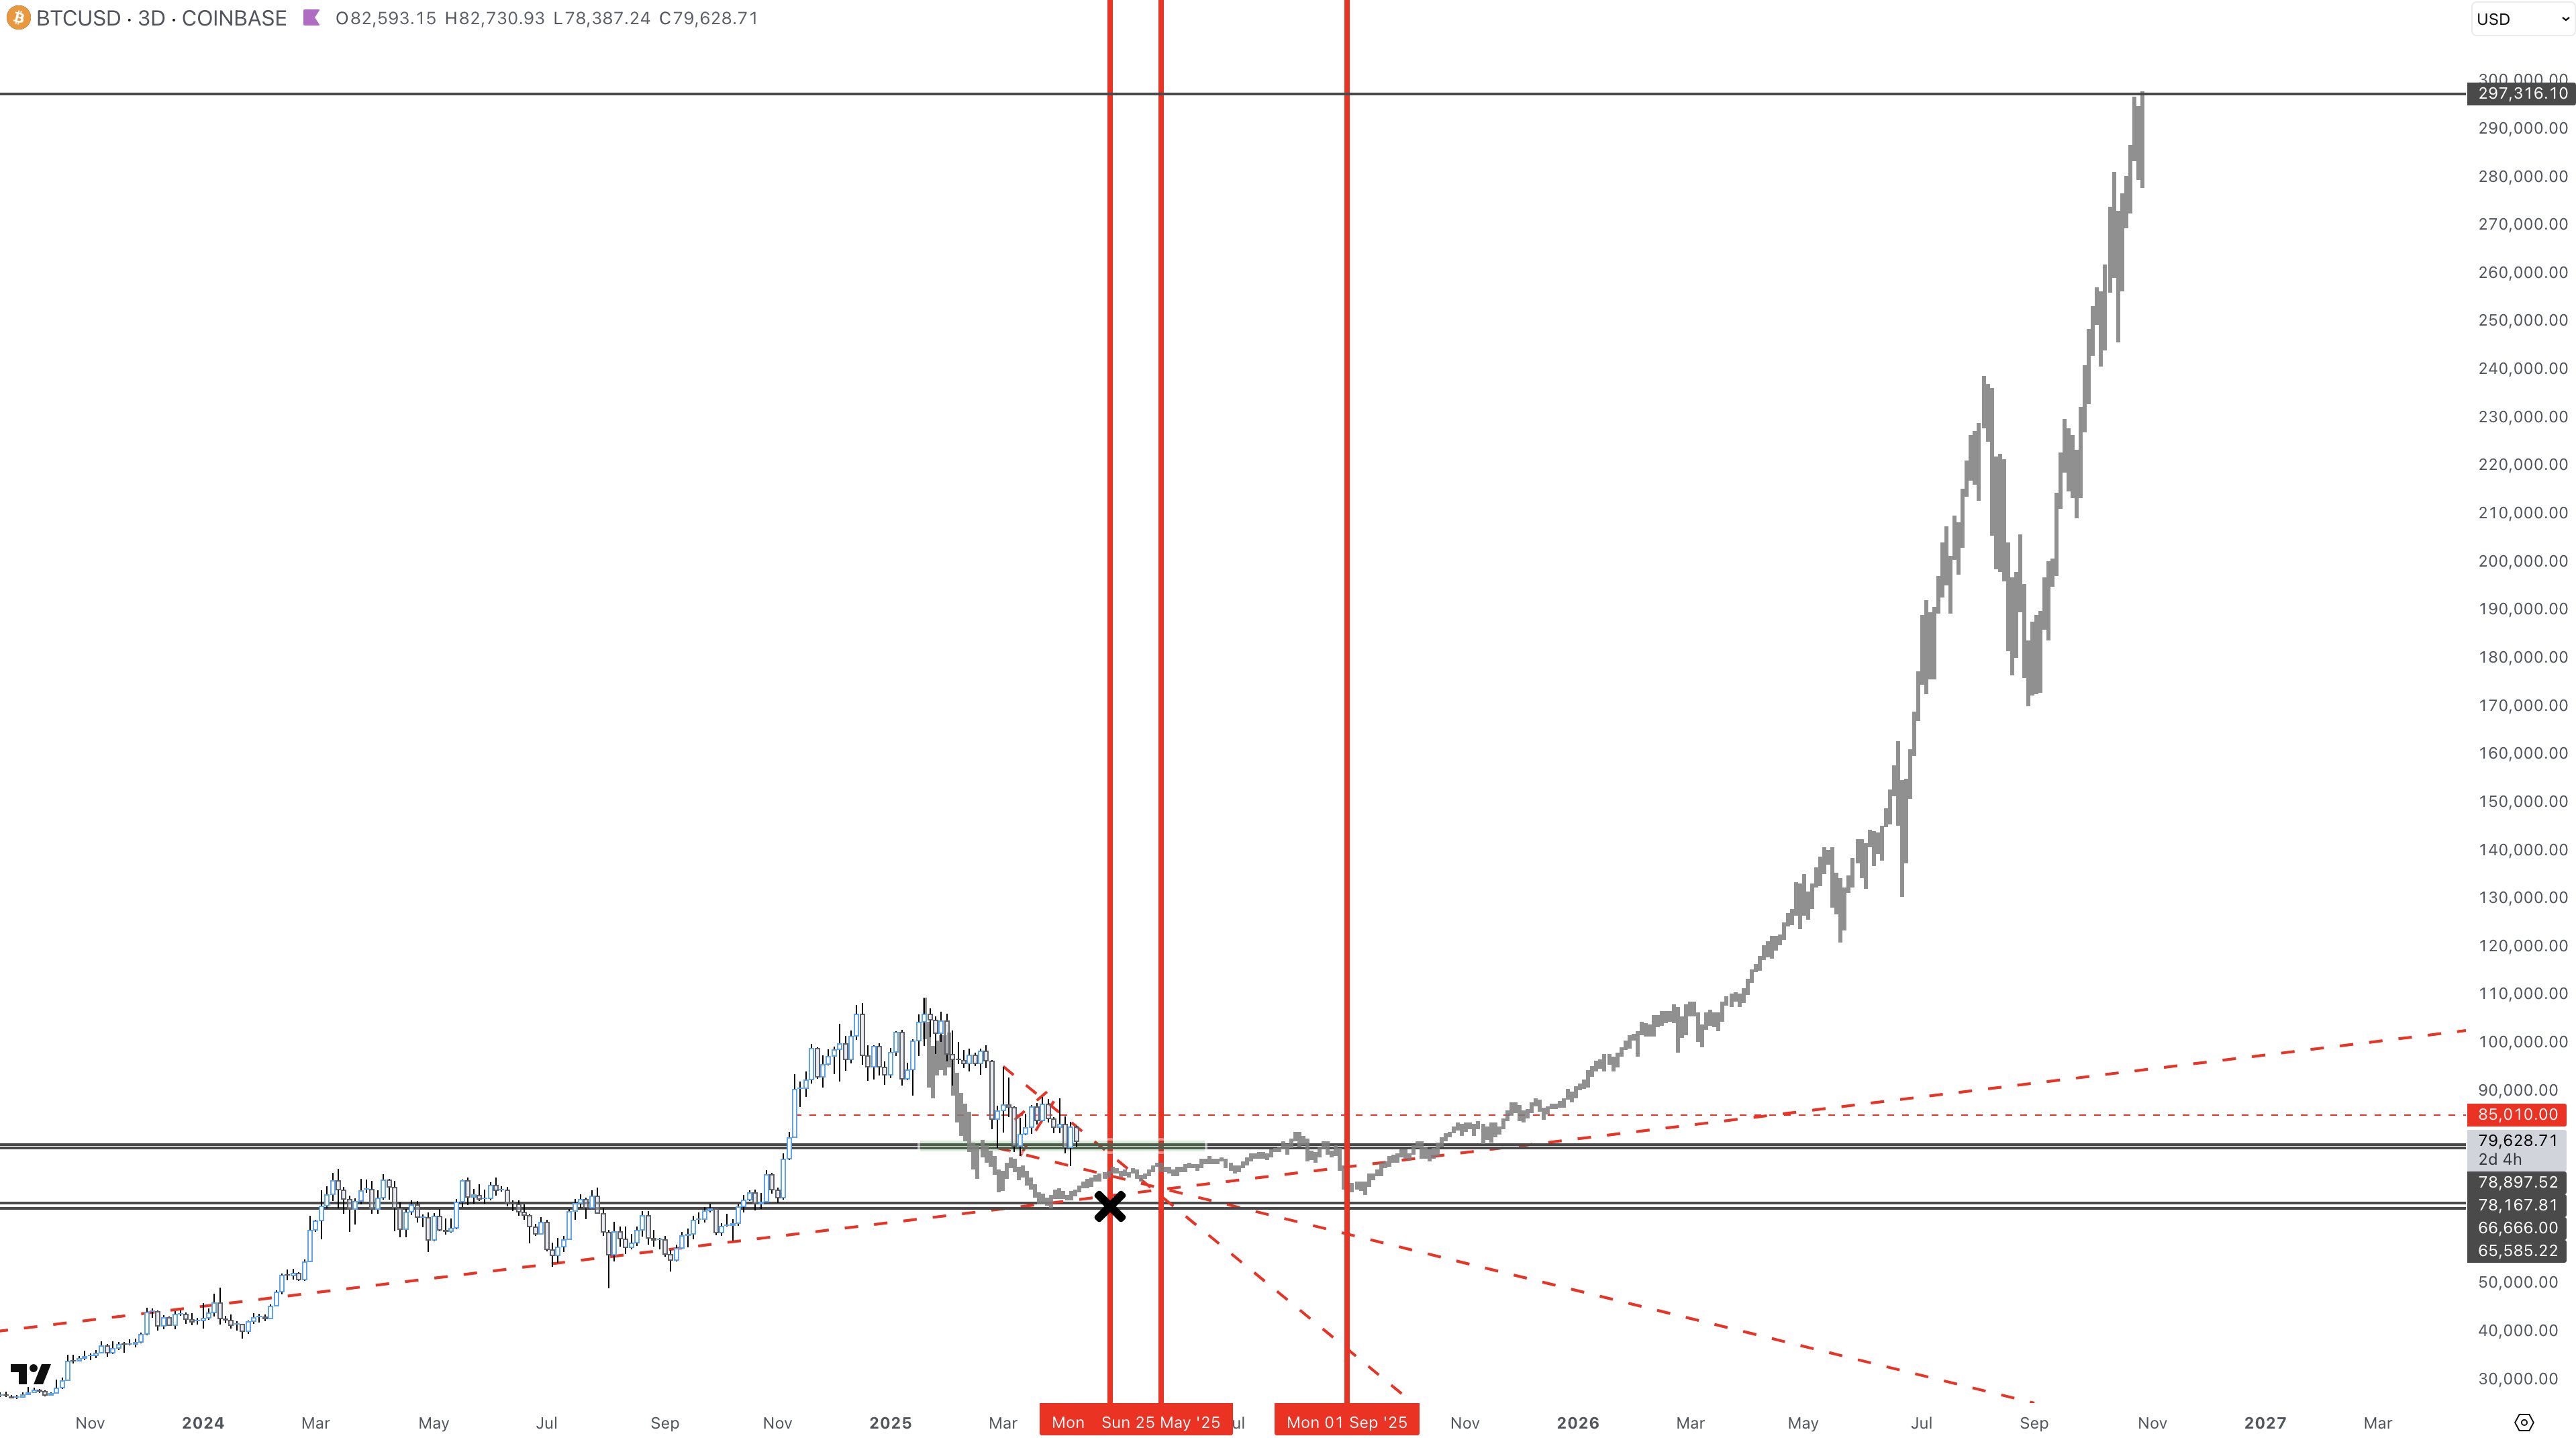
Looking at the trader’s chart, he appears to suggest that Bitcoin will rally to as high as $297,000 by November of 2026.
Jack says that one catalyst that could send Bitcoin flying is the potential capital rotation from gold to BTC. According to the trader, gold investors will eventually come to know that Bitcoin is far better than the precious metal as a safe-haven asset.
“What if Gold is trading like it is because everyone is scrambling to redeem paper for physical, of which there is a scarcity, vs. all the paper that has been issued, essentially catching up to its true value that has been diluted with paper
Bitcoin doesn’t have this issue and will rally once people realize it is the better alternative for trade due to this very specific property.”
“Paper” gold refers to financial instruments that allow investors to gain exposure to the precious metal without having to deal with the expenses or logistics of physically possessing the commodity. Jack appears to be highlighting Bitcoin’s portability as BTC holders can easily store, access and transfer their coins as long as they have the keys to their wallet.
At time of writing, Bitcoin is trading for $84,244.
Follow us on X, Facebook and Telegram
Don’t Miss a Beat – Subscribe to get email alerts delivered directly to your inbox
Check Price Action
Surf The Daily Hodl Mix
 

Disclaimer: Opinions expressed at The Daily Hodl are not investment advice. Investors should do their due diligence before making any high-risk investments in Bitcoin, cryptocurrency or digital assets. Please be advised that your transfers and trades are at your own risk, and any losses you may incur are your responsibility. The Daily Hodl does not recommend the buying or selling of any cryptocurrencies or digital assets, nor is The Daily Hodl an investment advisor. Please note that The Daily Hodl participates in affiliate marketing.
Generated Image: Midjourney
Source link

Bitcoin (BTC) proponent Michael Saylor has hinted the company he co-founded, Strategy (MSTR), may be set to announce an additional BTC purchase this week shortly after revealing it expects a net loss in the first quarter of the year over unrealized losses on its massive BTC holdings.
The company has added 80,785 BTC to its balance sheet since the beginning of the year after raising a total of $7.69 billion during the first quarter, with over half of that coming from common stock sales. Most, if not all, of those funds were used to buy bitcoin.
On Sunday, Saylor posted a BTC holdings tracker to X, a move that typically precedes a purchase announcement, commenting there are “no tariffs on orange dots.” The comment implies the company’s BTC purchases were unaffected by the reciprocal tariffs Donald Trump introduced earlier this month and the ensuing U.S.-China trade war.
The company paused its buying during the week ending April 6. Its crypto stash is currently worth roughly $44.59 billion, and was acquired for $35.63 billion.
Strategy currently holds 528,185 BTC bought at an average price of $67,458 according to Bitcointreasuries data equivalent to 2.515% of the cryptocurrency’s total supply.
Source link
ALCH
Crypto Strategist Sees Solana-Based Memecoin Surging Higher, Says One AI Altcoin Flashing Strong Chart
A closely followed crypto analyst believes one meme token operating on Solana (SOL) is in the early stages of a market recovery.
Pseudonymous analyst Altcoin Sherpa tells his 243,800 followers on the social media platform X that he’s bullish on the memecoin Bonk (BONK).
The trader shares a chart suggesting that BONK will face resistance at the $0.000012 level before printing a bullish higher low setup and rallying to his target above $0.0000145.
“BONK is looking strong in the short term, and should go higher. Should be a pullback around the 200 EMA (exponential moving average) on the four-hour chart but still, I think this has pulled back enough to where any buying down here is probably reasonable.”
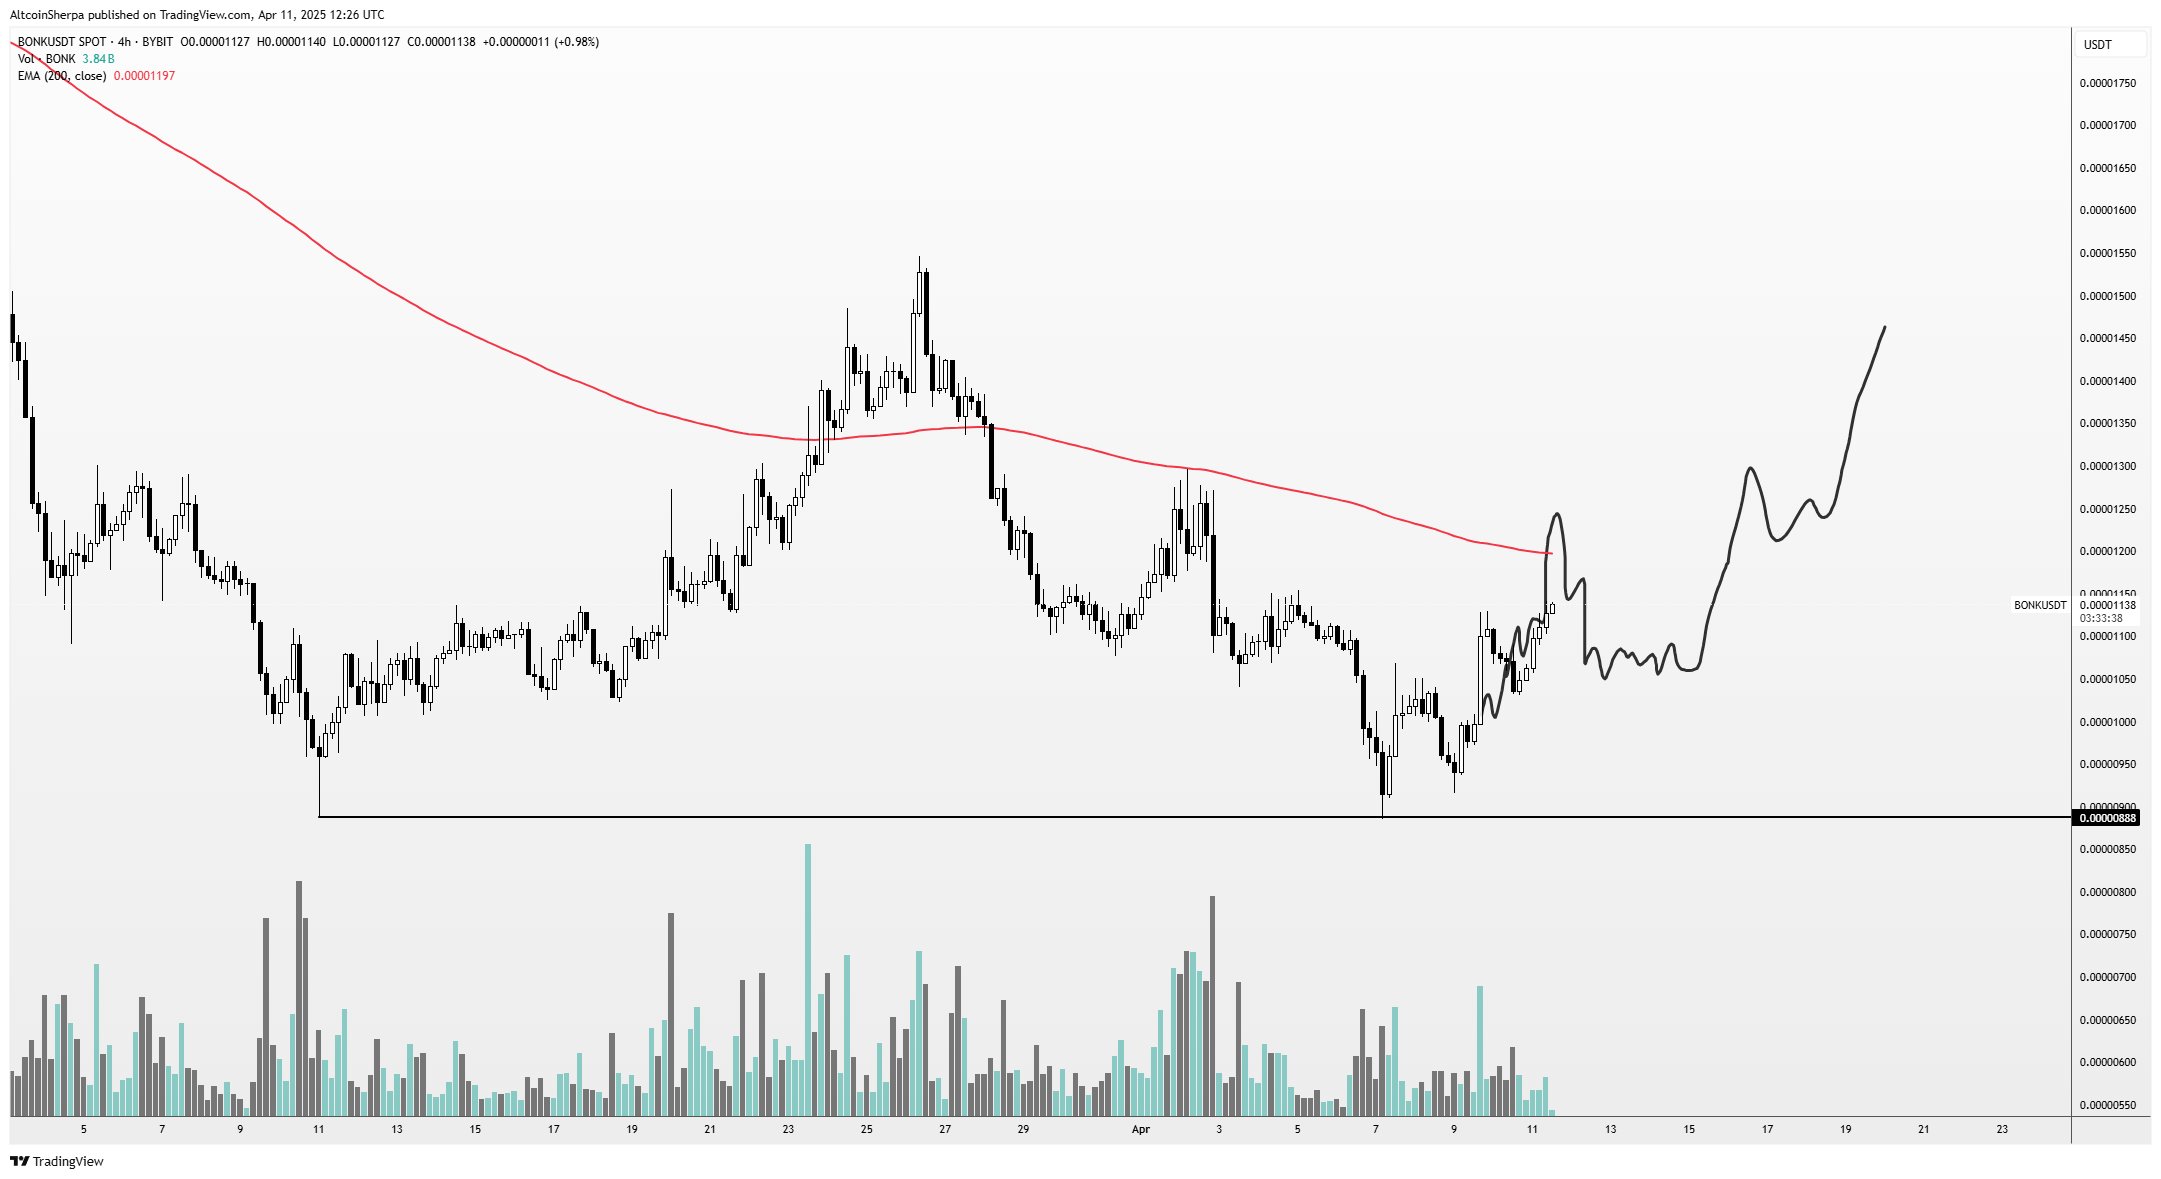
At time of writing, BONK is worth $0.00001376.
Turning to the low-cap altcoin Alchemist AI (ALCH), the analyst says the coin appears to be in an uptrend and that he’s waiting for potential dips to accumulate the asset.
ALCH is an artificial intelligence (AI)-based crypto project that allows users with no coding skills to generate codes by providing natural language descriptions.
Says Altcoin Sherpa,
“ALCH still seems like a really strong chart, don’t see it being mentioned much. I think it’s basically taken the place of ARC; a super volatile AI coin that moves 20% a day. Not in it but traded it a lot before; will look to buy dips.”
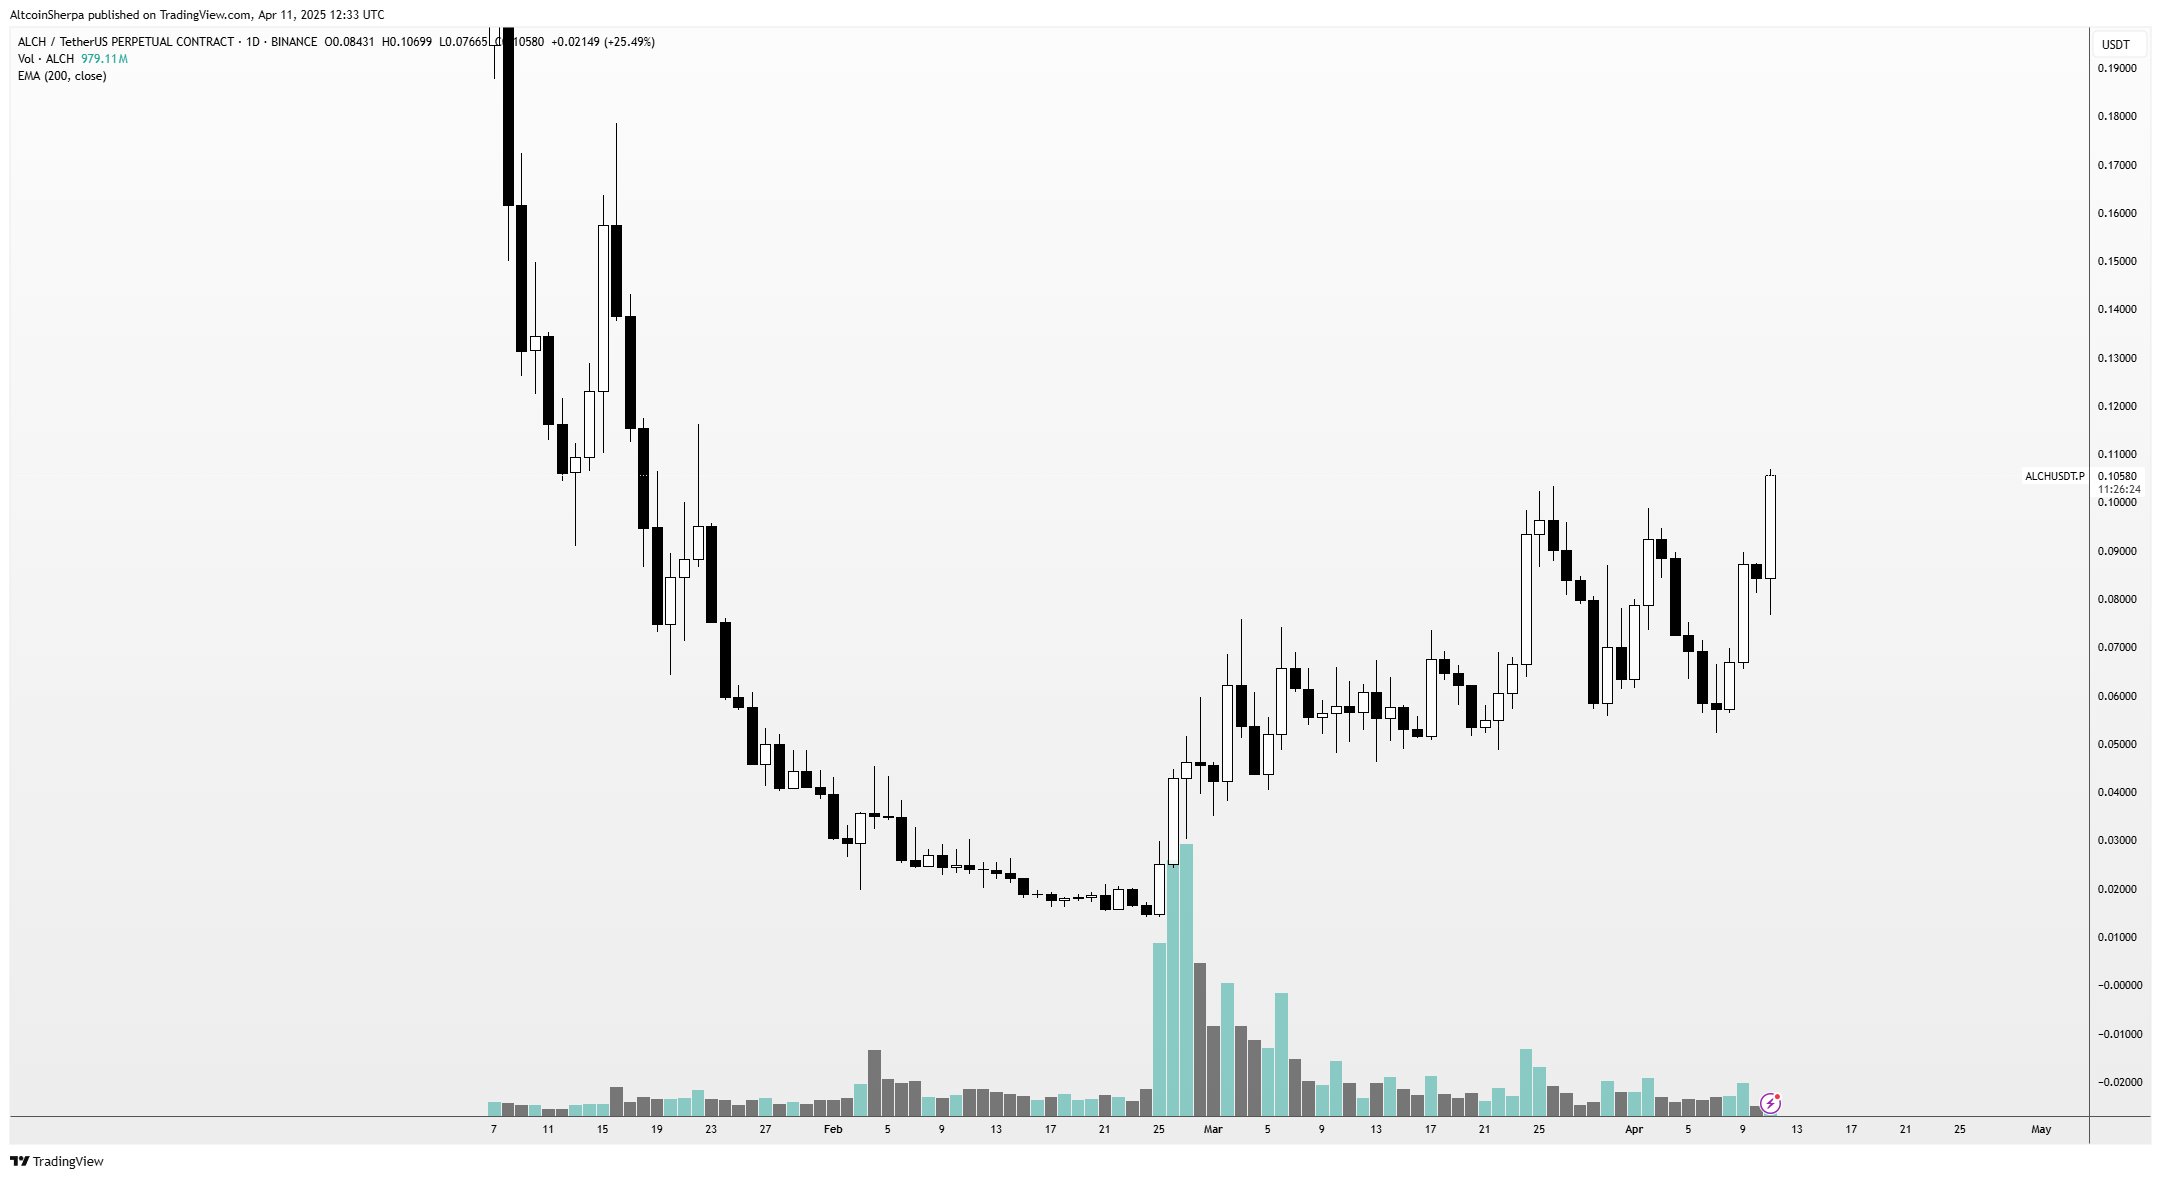
At time of writing, ALCH is the 431st-largest crypto asset by market cap, trading at $0.109.
Looking at Bitcoin, Altcoin Sherpa thinks that BTC will continue to consolidate within a large trading range in the short to mid-term.
“Expecting there is some sort of chop between $70,000-$90,000 over the next several weeks for BTC. Relative bottom probably in, but still some more consolidation to come.”

At time of writing, Bitcoin is trading for $85,366.
Follow us on X, Facebook and Telegram
Don’t Miss a Beat – Subscribe to get email alerts delivered directly to your inbox
Check Price Action
Surf The Daily Hodl Mix
 
Disclaimer: Opinions expressed at The Daily Hodl are not investment advice. Investors should do their due diligence before making any high-risk investments in Bitcoin, cryptocurrency or digital assets. Please be advised that your transfers and trades are at your own risk, and any losses you may incur are your responsibility. The Daily Hodl does not recommend the buying or selling of any cryptocurrencies or digital assets, nor is The Daily Hodl an investment advisor. Please note that The Daily Hodl participates in affiliate marketing.
Generated Image: DALLE3
Source link

Crypto Trader Unveils Massive Bitcoin Price Target Amid Extended BTC Bull Market – Here’s His Outlook

Is it possible to make $1m with crypto?

Japan’s Metaplanet Buys Another $26M in Bitcoin Amid Tariff Market Uncertainty

Has Ethereum Price Bottomed? 3 Reason Why ETH Could Crash More
Michael Saylor Teases New Bitcoin Buy After Strategy’s $7.69 Billion Q1 BTC Buying Spree

Crypto markets ‘relatively orderly’ despite Trump tariff chaos: NYDIG

Fartcoin ‘Hot Air Rises’ — $1.50 Just A Whiff Away
What happened to the RWA token?

Crypto Strategist Sees Solana-Based Memecoin Surging Higher, Says One AI Altcoin Flashing Strong Chart

Mantra Team Responds As The OM Token Price Crashes Over 80% In 24 Hours

This Week in Crypto Games: Gaming Tokens Crash Out, Eve Frontier Opens Up

Commerce Secretary Lutnick walks back tariff relief on electronics

Gold ETF Inflows Hit Three-Year High as PAXG, XAUT Outperform Wider Crypto Market

Israel’s New Study Shows 51% Of Public Is Interested In Adopting CBDC (Digital Shekel) – Is That So?

Solana Price Eyes Breakout Toward $143 As Inverse Head & Shoulders Pattern Takes Shape On 4-hour Chart


 24/7 Cryptocurrency News5 months ago
Arthur Hayes, Murad’s Prediction For Meme Coins, AI & DeFi Coins For 2025

 Bitcoin3 months ago
Expert Sees Bitcoin Dipping To $50K While Bullish Signs Persist

 24/7 Cryptocurrency News3 months ago
Aptos Leverages Chainlink To Enhance Scalability and Data Access

 Bitcoin5 months ago
Bitcoin Could Rally to $80,000 on the Eve of US Elections

 Opinion5 months ago
Crypto’s Big Trump Gamble Is Risky

 Bitcoin5 months ago
Institutional Investors Go All In on Crypto as 57% Plan to Boost Allocations as Bull Run Heats Up, Sygnum Survey Reveals

 Altcoins2 months ago
Sonic Now ‘Golden Standard’ of Layer-2s After Scaling Transactions to 16,000+ per Second, Says Andre Cronje

 Price analysis5 months ago
Ripple-SEC Case Ends, But These 3 Rivals Could Jump 500x
