
crypto traders
Helium’s 158% rally may be nearing a turning point

Helium (HNT) has gained 158.15% since the beginning of July, showing a strong upward trend. The key question now is whether HNT will continue its climb or if there will be a pullback on the horizon.
While Helium’s (HNT) bullish run has been exciting, it may soon turn into a disappointment for investors. The lack of consolidation or pullback during this rally raises concerns that one might be on the horizon. Here’s why a pullback could be imminent.

Moving Average Convergence Divergence
Examining the daily Moving Average Convergence Divergence (MACD), we notice the histogram shifting from dark green to light green, indicating a weakening bullish momentum. The MACD lines are also beginning to converge, suggesting that the current uptrend may be losing steam. A potential bearish crossover could signal a reversal in trend.

RSI and Stochastic RSI
Both the Relative Strength Index (RSI) and Stochastic RSI are in overvalued territory, with readings above 60. Historically, when RSI and Stochastic RSI have reached 60+ levels, they tend to retreat significantly, often accompanied by a sharp price decline.


Support and resistance levels
The current price action shows strong resistance levels at $8.5 and $10. These levels have proven difficult to surpass or acted as strong support levels in the past. Meanwhile, the $7 level serves as a weak area. Currently, it has acted as resistance, but its role could change if HNT breaks above it. If the price fails to break through $7, a more pronounced downtrend is likely to begin.

Fibonacci confluence levels
By applying Fibonacci retracement levels from three different time frames—the initial day of trading to the recent high, the low of June to the recent high, and the high of March to the low of June—we identify multiple confluence levels. These confluence levels are clustered around $6 and $4.7.

The area between $4.7 and $6 forms what we refer to as a “box of opportunity.” This range presents a potential target zone for a short position, with the expectation that HNT could retrace this area if the downtrend continues.

Historical support lies at $3, but a drop to this level seems unlikely unless significant negative events occur in the broader market, similar to what happened with Japan’s surprise rate hike and Jump Trading’s selling spree in late July and early August.
Strategic Considerations
Before initiating a short position, it’s important to confirm the downtrend. Although the trend has recently shifted, there’s always the possibility of a bear trap. To minimize risk, we recommend waiting for HNT to fall below $6.3958, which is the 23.6% Fibonacci retracement from the June low to the August high. Once HNT breaks below this level, and it acts as resistance, the shorting opportunity becomes much safer.

Another factor to consider is the Visible Range Volume Profile, which shows a weak volume area between $5.5 and $6.5. Prices tend to move quickly through such low-volume zones, further supporting the likelihood of a downward move. However, currently, HNT is within a high-volume zone, which could potentially serve as a consolidation area.
Disclosure: This article does not represent investment advice. The content and materials featured on this page are for educational purposes only.
Source link


Arca and BlockTower, two leading firms in digital asset management, announced their plans to merge in an all-equity deal.
Per a joint press release, the merger will create a combined entity that delivers regulated, institutional-grade crypto investment products to a growing market. The two firms have signed a Letter of Intent and plan to consolidate their operations under one brand.
BlockTower’s venture capital unit will remain independent.
The merger addresses the increasing demand for digital assets within a regulated investment environment. Rayne Steinberg, CEO at Arca, noted via the press release that uniting the firms will enable them to provide products that adhere to regulatory standards, a priority for investors seeking more secure ways to access digital assets.
Financial institutions are embracing crypto
Digital asset management involves overseeing investments in cryptocurrencies and blockchain-related assets, offering opportunities for both individual and institutional investors to explore this emerging sector.
Companies like Arca and BlockTower offer specialized funds in this area, managed by people with solid Wall Street backgrounds.
By teaming up and pooling their resources, these firms aim to create stronger products and navigate the ever-evolving world of crypto with confidence.
“Competing in the maturing digital assets space and serving our investors requires a constant fight for top talent. By merging with Arca, we’re excited to create a stronger investment team immediately.”
Ari Paul, Co-Founder and Chief Investment Officer at BlockTower
Once the merger is finalized, the unified firm will focus on delivering investment options that blend the growth potential of digital assets with the security of institutional-grade standards.
Source link

Popcat and Dogs are the two top-gaining tokens in the 100 largest cryptocurrencies by market cap as Bitcoin price climbs back above $56,000.
The meme coins Popcat (POPCAT) and Dogs (DOGS) traded at $0.62 and $0.0011, with 19% and 16% in 24-hour gains respectively at the time of writing. Upside momentum meanwhile had pushed Bitcoin (BTC) price above $56,500 as bulls fought to recover from the dip that saw the leading digital asset trade near $53,300 on Sept. 7.
Futures listing helps POPCAT, DOGS higher
Most meme coins have struggled for upward momentum in recent weeks, mainly as the broader market experienced downward pressure throughout August.
However, like many other small cap tokens, Solana(SOL)-based Popcat and Telegram-related Dogs have benefited from a rush of positive sentiment following crucial futures trading support across major exchanges..
Binance recently added POPCAT perpetual contracts, allowing traders to bet on the meme coin’s price. This move caused Popcat’s price to spike significantly. OKX also added POPCAT futures and outlined a trading contest that offers up to $100 in rewards.
DOGS, which slipped amid the recent arrest of Telegram CEO Pavel Durov, has recovered some of the losses since falling to $0.0009 on Sept. 8. Previously, the Telegram-native meme coin had rallied thanks to Binance’s offering of 40 million DOGS in a contest that ends on Sept. 17.
Binance, OKX, and Bybit are some of the top exchanges supporting the DOGS airdrop and token listing.
Bitcoin recovers above $56k
Bitcoin’s recovery to above $56,500 comes amid a bounce in the Coinbase Premium Index, a metric indicating increased whale and institutional accumulation of BTC.
A rebound in U.S. demand may help bulls reposition for a stronger end to the fourth quarter. Analysts at CryptoQuant see the continued accumulation by long-term holders as key to a potential price bounce.
Bernstein analysts issued a note on Sept. 9 predicting a surge to $80k-$90k for BTC if Donald Trump wins the U.S. presidential election.
However, they suggested that a win for Kamala Harris could trigger downside action, potentially pushing BTC to lows of $30,000. The contrast is rooted in the crypto industry’s perception of Trump as more crypto-friendly compared to Harris.
Source link

Cardano dropped 57% when the Federal Reserve cut rates back in 2019. With another rate cut on the horizon, the cryptocurrency faces a similar setup that could bring major downside.
Cardano prepares for September decline
In May 2019, the Federal Reserve initiated its first rate cut, lowering rates from 2.42% to 2.39%. Rates at that time were much lower than today, and the public debt stood at $22 trillion. Today, debt has increased to nearly $35 trillion, and interest rates now stand at 5.33%, more than double the 2019 levels.

When the rates started to fall in 2019, Cardano experienced a sudden drop. After a brief period of recovery, the downtrend continued for months until early 2020. An uptrend emerged later, but the market downturn during the COVID-19 pandemic coincided with further rate cuts. Despite uncertainties around the exact link between rate cuts and crypto declines, Cardano and the broader market saw a clear decrease in value.

A similar scenario could unfold today. Crypto has shown correlations with traditional finance in the past, including during the 2019 rate cut. The Federal Reserve’s upcoming meeting is likely to result in a rate cut based on CME data. If the market follows the 2019 pattern, Cardano could face a multi-month decline, which could last until the end of the year, before recovering in early 2025. A repeat of the previous trend could push Cardano’s price down to around $0.15.

Additionally, September has often proven to be a tough month for both stocks and crypto. In September 2020, during a halving year, Cardano also faced a downtrend. Coupled with the current 10% drop since the start of this month, these factors could drive Cardano toward a deeper fall in the weeks and months ahead below its 2022 support line at $0.2349.

Cardano’s bearish momentum grows with SRSI, MACD, and VRVP
Many traders focus on short-term movements, but stepping back for a longer-term view can give a better sense of the bigger picture. Cardano’s monthly Stochastic RSI (SRSI) and MACD are flashing warning signs that shouldn’t be ignored, and both are painting a rough picture for ADA.
The SRSI tracks momentum by looking at an asset’s price range over time. The scale goes from 0 to 100, with anything below 20 showing oversold conditions. Since March 2024, the SRSI has been sliding, and it’s now closing in on that oversold region.

The MACD, meanwhile, is showing similar bearish vibes. On the monthly chart, the MACD line has already crossed below the signal line, which is a sign of downward pressure. The histogram, which shows the gap between the two lines, is about to flip red, also pointing to a growing bearish momentum.

Alongside the bearish signals from the Stochastic RSI and MACD, the Visible Range Volume Profile (VRVP) adds even more negative pressure to the outlook. The VRVP shows where most trading volumes occurred at various price levels. In Cardano’s case, the volume bars within the current price range are quite thin, which indicates weak support. The biggest volume bar begins at the $0.15 level, suggesting a strong support zone there. Below the current price, there’s a gap in the volume profile, which means if Cardano continues to fall, there’s little trading activity to slow down the drop until it reaches that $0.15 zone.

Is Cardano’s 2022 support line strong enough to hold?
Despite the bearish indicators, a couple of factors could prevent Cardano from dropping sharply. At the moment, the price sits within a macro Fibonacci golden pocket, drawn from the all-time low to the recent high in March 2024. This zone, between $0.2951 and $0.3204, has acted as support for now. However, when looking at other Fibonacci retracements from different points, ADA has already fallen below the 78.6% retracement on every one of them. This could raise doubts about the strength of the current golden pocket, as there’s a possibility it may not hold up in the long term.

A stronger support level, however, lies at $0.2349, a line that was respected during the 2022 bear market. But, with ADA currently around $0.315, a drop to that support would still represent a 25% decline, which would be far from ideal.
Strategic considerations
In our view, there could be a dead cat bounce before the September 18 Fed meeting. However, after that, ADA is likely to face a 2-3 month downtrend until the Fed slows the pace of its rate cuts. A more cautious strategy would be to wait for ADA to drop below the $0.2951 golden pocket before shorting. This offers a safer entry point compared to shorting immediately right now, as Cardano could see a short-term uptrend while holding above the golden pocket. If the price falls below this level, shorting down to $0.2349 becomes a more calculated move.
Disclosure: This article does not represent investment advice. The content and materials featured on this page are for educational purposes only.
Source link

Most Layer 2 solutions are still struggling with scalability

Here’s why Stellar Price Could Go Parabolic Soon

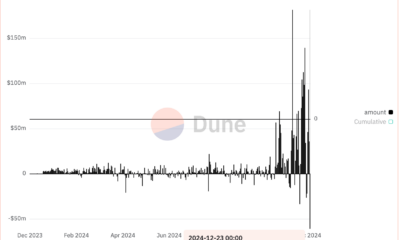
Perp-Focused HyperLiquid Experiences Record $60M in USDC Net Outflows

Experts say these 3 altcoins will rally 3,000% soon, and XRP isn’t one of them

Robert Kiyosaki Hints At Economic Depression Ahead, What It Means For BTC?

BNB Steadies Above Support: Will Bullish Momentum Return?

Metaplanet makes largest Bitcoin bet, acquires nearly 620 BTC

Tron’s Justin Sun Offloads 50% ETH Holdings, Ethereum Price Crash Imminent?

Investors bet on this $0.0013 token destined to leave Cardano and Shiba Inu behind

End of Altcoin Season? Glassnode Co-Founders Warn Alts in Danger of Lagging Behind After Last Week’s Correction

Can Pi Network Price Triple Before 2024 Ends?

XRP’s $5, $10 goals are trending, but this altcoin with 7,400% potential takes the spotlight

CryptoQuant Hails Binance Reserve Amid High Leverage Trading

Trump Picks Bo Hines to Lead Presidential Crypto Council

The introduction of Hydra could see Cardano surpass Ethereum with 100,000 TPS
182267361726451435
Why Did Trump Change His Mind on Bitcoin?

Top Crypto News Headlines of The Week

New U.S. president must bring clarity to crypto regulation, analyst says

Will XRP Price Defend $0.5 Support If SEC Decides to Appeal?

Bitcoin Open-Source Development Takes The Stage In Nashville

Ethereum, Solana touch key levels as Bitcoin spikes

Bitcoin 20% Surge In 3 Weeks Teases Record-Breaking Potential

Ethereum Crash A Buying Opportunity? This Whale Thinks So

Shiba Inu Price Slips 4% as 3500% Burn Rate Surge Fails to Halt Correction

Washington financial watchdog warns of scam involving fake crypto ‘professors’

‘Hamster Kombat’ Airdrop Delayed as Pre-Market Trading for Telegram Game Expands

Citigroup Executive Steps Down To Explore Crypto
Mostbet Güvenilir Mi – Casino Bonus 2024

NoOnes Bitcoin Philosophy: Everyone Eats

 3 months ago
182267361726451435

 Donald Trump5 months ago
Why Did Trump Change His Mind on Bitcoin?
 24/7 Cryptocurrency News4 months ago
Top Crypto News Headlines of The Week
 News4 months ago
New U.S. president must bring clarity to crypto regulation, analyst says
 Price analysis4 months ago
Will XRP Price Defend $0.5 Support If SEC Decides to Appeal?
 Opinion5 months ago
Bitcoin Open-Source Development Takes The Stage In Nashville
 Bitcoin5 months ago
Ethereum, Solana touch key levels as Bitcoin spikes
 Bitcoin5 months ago
Bitcoin 20% Surge In 3 Weeks Teases Record-Breaking Potential
