
Relative Strength Index
Here Are Potential Bullish Turnaround Points

SUI is experiencing a notable pullback after its recent rally, with multiple key support levels coming into focus. As the price edges lower, these areas will play a pivotal role in determining whether the asset can regain its bullish momentum. A strong defense of these supports could signal the start of a fresh upward move, while a failure to hold may lead to deeper declines.
This article aims to assess SUI’s recent price pullback and explore critical support levels that could trigger a potential bullish reversal. By analyzing technical indicators and market conditions, it seeks to provide insights into possible recovery scenarios, highlighting the levels to watch for a sustained upward movement or further downside risk.
Recent Price Action: SUI’s Decline Explained
Recently, SUI’s price has taken a bearish turn on the 4-hour chart, following a rejection at the $2.1 resistance level. Despite this decline, the cryptocurrency remains above the 100-day Simple Moving Average (SMA), indicating that a recovery may be possible, provided buyers regain control and the market shifts back in favor of the bulls.
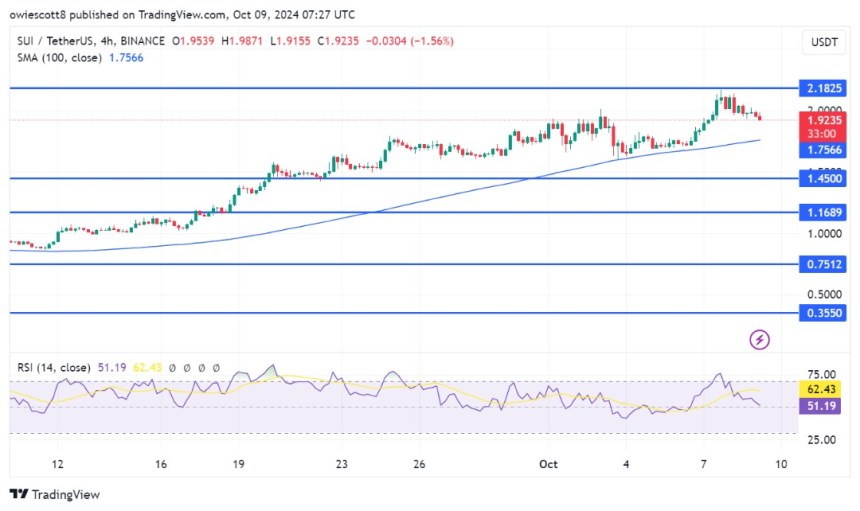
An analysis of the 4-hour Relative Strength Index (RSI) suggests that bulls could be preparing for a resurgence. Although the RSI has slipped to 55% from the overbought zone, it remains above the crucial 50% mark, indicating that bullish momentum persists. This positioning reflects a temporary slowdown, but as long as the RSI holds above this threshold, the market retains the potential for renewed upward movement.
Related Reading
Also, on the daily chart, SUI is exhibiting signs of negative pressure, trading above the 100-day SMA. While the price remains above the SMA, this current bearish movement could be short-lived, as there remains a possibility for a price recovery. The positioning above the SMA implies that buyers could step in to reverse the trend if they regain control, potentially leading to a rebound in price.
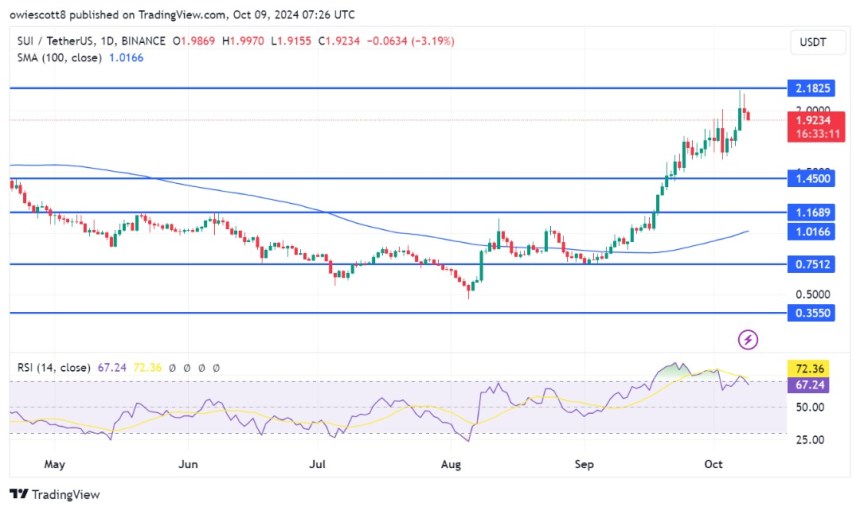
Finally, on the 1-day chart, a closer examination of the RSI formation indicates that SUI’s price may experience further declines, as the signal line has descended to 69% from the overbought territory. However, there is the possibility of a bullish comeback if the RSI can maintain its position above the 50% threshold.
Key Support Levels: Where Could SUI Buyers Step In?
SUI is approaching critical support levels that could attract buyers and trigger a recovery. The initial key level to monitor is the $1.4 support zone, which could serve as a critical point for renewed bullish interest.
Related Reading
Should buyers step in at this level, SUI might rebound toward the $2.1 resistance mark. A successful breakout above this resistance could pave the way for the formation of a new all-time high, signaling a strong resurgence.
However, if the $1.4 support level fails, the next critical area to watch is around the $1.1 mark, where a stronger base of support could form as the price continues to decline. Maintaining these levels is crucial since it will determine whether SUI can regain upward momentum or remain vulnerable to more bearish pressure.
Featured image from YouTube, chart from Tradingview.com
Source link


Toncoin has entered a period of consolidation, with its price moving within a narrow range of $6.2 and $6.5 as the market weighs its next move. As the cryptocurrency stabilizes, will Toncoin break to the upside, setting the stage for a fresh rally, or will it falter and dip lower, testing crucial support levels?
This consolidation phase is more than just a pause in price action; it represents a pivotal moment that could determine TON’s next major move. A breakout to the upside could signal renewed positive sentiment, attracting more buyers and fueling a strong upward trend.
On the other hand, a breakdown could shift the market sentiment to bearish, with the price heading lower to retest key support zones. In this article, we will explore both scenarios in detail, analyzing the key levels to watch and what a breakout in either direction could mean for Toncoin’s future trajectory.
Toncoin Current Range: Understanding The Consolidation Phase
As Toncoin consolidates, current price action suggests the potential for a breakout to the upside. The price has shown signs of bullish momentum within the consolidation range, with gradual upward movements indicating increasing buying interest.
Related Reading
Furthermore, this upward pressure within the range is often a precursor to a breakout, as market participants accumulate positions, anticipating a rise above resistance levels. If this momentum continues to build, it could signal that Toncoin is preparing for a strong move on the upside once the price breaks free from its current consolidation zone.

The Relative Strength Index (RSI) is currently trending above the 50% threshold, indicating that Toncoin is in positive territory and buying pressure is starting to outpace selling activity, which is often a sign of bullish momentum. When the RSI remains above the 50% mark, it suggests that the asset is more likely to experience upward movement as it reflects an increasing number of buyers compared to sellers.
Typically, this level is often seen as a key indicator for possible future gains, showing that market sentiment is leaning toward optimism. As the RSI trends higher, the likelihood of a breakout to the upside increases, reinforcing the optimistic outlook for Toncoin.
What Happens After A Breakout? Possible Price Targets And Next Steps
After a breakout, TON’s direction will hinge on whether the move is upward or downward. If the price breaks higher, it could target the $7.2 resistance level, which could act as an initial hurdle.
Breaking above this level successfully would indicate strong bullish momentum, potentially triggering upward movement. In this scenario, the next key resistance level to watch would be $8.3. A move past this point could set Toncoin on a path for additional gains, as it would signal that the bulls are in control and the price may continue to climb toward new highs.
Related Reading
On the other hand, if the breakout is to the downside, the price will likely test the $6 support level. A breach of this level could lead to more declines, with subsequent support zones becoming crucial.
Conclusively, increased volatility is common, so traders should watch for confirmation signals after a breakout, such as volume and momentum indicators, to gauge the sustainability of the move. The broader market sentiment also plays a significant role in determining the direction and strength of the breakout.
Featured image from Adobe Stock, chart from Tradingview.com
Source link
Bitcoin has shattered expectations once again, surging past the critical $93,257 level in a display of unstoppable momentum. This breakout has ignited fresh waves of bullish optimism across the crypto market, as traders and investors anticipate greater gains. With market sentiment shifting and key indicators aligning, could this be the spark for Bitcoin’s next major rally?
As optimism steadily increases in the market, the goal is to take a closer look at BTC’s impressive breakout above the $93,257 mark, analyze the positive sentiment driving its climb, and assess the potential for continued upward strength in the market.
Bullish Indicators: What’s Fueling BTC’s Uptrend?
Currently, on the 4-hour chart, BTC is sustaining its position after successfully surpassing the $93,257 mark while trading above the 100-day Simple Moving Average (SMA). By maintaining its position above this level and the 100-day SMA, BTC demonstrates resilience and capability for more price growth, targeting new highs.
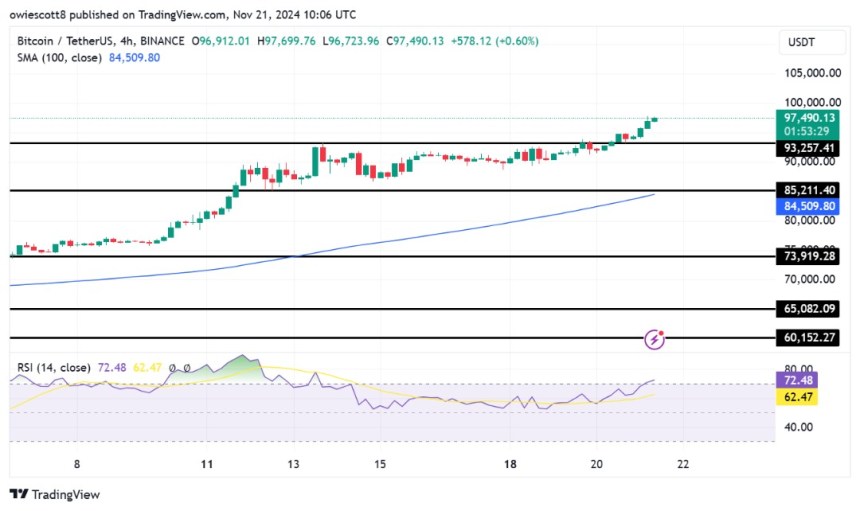
An analysis of the 4-hour Relative Strength Index (RSI) shows a significant surge, climbing to 70% from its previous low of 56%, indicating strong bullish pressure for BTC. While this increase signals growing positive market sentiment, it raises concerns about the rally’s sustainability since a price correction could occur if profit-taking ensues.
Bitcoin is showing strong positive movement after breaking past the $93,257 level, supported by a rise above the 100-day SMA, reflecting sustained bullish strength and potential for continued upward movement. The fact that BTC is consistently above the 100-day SMA suggests a solid trend and that the bulls are eager to push prices higher, possibly leading to an extended growth if pressure continues to build.
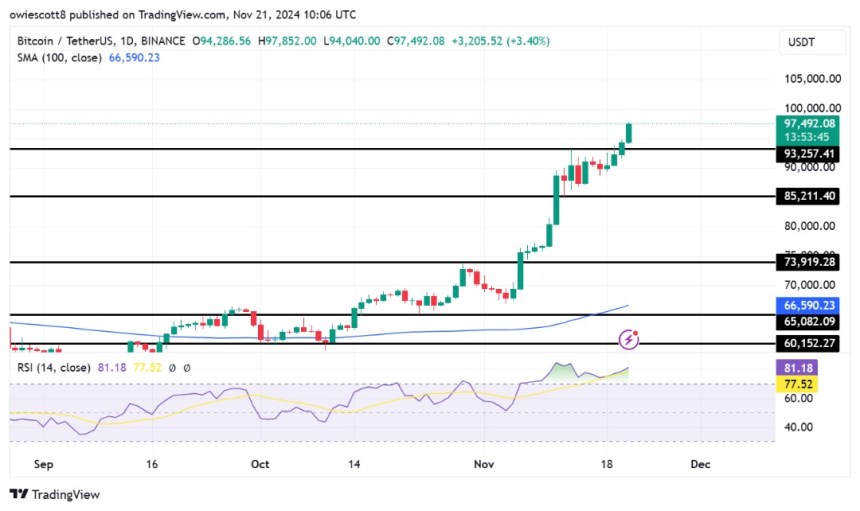
Finally, the RSI on the daily chart is currently at 81%, well above the key 50% threshold, signaling a strong uptrend for Bitcoin. With the RSI at this level, it suggests that the upside pressure is likely to continue, which means that Bitcoin’s price could keep rising in the near term, as there are no signs of a reversal or decline.
What The $93,257 Breakout Signals For Bitcoin
The $93,257 breakout opens the door to a more optimistic future outlook for Bitcoin. This key resistance level has been decisively breached, suggesting that BTC may continue its upbeat momentum, potentially targeting higher price levels such as the $100,000 mark and beyond.
However, careful monitoring is essential for any signs of resistance or market corrections that could hinder its ascent. Should such a scenario occur, Bitcoin’s price could begin to drop toward the $93,257 mark. A break below this level might trigger further declines, possibly testing additional support levels in the process.
Source link

Despite market fluctuations, SUI has demonstrated remarkable stability, holding steady above the critical $3.5 support level. This steady performance reflects underlying bullish momentum, as buyers continue to defend this key zone, boosting confidence in the asset’s upward potential. With strong support intact, SUI appears well-positioned to target higher resistance levels, sparking optimism for further gains.
This analysis aims to explore SUI’s ability to stay above the $3.5 level and assess its implications for future price movements. By examining key technical indicators and resistance zones, this piece seeks to provide insights into whether SUI can sustain its bullish strength or if market pressures could trigger a shift in its trajectory.
What SUI Stability Above $3.5 Means For Bulls
SUI is showcasing renewed bullish strength as it maintains a firm position above the critical $3.5 support level. This stability highlights growing buying interest and market confidence, paving the way for a possible move toward the $4 mark. Its ability to hold above this key level and the 4-hour Simple Moving Average (SMA) reinforces the asset’s upward momentum, and positions SUI for further gains if positive sentiment persists.
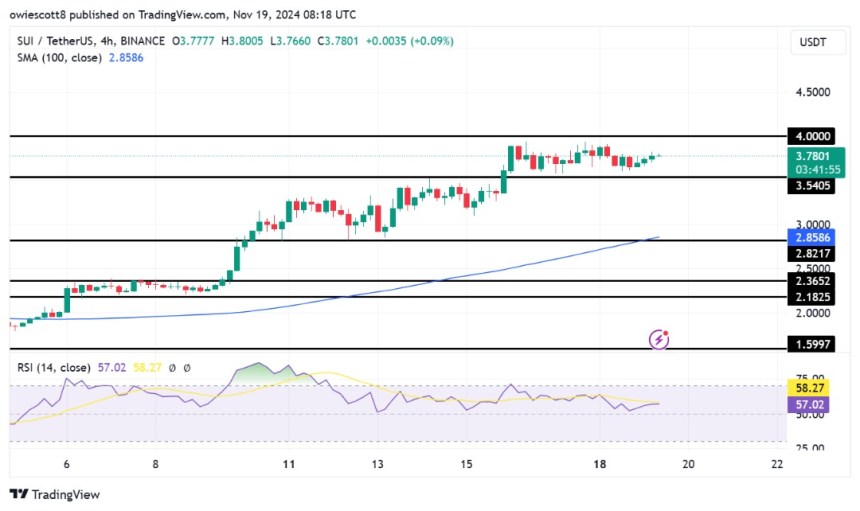
An analysis of the 4-hour Relative Strength Index (RSI) analysis shows a rebound from 51%, rising toward and above the 60% level, indicating a renewed optimistic outlook. If the RSI continues to rise above 60%, it would confirm the positive trend, boosting the potential for more price growth.
Additionally, SUI shows significant upward movement on the daily chart, marked by the formation of a bullish candlestick as it moves toward the $4 mark. Trading above the crucial 100-day SMA reinforces the positive trend, indicating sustained strength. As SUI continues to climb, it bolsters market confidence, setting the stage for growth. With upside pressure brewing, the next key target to watch out for is the $4 resistance level, which could determine whether the bullish move extends.
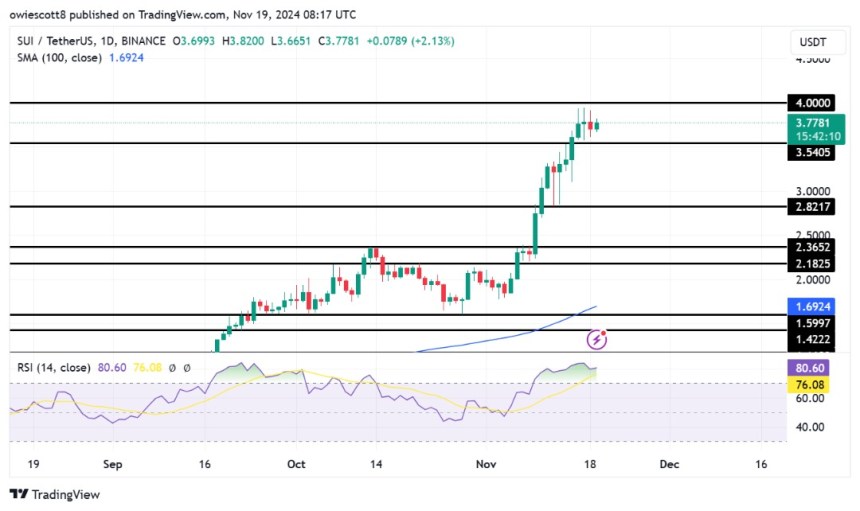
The daily chart’s RSI has increased to 80%, signaling strong positive sentiment with sustained buying pressure. While the asset remains in an overbought territory, it shows no signs of weakening. If the momentum continues, further price gains are possible, though one should be cautious, as prolonged overbought conditions could lead to a correction if buying pressure decreases.
Potential Scenarios: Upside Targets And Risks To Watch
SUI’s current stability above the $3.5 support level indicates potential for continued upside. Should buying pressure persist, the next key target lies at $4, where bullish interest could be triggered, leading to new price highs.
However, if resistance at $4 proves challenging to break through, consolidation or a minor decline may occur, possibly causing the price to retreat toward the $3.5 support level. A break below this level could result in additional losses, with the next key support target being around $2.8, followed by other support areas below.
Source link
Terraform Co-Founder Do Kwon’s Trial To Begin In 2026

The Lightning Network Privacy Big Picture: Don't Forget the NSA
Digital banking giant Revolut joins Pyth Network
‘Very Dubious’ Speculation Suggests Bitcoin Could Follow Nasdaq ETF Rallies of 1999: Benjamin Cowen
How Will Donald Trump’s Tariff Plans Impact The Crypto Market?
Ledn Remains Bitcoin’s Premier Borrowing And Lending Platform
Analysts says Solana price to pass $500 In Q1, while this altcoin could rally 2,000%
Pakistani Trader Kidnapped, Forced to Hand Over $340,000 in Crypto
Will BTC Recover After 2025’s First Crash?
South Korea to allow institutional investors to trade crypto: report
Accurate Indicator Hints Bitcoin’s Top Is Near
Bitcoin Plunges Below $100K Despite Positive Coinbase Premium Signal – What’s Next?

Bitcoin ETF inflows slump as BTC falls over 5% amid macroeconomic pressures

BlackRock Bitcoin ETF (IBIT) Sees $597M In Inflow, Saves the Day
Web 4.0 – Blockchain and AI Will Usher In a More Humane and User-Friendly Web

Ethereum’s lowered yield might signal a paradigmatic shift in the ecosystem

Telegram users can send gifts to friends, TON fails to pump

Bitcoin Could Rally to $80,000 on the Eve of US Elections

Institutional Investors Go All In on Crypto as 57% Plan to Boost Allocations as Bull Run Heats Up, Sygnum Survey Reveals

Crypto’s Big Trump Gamble Is Risky

Arthur Hayes, Murad’s Prediction For Meme Coins, AI & DeFi Coins For 2025

A Kamala Presidency Could Be Just as Bullish for Bitcoin

Ripple-SEC Case Ends, But These 3 Rivals Could Jump 500x

SEC filing underway, Bitcoin rewards app Fold adopts FLD ticker

Cardano and the XRP price action lock in bulls vs bears battle as RCO Finance prepares for 3,000% surge

A16z-backed Espresso announces mainnet launch of core product

Tether CEO Paolo Ardoino Denies Rumors That Stablecoin Issuer Is Under Federal Investigation

Crypto Exchange OKX Moves To Support USDC Ecosystem by Adding Six New Trading Pairs

Trump’s Coin Is About As Revolutionary As OneCoin

Ripple Vs. SEC, Shiba Inu, US Elections Steal Spotlight
 DeFi3 months ago
Ethereum’s lowered yield might signal a paradigmatic shift in the ecosystem
 News3 months ago
Telegram users can send gifts to friends, TON fails to pump
 Bitcoin2 months ago
Bitcoin Could Rally to $80,000 on the Eve of US Elections
 Bitcoin2 months ago
Institutional Investors Go All In on Crypto as 57% Plan to Boost Allocations as Bull Run Heats Up, Sygnum Survey Reveals
 Opinion2 months ago
Crypto’s Big Trump Gamble Is Risky
 24/7 Cryptocurrency News2 months ago
Arthur Hayes, Murad’s Prediction For Meme Coins, AI & DeFi Coins For 2025
 Opinion3 months ago
A Kamala Presidency Could Be Just as Bullish for Bitcoin
 Price analysis2 months ago
Ripple-SEC Case Ends, But These 3 Rivals Could Jump 500x
