
ETH
Here’s Where Ethereum’s Last Line Of Defense Lies, According To On-Chain Data
Reason to trust
![]()
Strict editorial policy that focuses on accuracy, relevance, and impartiality
Created by industry experts and meticulously reviewed
The highest standards in reporting and publishing
Strict editorial policy that focuses on accuracy, relevance, and impartiality
Morbi pretium leo et nisl aliquam mollis. Quisque arcu lorem, ultricies quis pellentesque nec, ullamcorper eu odio.
On-chain data shows Ethereum has broken under all major investor cost basis levels, except for one. Here’s where this price level is currently situated.
Ethereum Has Only Realized Price Of Mega Whales To Rely On Now
In a CryptoQuant Quicktake post, analyst MAC_D has discussed about where the next major support level could lie for Ethereum. The line in question is a version of the Realized Price.
The “Realized Price” is an on-chain indicator that, in short, keeps track of the average cost basis of investors belonging to a given ETH cohort. When this metric is under the spot price, it means the average member of the group is holding coins at a net loss. On the other hand, it being above the asset’s value suggests the cohort as a whole is in a state of net profit.
Related Reading
Investor cost basis is considered an important topic in on-chain analysis, as holders can be more likely to show some kind of move when their profit-loss status is challenged.
Whether investors react by buying or selling can come down to which direction the retest of their acquisition level is occurring from. When it’s from above, holders may decide to accumulate more if the atmosphere is bullish, as they can consider the pullback to be just a ‘dip.’ This provides support to the asset, thus defending their cost basis.
Similarly, investors who were underwater just prior to the retest might believe the surge wouldn’t last and they would fall back into losses again. So, they could make the decision to exit, to at least escape with their entire investment back.
A cost basis level that has shown particular importance for not just Ethereum, but digital assets in general is the Realized Price of the entire network. As the chart shared by the quant shows, this level is currently situated around $2,250 for ETH.

From the graph, it’s apparent that the line provided support to Ethereum last year, but it has failed recently as the coin’s price has significantly fallen under it. This means that the average holder on the blockchain is now sitting on a notable loss.
With this major level gone, the Realized Price of the individual cohorts could help point to where the next support could be. Here is a chart displaying the trend in the indicator for investors holding between 100 to 1,000 ETH, 1,000 to 10,000 ETH, 10,000 to 100,000 ETH, and more than 100,000 ETH:

As is visible in the graph, Ethereum has put three of the cohorts underwater with the latest crash. Now, only the largest of holders in the sector, those with over 100,000 ETH in their balance, are still in the green.
Related Reading
Back in the 2022 bear market, ETH found support at the Realized Price of these humongous whales. Thus, it’s possible that this line could once again be of relevance to ETH.
At present, the cohort has its average acquisition level at $1,290, so it will take more bearish action before a retest can take place.
ETH Price
At the time of writing, Ethereum is trading around $1,500, down more than 16% in the last 24 hours.
Featured image from Dall-E, CryptoQuant.com, chart from TradingView.com
Source link


Reason to trust
![]()
Strict editorial policy that focuses on accuracy, relevance, and impartiality
Created by industry experts and meticulously reviewed
The highest standards in reporting and publishing
Strict editorial policy that focuses on accuracy, relevance, and impartiality
Morbi pretium leo et nisl aliquam mollis. Quisque arcu lorem, ultricies quis pellentesque nec, ullamcorper eu odio.
Ethereum price started a fresh decline from the $1,690 zone. ETH is now consolidating and might decline further below the $1,580 support zone.
- Ethereum started a fresh decline after it failed to clear $1,700 and $1,720.
- The price is trading below $1,620 and the 100-hourly Simple Moving Average.
- There was a break below a new connecting bullish trend line with support at $1,625 on the hourly chart of ETH/USD (data feed via Kraken).
- The pair could start a fresh increase if it clears the $1,640 resistance zone.
Ethereum Price Faces Rejection
Ethereum price formed a base above $1,550 and started a fresh increase, like Bitcoin. ETH gained pace for a move above the $1,600 and $1,620 resistance levels.
The bulls even pumped the price above the $1,650 zone. A high was formed at $1,690 and the price recently corrected gains. There was a move below the $1,640 support zone. Besides, there was a break below a new connecting bullish trend line with support at $1,625 on the hourly chart of ETH/USD.
The price tested the 50% Fib retracement level of the upward move from the $1,472 swing low to the $1,690 high. Ethereum price is now trading below $1,625 and the 100-hourly Simple Moving Average.
On the upside, the price seems to be facing hurdles near the $1,620 level. The next key resistance is near the $1,640 level. The first major resistance is near the $1,650 level. A clear move above the $1,650 resistance might send the price toward the $1,690 resistance.

An upside break above the $1,690 resistance might call for more gains in the coming sessions. In the stated case, Ether could rise toward the $1,750 resistance zone or even $1,800 in the near term.
More Losses In ETH?
If Ethereum fails to clear the $1,640 resistance, it could start another decline. Initial support on the downside is near the $1,580 level. The first major support sits near the $1,555 zone and the 61.8% Fib retracement level of the upward move from the $1,472 swing low to the $1,690 high.
A clear move below the $1,555 support might push the price toward the $1,525 support. Any more losses might send the price toward the $1,450 support level in the near term. The next key support sits at $1,420.
Technical Indicators
Hourly MACD – The MACD for ETH/USD is gaining momentum in the bearish zone.
Hourly RSI – The RSI for ETH/USD is now below the 50 zone.
Major Support Level – $1,580
Major Resistance Level – $1,640
Source link
Reason to trust
![]()
Strict editorial policy that focuses on accuracy, relevance, and impartiality
Created by industry experts and meticulously reviewed
The highest standards in reporting and publishing
Strict editorial policy that focuses on accuracy, relevance, and impartiality
Morbi pretium leo et nisl aliquam mollis. Quisque arcu lorem, ultricies quis pellentesque nec, ullamcorper eu odio.
Ethereum might be on track to facing renewed pressure, according to an interesting technical outlook. Despite short bursts of recovery attempts, the broader market structure is still trying to flip in favor of bulls, but price movement shows that the bears are still in control. Notably, a recent technical analysis posted by crypto analyst Youriverse on the TradingView platform highlights a potential sharp drop in the price of Ethereum towards $1,400 if the current downward trend continues.
Strong Rejection From Key Fibonacci Zone Hints At Persistent Resistance
Technical analysis shows that the Ethereum price chart is currently characterized by a noticeable Fair Value Gap (FVG) on the 4-hour timeframe. This interesting gap was left behind after a steep 10% drop last Sunday, marking a strong area of seller dominance.
Related Reading
This gap represents a zone of clear imbalance where selling activity outweighs buying pressure and has influenced Ethereum’s price action throughout the past seven days. Earlier last week, Ethereum retraced into this gap, reaching the midpoint, but was met with swift rejection. This swift rejection showed the intense selling pressure present within this Fair Value Gap.
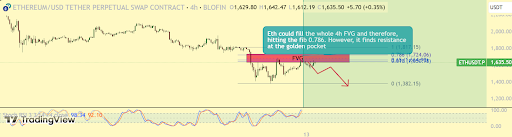
Interestingly, the Ethereum price has returned to this Fair Value Gap again, and another rejection here could send it back to a bottom below $1,400. Furthermore, Ethereum is trading within an area identified as the “golden pocket” of the Fibonacci extension indicator, which is drawn from the $1,383 bottom on April 9. Unless price action breaks decisively above this level and heads toward the next Fib level of 0.786 at $1,724, there is still a risk of a significant rejection that could lead to further downside below $1,400.
Stochastic RSI Weakness Suggests Possible Downturn Ahead For Ethereum
In addition to the Fair Value Gap and Ethereum’s struggle within the golden pocket of the Fibonacci retracement zone, the Stochastic RSI is now introducing another layer of bearish pressure to the current outlook. This momentum oscillator, which measures the relative strength of recent price movements, is approaching the overbought region on the daily timeframe.
Related Reading
Ethereum’s approach of overbought zone with the Stochastic RSI is due to inflows that have pushed the crypto’s price from the $1,383 bottom on April 9. Now that the Stochastic RSI is moving into the overbought zone, it adds to the bearish outlook that it could reject at the Fair Value Gap and start a new downside correction very soon.
So far, the Ethereum price was rejected at $1,650 in the past 24 hours, which further supports the bearish continuation thesis. If the selling pressure builds again, as suggested by both the weakening RSI and persistent resistance at the Fair Value Gap, the analyst warns of a breakdown that could drag the price to as low as $1,400, or even lower.
At the time of writing, Ethereum is trading at $1,627.
Featured image from Unsplash, chart from Tradingview.com
Source link
Reason to trust
![]()
Strict editorial policy that focuses on accuracy, relevance, and impartiality
Created by industry experts and meticulously reviewed
The highest standards in reporting and publishing
Strict editorial policy that focuses on accuracy, relevance, and impartiality
Morbi pretium leo et nisl aliquam mollis. Quisque arcu lorem, ultricies quis pellentesque nec, ullamcorper eu odio.
Despite rolling out a large number of upgrades and innovations, the Ethereum price continues to lag behind Bitcoin (BTC) by a wide margin. Reports reveal that ETH has suffered a staggering 77% price crash against BTC — a decline likely fueled by a mix of technical, macro, and sentiment-driven factors. Notably, On-chain analytics platform, Santiment has now pinpointed and broken down the key reasons behind these price struggles.
Ethereum Price Nosedives Against Bitcoin
On April 11, Santiment released a detailed report on Ethereum, highlighting its almost four-year underperformance and the reasons behind it. Ethereum, once revered as the cryptocurrency most likely to dethrone Bitcoin, has recently suffered a brutal price decline when measured directly against BTC.
Related Reading
According to Santiment’s on-chain data, Ethereum has crashed by approximately 77% against Bitcoin since December 2021. While the dollar value of ETH hasn’t completely collapsed, especially compared to other altcoins, the long-term BTC/ETH ratio still paints a gruesome picture for Ethereum holders.
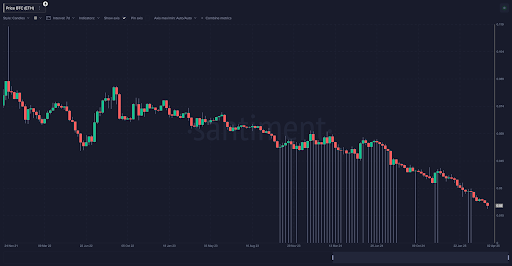
Notably, Ethereum has also failed to recover anywhere near its November 2021 all-time high of $4,760. In contrast, Bitcoin has surged ahead, reclaiming much of its market dominance and outpacing ETH across almost every timeframe.
This disparity has led many traders and former maximalists to compare ETH to a “shitcoin.” Even worse, various mid to low-cap altcoins have already outperformed Ethereum over the short, mid, and long-term timeframes, causing further embarrassment for the world’s second-largest cryptocurrency by market capitalization. Based on Santiment’s report, the ETH/BTC price ratio chart alone is enough to trigger doubt and uncertainty among long-term holders.
Behind The Scenes Of Ethereum Price Struggles
Beyond price action and market volatility, Santiment reveals that there are fundamental reasons for Ethereum’s sluggish performance over the years. Some of the major criticisms that analysts and traders have pinpointed include technical, sentimental, and regulatory issues.
Related Reading
Ironically, Ethereum’s Layer 2 solutions are one of the key drivers of its underperformance. L2 solutions like Arbitrum, Optimism, and zkSync are reportedly cannibalizing activity on the mainnet, taking investments from ETH while spreading investor attention thin.
Secondly, Ethereum seems to struggle with complex roadmaps and communication, which has led to investor confusion. Major updates like The Merge and Shanghai have been difficult for investors to comprehend, making ETH feel less accessible than BTC.
Thirdly, users remain frustrated by Ethereum’s relatively high gas fees and the slow rollout of key upgrades. This has pushed them toward more affordable and faster alternatives, significantly reducing adoption.
Another primary reason for Ethereum’s crash against Bitcoin is ongoing regulatory concerns. Unlike Bitcoin, which has a more established legal precedent, Ethereum faces constant uncertainty about whether it could be labeled a security.
Other points include ETH’s lack of investment appeal. While Bitcoin maintains the title as a stable digital gold, Ethereum appears to be caught in between, having no clear or attractive investment narrative. Moreover, newer blockchains like Solana and Cardano are also attracting a significant number of users with cheaper and faster solutions, ultimately pulling investments away from ETH.
The final reason Santiment has identified for Ethereum’s long-term price descent is rising selling pressure. Post-upgrade withdrawals of stakes ETHs have created steady sell-side pressure, limiting growth and momentum compared to Bitcoin.
Featured image from Unsplash, chart from Tradingview.com
Source link

Apple Delists 14 Crypto Apps in South Korea Including KuCoin and MEXC Exchanges Amid Regulatory Crackdown

Athens Exchange Group eyes first onchain order book via Sui

Futureverse Acquires Candy Digital, Taps DC Comics and Netflix IP to Boost Metaverse Strategy
Court Grants Ripple And SEC’s Joint Motion To Suspend Appeal

AVAX Falls 2.1% as Nearly All Assets Trade Lower

What is a VTuber, and how do you become one in 2025?

Top Expert’s Update Sets $10 Target

How Academia Interacts With The Bitcoin Ecosystem

AB DAO and Bitget Launch Dual Reward Campaign, Distributing $2.6M Worth of $AB Globally

AI crypto tokens at risk as Nvidia faces restrictions on China exports

Coinbase Urges Australia to Vote for Crypto Progress in May

How High Would Pi Network Price Go If Pi Coin Adopts Transparency to Avoid Mantra Pitfalls

XRP’s ‘Rising Wedge’ Breakdown Puts Focus on $1.6 Price Support

China selling seized crypto to top up coffers as economy slows: Report

Ethereum Price Dips Again—Time to Panic or Opportunity to Buy?


 24/7 Cryptocurrency News5 months ago
Arthur Hayes, Murad’s Prediction For Meme Coins, AI & DeFi Coins For 2025

 Bitcoin3 months ago
Expert Sees Bitcoin Dipping To $50K While Bullish Signs Persist

 24/7 Cryptocurrency News3 months ago
Aptos Leverages Chainlink To Enhance Scalability and Data Access

 Bitcoin5 months ago
Bitcoin Could Rally to $80,000 on the Eve of US Elections

 Opinion5 months ago
Crypto’s Big Trump Gamble Is Risky

 Altcoins3 months ago
Sonic Now ‘Golden Standard’ of Layer-2s After Scaling Transactions to 16,000+ per Second, Says Andre Cronje

 Bitcoin5 months ago
Institutional Investors Go All In on Crypto as 57% Plan to Boost Allocations as Bull Run Heats Up, Sygnum Survey Reveals

 Price analysis5 months ago
Ripple-SEC Case Ends, But These 3 Rivals Could Jump 500x
