
Bitcoin Magazine Pro
How To Buy Bitcoin During Bull Market Dips

Buying Bitcoin at significantly higher prices than just a few months ago can be daunting. However, with the right strategies, you can buy Bitcoin during dips with a favorable risk-to-reward ratio while riding the bull market.
Confirming Bull Market Conditions
Before accumulating, ensure you’re still in a bull market. The MVRV Z-score helps identify overheated or undervalued conditions by analyzing the deviation between market value and realized value.
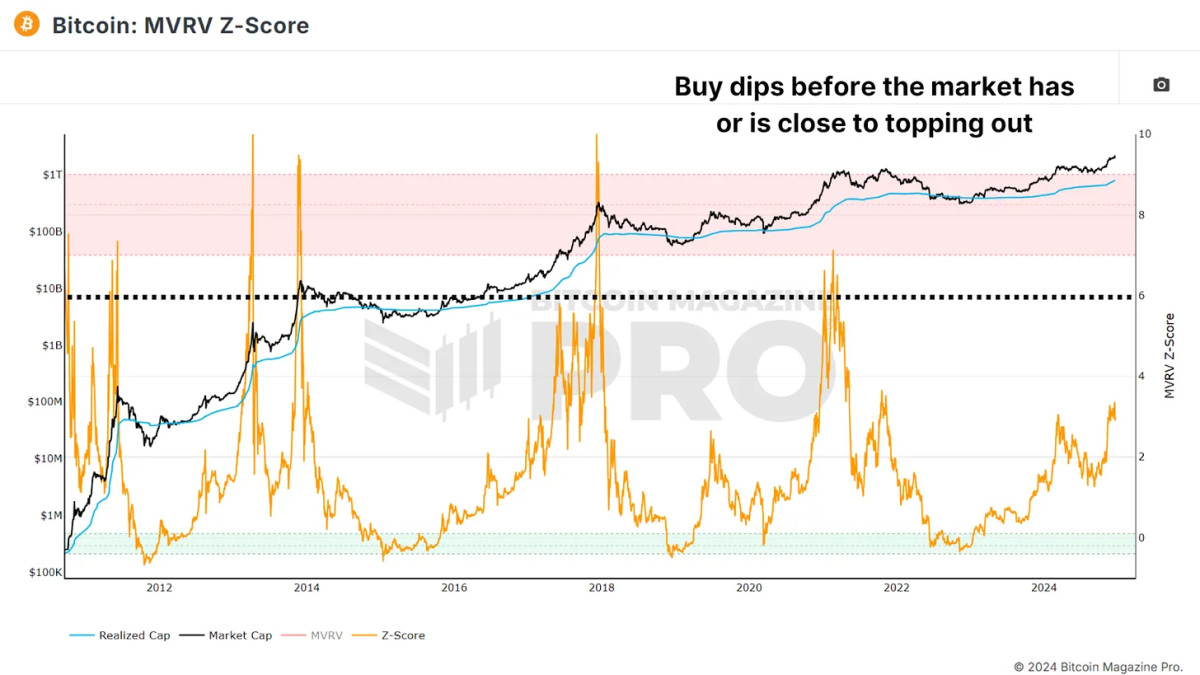

Avoid Buying when the Z-score reaches high values, such as above 6.00, which would indicate the market is overextended and nearing a potential bearish reversal. If the Z-score is below this, dips likely represent opportunities, especially if other indicators align. Don’t accumulate aggressively during a bear market. Focus instead on finding the macro bottom.
Short-Term Holders
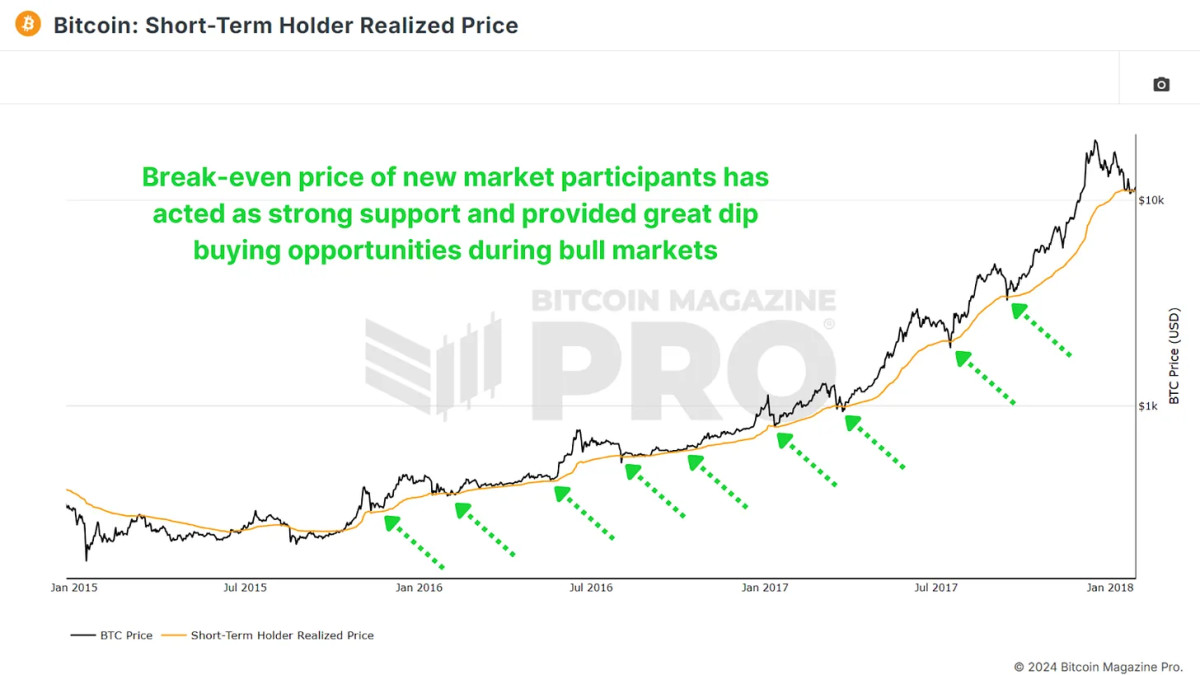
This chart reflects the average cost basis of new market participants, offering a glimpse into the Short-Term Holder activity. Historically, during bull cycles, whenever the price rebounds off the Short-Term Holder Realized Price line (or slightly dips below), it has presented excellent opportunities for accumulation.
Gauging Market Sentiment
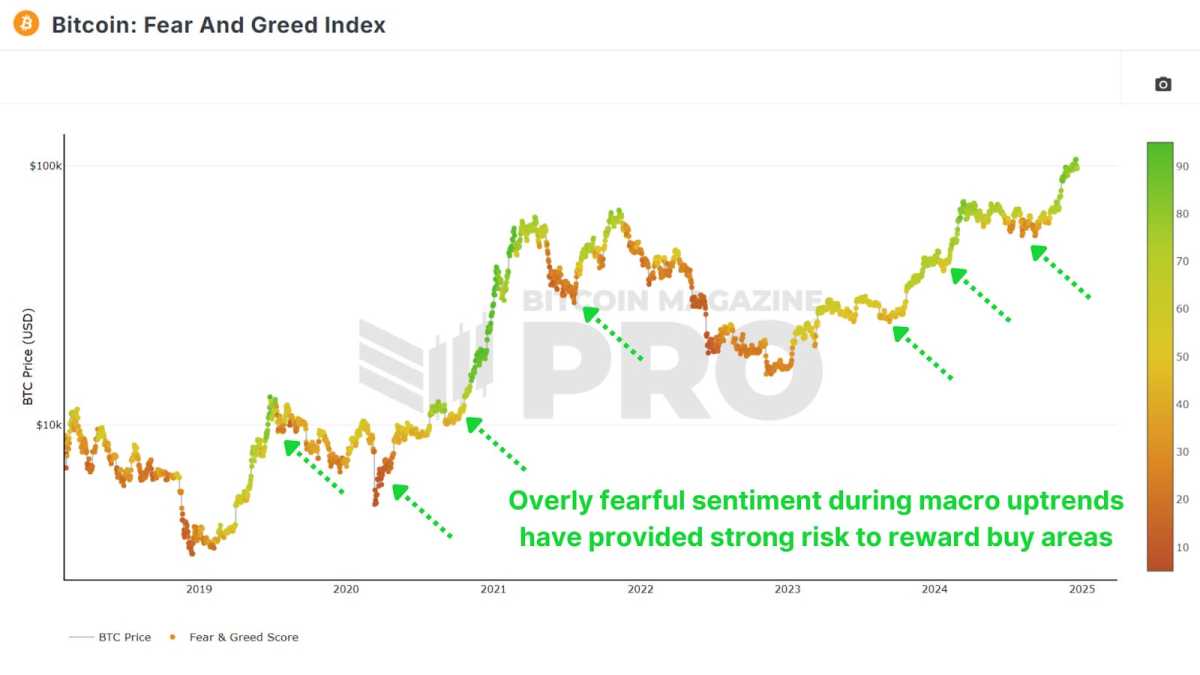
Though simple, the Fear and Greed Index provides valuable insight into market emotions. Scores of 25 or below often signify extreme fear, which often accompanies irrational sell-offs. These moments offer favorable risk-to-reward conditions.
Spotting Market Overreaction
Funding Rates reflect trader sentiment in futures markets. Negative Funding during bull cycles are particularly telling. Exchanges like Bybit, which attract retail investors, show that negative Rates are a strong signal for accumulation during dips.
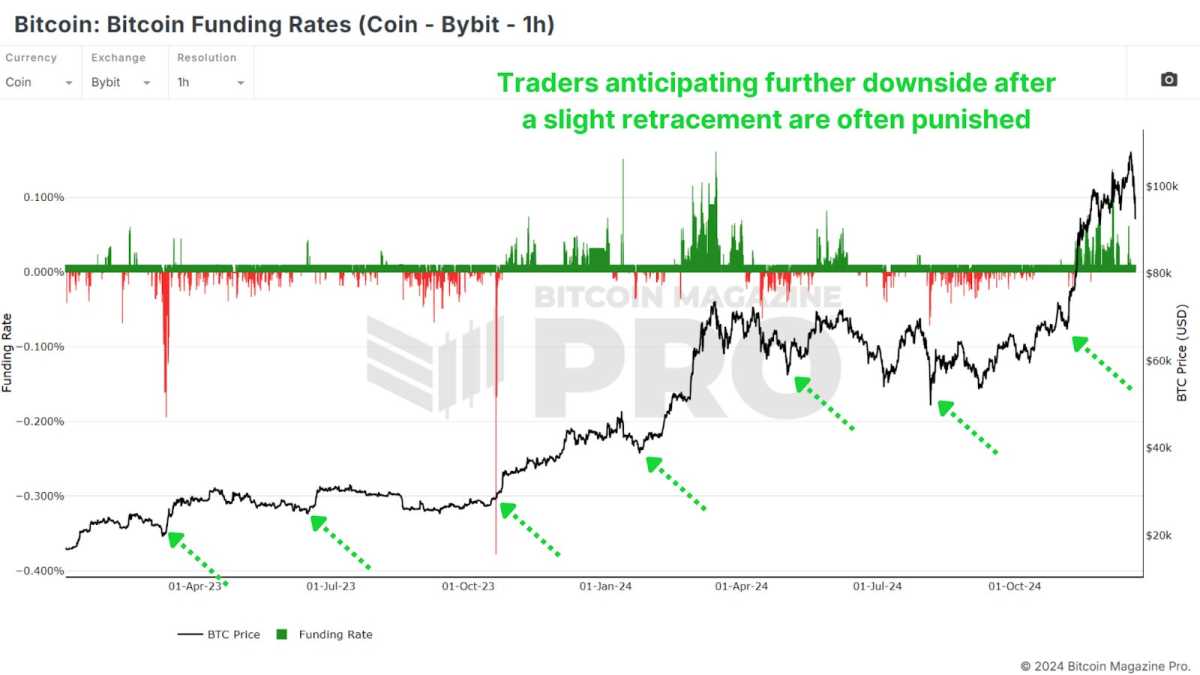
When traders use BTC as collateral, negative rates often indicate excellent buying opportunities, as those shorting with Bitcoin tend to be more cautious and deliberate. This is why I prefer focusing on Coin-Denominated Funding Rates as opposed to regular USD Rates.
Active Address Sentiment Indicator
This tool measures the divergence between Bitcoin’s price and network activity, when we see a divergence in the Active Address Sentiment Indicator (AASI) it indicates that there’s overly bearish price action given how strong the underlying network usage is.

My preferred method of utilization is to wait until the 28-day percentage price change dips beneath the lower standard deviation band of the 28-day percentage change in active addresses and crosses back above. This buy signal confirms network strength and often signals a reversal.
Conclusion
Accumulating during bull market dips involves managing risk rather than chasing bottoms. Buying slightly higher but in oversold conditions reduces the likelihood of experiencing a 20%-40% drawdown compared to purchasing during a sharp rally.
Confirm we’re still in a bull market and dips are for buying, then identify favorable buying zones using multiple metrics for confluence, such as Short-Term Holder Realized Price, Fear & Greed Index, Funding Rates, and AASI. Prioritize small, incremental purchases (dollar-cost averaging) over going all-in and focus on risk-to-reward ratios rather than absolute dollar amounts.
By combining these strategies, you can make informed decisions and capitalize on the unique opportunities presented by bull market dips. For a more in-depth look into this topic, check out a recent YouTube video here: How To Accumulate Bitcoin Bull Market Dips
For more detailed Bitcoin analysis and to access advanced features like live charts, personalized indicator alerts, and in-depth industry reports, check out Bitcoin Magazine Pro.
Disclaimer: This article is for informational purposes only and should not be considered financial advice. Always do your own research before making any investment decisions.
Source link


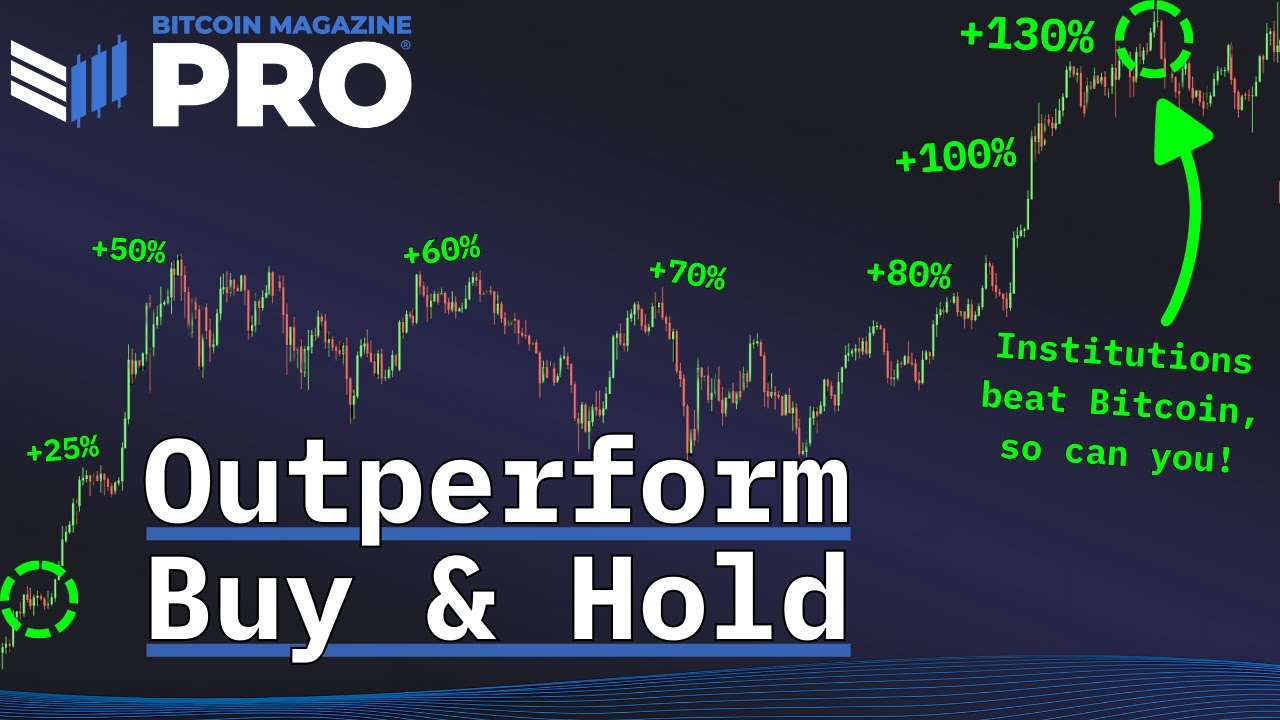
Bitcoin has seen an institutional capital influx on a scale previously unfathomable. Billions of dollars are flowing into Bitcoin ETFs, reshaping the liquidity landscape, inflow-outflow dynamics, and investor psychology. While many interpret this movement as smart money executing complex strategies backed by proprietary analytics, a surprising reality surfaces: outperforming the institutions might not be as difficult as it seems.
For a more in-depth look into this topic, check out a recent YouTube video here:
Outperforming Bitcoin – Invest Like Institutions
Canary In The Bitcoin Coal Mine
One of the most revealing datasets available today is daily Bitcoin ETF flow data. These flows, denoted in USD, offer direct insight into how much capital is entering or exiting the Bitcoin ETF ecosystem on any given day. This data has a startlingly consistent relationship with short to mid-term price action.
Importantly, while these flows do impact price, they are not the primary movers of a multi-trillion-dollar market. Instead, ETF activity functions more like a mirror for broad market sentiment, especially as retail traders dominate volume during trend inflections.

Surprisingly Simple
The average retail investor often feels outmatched, overwhelmed by the data, and disconnected from the tactical finesse institutions supposedly wield. But institutional strategies are often simple trend-following mechanisms that can be emulated and even surpassed with disciplined execution and proper risk framing:
Strategy Rules:
- Buy when ETF flows are positive for the day.
- Sell when ETF flows turn negative.
- Execute each trade at daily close, using 100% portfolio allocation for clarity.
- No complex TA, no trendlines, just follow the flows.
This system was tested using Bitcoin Magazine Pro’s ETF data starting from January 2024. The base assumption was a first entry on Jan 11, 2024, at ~$46,434 with subsequent trades dictated by flow changes.

Performance vs. Buy-and-Hold
Backtesting this basic ruleset yielded a return of 118.5% as of the end of March 2025. By contrast, a pure buy-and-hold position over the same period yielded 81.7%, a respectable return, but a near 40% underperformance relative to this proposed Bitcoin ETF strategy.
Importantly, this strategy limits drawdowns by reducing exposure during downtrends, days marked by institutional exits. The compounding benefit of avoiding steep losses, more than catching absolute tops or bottoms, is what drives outperformance.

Institutional Behavior
The prevailing myth is that institutional players operate on superior insight. In reality, the majority of Bitcoin ETF inflows and outflows are trend-confirming, not predictive. Institutions are risk-managed, highly regulated entities; they’re often the last to enter and the first to exit based on trend and compliance cycles.
What this means is that institutional trades tend to reinforce existing price momentum, not lead it. This reinforces the validity of using ETF flows as a proxy signal. When ETFs buy, they’re confirming a directional shift that is already unfolding, allowing the retail investor to “surf the wave” of their capital inflow.

Conclusion
The past year has proven that beating Bitcoin’s buy-and-hold strategy, one of the toughest benchmarks in financial history, is not impossible. It requires neither leverage nor complex modeling. Instead, by aligning oneself with institutional positioning, retail investors can benefit from market structure shifts without the burden of prediction.
This doesn’t mean the strategy will work forever. But as long as institutions continue to influence price through these large, visible flow mechanics, there is an edge to be gained in simply following the money.

If you’re interested in more in-depth analysis and real-time data, consider checking out Bitcoin Magazine Pro for valuable insights into the Bitcoin market.
Disclaimer: This article is for informational purposes only and should not be considered financial advice. Always do your own research before making any investment decisions.
Source link
Following a sharp multi-week selloff that dragged Bitcoin from above $100,000 to below $80,000, the recent price bounce has traders debating whether the Bitcoin bull market is truly back on track or if this is merely a bear market rally before the next macro leg higher.
Bitcoin’s Local Bottom or Bull Market Pause?
Bitcoin’s latest correction was deep enough to rattle confidence, but shallow enough to maintain macro trend structure. Price seems to have set a local bottom between $76K–$77K, and several reliable metrics are beginning to solidify the local lows and point towards further upside.
The Net Unrealized Profit and Loss (NUPL) is one of the most reliable sentiment gauges across Bitcoin cycles. As price fell, NUPL dropped into “Anxiety” territory, but following the rebound, NUPL has now reclaimed the “Belief” zone, a critical sentiment transition historically seen at macro higher lows.

The Value Days Destroyed (VDD) Multiple weighs BTC spending by both coin age and transaction size, and compares the data to a previous yearly average, giving insight into long term holder behavior. Current readings have reset to low levels, suggesting that large, aged coins are not being moved. This is a clear signal of conviction from smart money. Similar dynamics preceded major price rallies in both the 2016/17 and 2020/21 bull cycles.

Bitcoin Long-Term Holders Boost Bull Market
We’re also now seeing the Long Term Holder Supply beginning to climb. After profit-taking above $100K, long-term participants are now re-accumulating at lower levels. Historically, these phases of accumulation have set the foundation for supply squeezes and subsequent parabolic price action.

Bitcoin Hash Ribbons Signal Bull Market Cross
The Hash Ribbons Indicator has just completed a bullish crossover, where the short-term hash rate trend moves above the longer-term average. This signal has historically aligned with bottoms and trend reversals. Given that miner behavior tends to reflect profitability expectations, this cross suggests miners are now confident in higher prices ahead.

Bitcoin Bull Market Tied to Stocks
Despite bullish on-chain data, Bitcoin remains closely tied to macro liquidity trends and equity markets, particularly the S&P 500. As long as that correlation holds, BTC will be partially at the mercy of global monetary policy, risk sentiment, and liquidity flows. While rate cut expectations have helped risk assets bounce, any sharp reversal could cause renewed choppiness for Bitcoin.

Bitcoin Bull Market Outlook
From a data-driven perspective, Bitcoin looks increasingly well-positioned for a sustained continuation of its bull cycle. On-chain metrics paint a compelling picture of resilience for the Bitcoin bull market. The Net Unrealized Profit and Loss (NUPL) has shifted from “Anxiety” during the dip to the “Belief” zone after the rebound—a transition often seen at macro higher lows. Similarly, the Value Days Destroyed (VDD) Multiple has reset to levels signaling conviction among long-term holders, echoing patterns before Bitcoin’s rallies in 2016/17 and 2020/21. These metrics point to structural strength, bolstered by long-term holders aggressively accumulating supply below $80,000.
Further supporting this, the Hash Ribbons indicator’s recent bullish crossover reflects growing miner confidence in Bitcoin’s profitability, a reliable sign of trend reversals historically. This accumulation phase suggests the Bitcoin bull market may be gearing up for a supply squeeze, a dynamic that has fueled parabolic moves before. The data collectively highlights resilience, not weakness, as long-term holders seize the dip as an opportunity. Yet, this strength hinges on more than just on-chain signals—external factors will play a critical role in what comes next.
However, macro conditions still warrant caution, as the Bitcoin bull market doesn’t operate in isolation. Bull markets take time to build momentum, often needing steady accumulation and favorable conditions to ignite the next leg higher. While the local bottom between $76K–$77K seems to hold, the path forward won’t likely feature vertical candles of peak euphoria yet. Bitcoin’s tie to the S&P 500 and global liquidity trends means volatility could emerge from shifts in monetary policy or risk sentiment.
For example, while rate cut expectations have lifted risk assets, an abrupt reversal—perhaps from inflation spikes or geopolitical shocks—could test Bitcoin’s stability. Thus, even with on-chain data signaling a robust setup, the next phase of the Bitcoin bull market will likely unfold in measured steps. Traders anticipating a return to six-figure prices will need patience as the market builds its foundation.
If you’re interested in more in-depth analysis and real-time data, consider checking out Bitcoin Magazine Pro for valuable insights into the Bitcoin market.
Disclaimer: This article is for informational purposes only and should not be considered financial advice. Always do your own research before making any investment decisions.
Source link
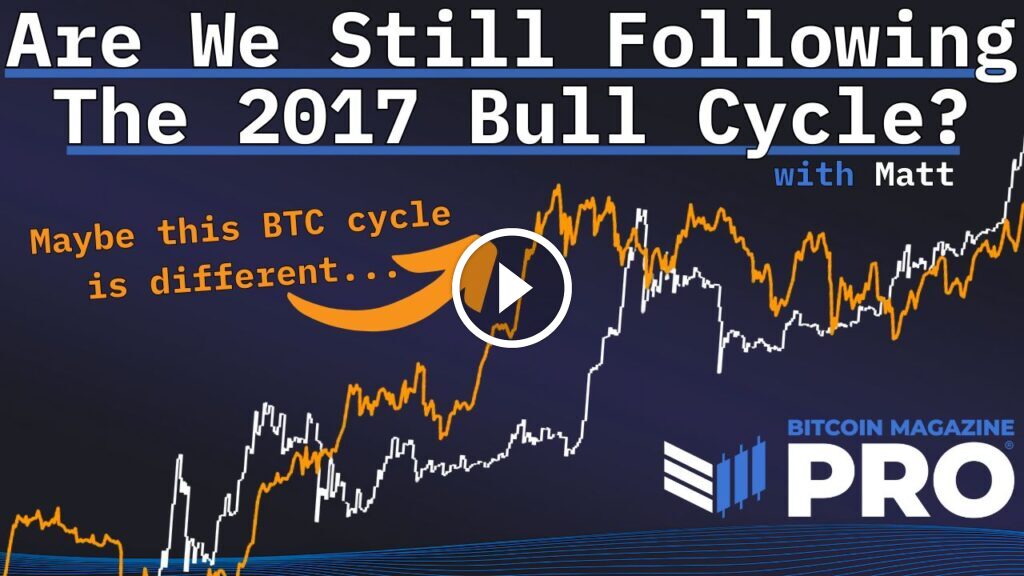
After reaching an all-time high above $100,000, the Bitcoin price has entered a multi-week downtrend. This correction has naturally raised questions about whether Bitcoin is still aligned with the 2017 bull cycle. Here we’ll analyze the data to assess how closely Bitcoin’s current price action correlates with previous bull markets, and what we can expect next for BTC.
Bitcoin Price Trends in 2025 vs. 2017 Bull Cycle
Bitcoin’s price trajectory since the cycle lows set during the 2022 bear market has shown remarkable similarities to the 2015–2017 cycle, the bull market that culminated in Bitcoin reaching $20,000 in December 2017. However, Bitcoin’s recent downtrend marks the first major divergence from the 2017 pattern. If Bitcoin were still tracking the 2017 cycle, it should have been rallying to new all-time highs over the past month, instead, Bitcoin has been moving sideways and declining, suggesting that the correlation may be weakening.

Despite the recent divergence, the historical correlation between Bitcoin’s current cycle and the 2017 cycle remains surprisingly high. The correlation between the current cycle and the 2015–2017 cycle was around 92% earlier this year. The recent price divergence has reduced the correlation slightly to 91%, still an extremely high figure for financial markets.
How Bitcoin Market Behavior Echoes 2017 Cycle Patterns
The MVRV Ratio is a key indicator of investor behavior. It measures the relationship between Bitcoin’s current market price and the average cost basis of all BTC held on the network. When the MVRV ratio rises sharply, it indicates that investors are sitting on significant unrealized profits, a condition that often precedes market tops. When the ratio declines toward the realized price, it signals that Bitcoin is trading close to the average acquisition price of investors, often marking a bottoming phase.

The recent decline in the MVRV ratio reflects Bitcoin’s correction from all-time highs, however, the MVRV ratio remains structurally similar to the 2017 cycle with an early bull market rally, followed by multiple sharp corrections, and as such, the correlation remains at 80%.
Bitcoin Price Correlation with 2017 Bull Cycle Data
One possible explanation for the recent divergence is the influence of data lag. For example, Bitcoin’s price action has shown a strong correlation with Global Liquidity, the total supply of money in major economies; however, historical analysis shows that changes in liquidity often take around 2 months to reflect in Bitcoin’s price action.

By applying a 30-day lag to Bitcoin’s price action relative to the 2017 cycle, the correlation increases to 93%, which would be the highest recorded correlation between the two cycles. The lag-adjusted pattern suggests that Bitcoin could soon resume the 2017 trajectory, implying that a major rally could be on the horizon.

What 2017 Bull Cycle Signals Mean for Bitcoin Price Today
History may not repeat itself, but it often rhymes. Bitcoin’s current cycle may not deliver 2017-style exponential gains, but the underlying market psychology remains strikingly similar. If Bitcoin resumes its correlation with the lagging 2017 cycle, the historical precedent suggests that Bitcoin could soon recover from the current correction, and a sharp upward move could follow.
Explore live data, charts, indicators, and in-depth research to stay ahead of Bitcoin’s price action at Bitcoin Magazine Pro.
Disclaimer: This article is for informational purposes only and should not be considered financial advice. Always do your own research before making any investment decisions.
Source link

Bitcoin Holds The Line—But Can It Bounce Back or Break Lower?

Markets close lower as Trump notes tariff problems and Fed flags recession risk

Here’s Why Ethereum (ETH) Is Underperforming This Market Cycle, According to Analyst Benjamin Cowen

US SEC Division Releases Guidance On Disclosure Requirements For Crypto Securities

CryptoPunks NFT Sells for $6 Million in Ethereum—At a $10 Million Loss

SEC drops suit against Helium for alleged securities violations

Tokenized Gold Nears $2B Market Cap as Tariff Fears Spark Safe Haven Trade

Ross Ulbricht To Speak At Bitcoin 2025

Solana Eyes $200 Target As It Gains Momentum – Recovery Could Mirror 3-Month Downtrend

BTC-denominated insurance firm meanwhile secures $40m in VC funding

‘You Want To Own the Most Hated Thing’ – Arthur Hayes Says Ethereum Set To Outrun Solana As Memecoin Craze Fades

Crypto Braces for a Hidden $4.5 Trillion Catalyst for Bitcoin, Ethereum, Cardano, XRP Price

Block Agrees to $40M NYDFS Penalty Over Lackluster Compliance Program

Top Bitcoin miners produced nearly $800M of BTC in Q1 2025

Tariffs, Trade Tensions May Be Positive for Bitcoin (BTC) Adoption in Medium Term: Grayscale


 24/7 Cryptocurrency News5 months ago
Arthur Hayes, Murad’s Prediction For Meme Coins, AI & DeFi Coins For 2025

 Bitcoin3 months ago
Expert Sees Bitcoin Dipping To $50K While Bullish Signs Persist

 24/7 Cryptocurrency News3 months ago
Aptos Leverages Chainlink To Enhance Scalability and Data Access

 Bitcoin5 months ago
Bitcoin Could Rally to $80,000 on the Eve of US Elections

 Opinion5 months ago
Crypto’s Big Trump Gamble Is Risky

 Altcoins2 months ago
Sonic Now ‘Golden Standard’ of Layer-2s After Scaling Transactions to 16,000+ per Second, Says Andre Cronje

 Bitcoin5 months ago
Institutional Investors Go All In on Crypto as 57% Plan to Boost Allocations as Bull Run Heats Up, Sygnum Survey Reveals

 Price analysis5 months ago
Ripple-SEC Case Ends, But These 3 Rivals Could Jump 500x
