Aave
Is Aave on the brink of a breakout or pullback?
Published
5 months agoon
By
admin
Aave (AAVE) has surged by 64.7% in less than a month. With such a strong rally, the question now is whether AAVE can continue its upward momentum or if it faces a potential pullback. In this week’s analysis, we examine the key technical indicators, resistance levels, and strategic considerations to determine the most likely direction for AAVE in the coming days.
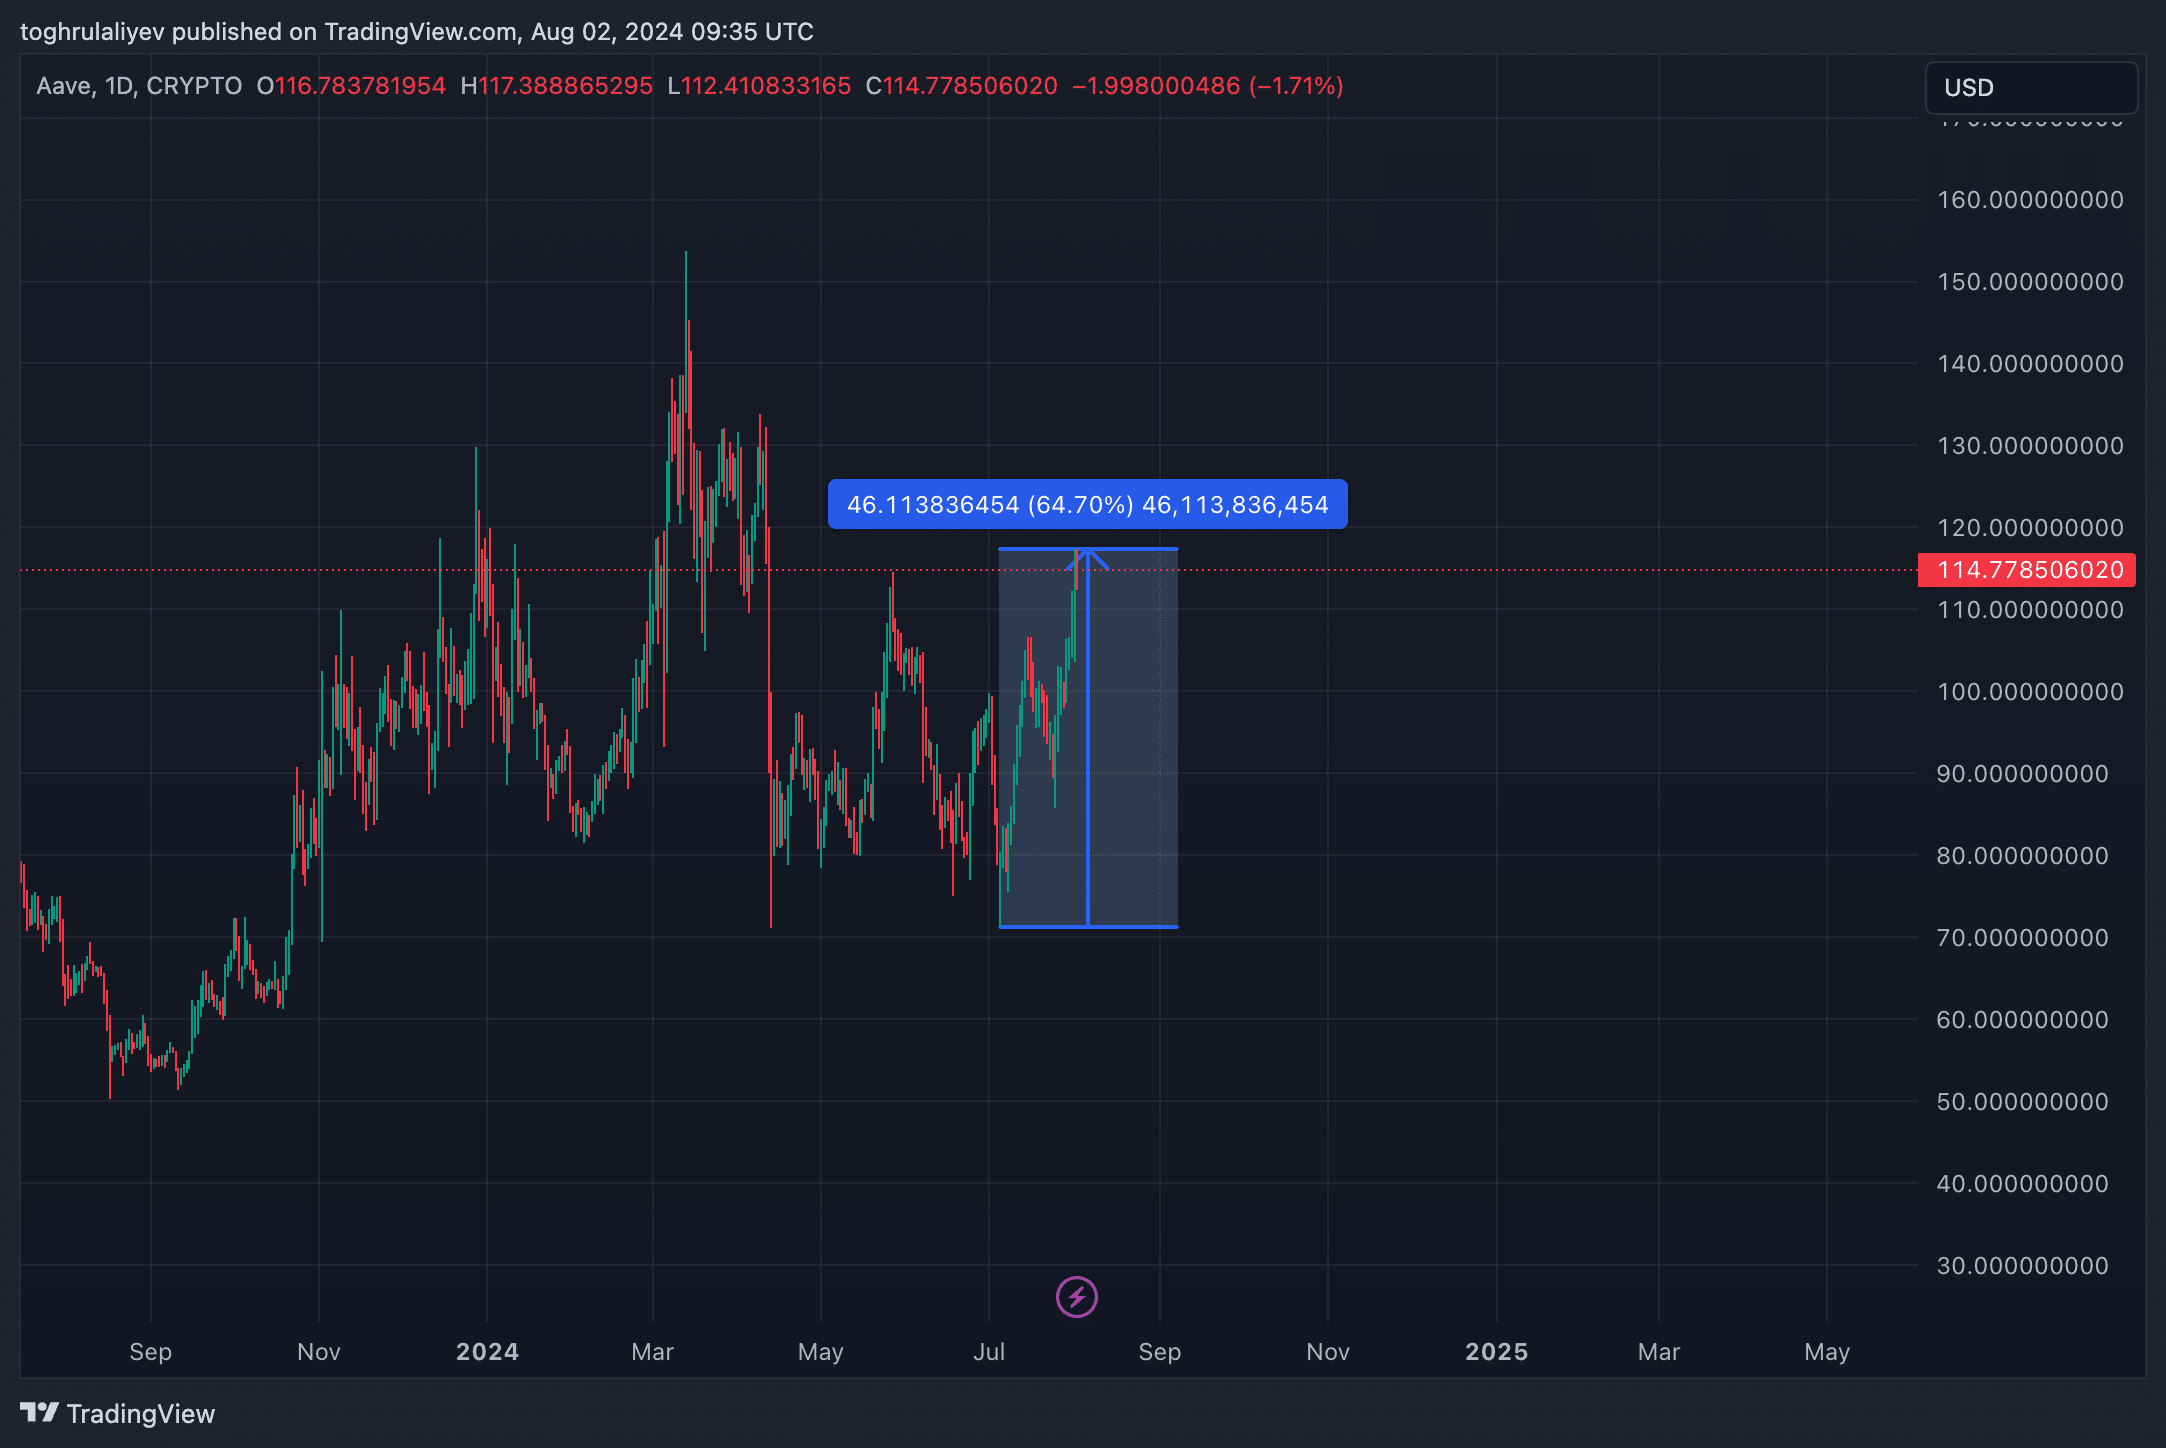
Resistance and support analysis
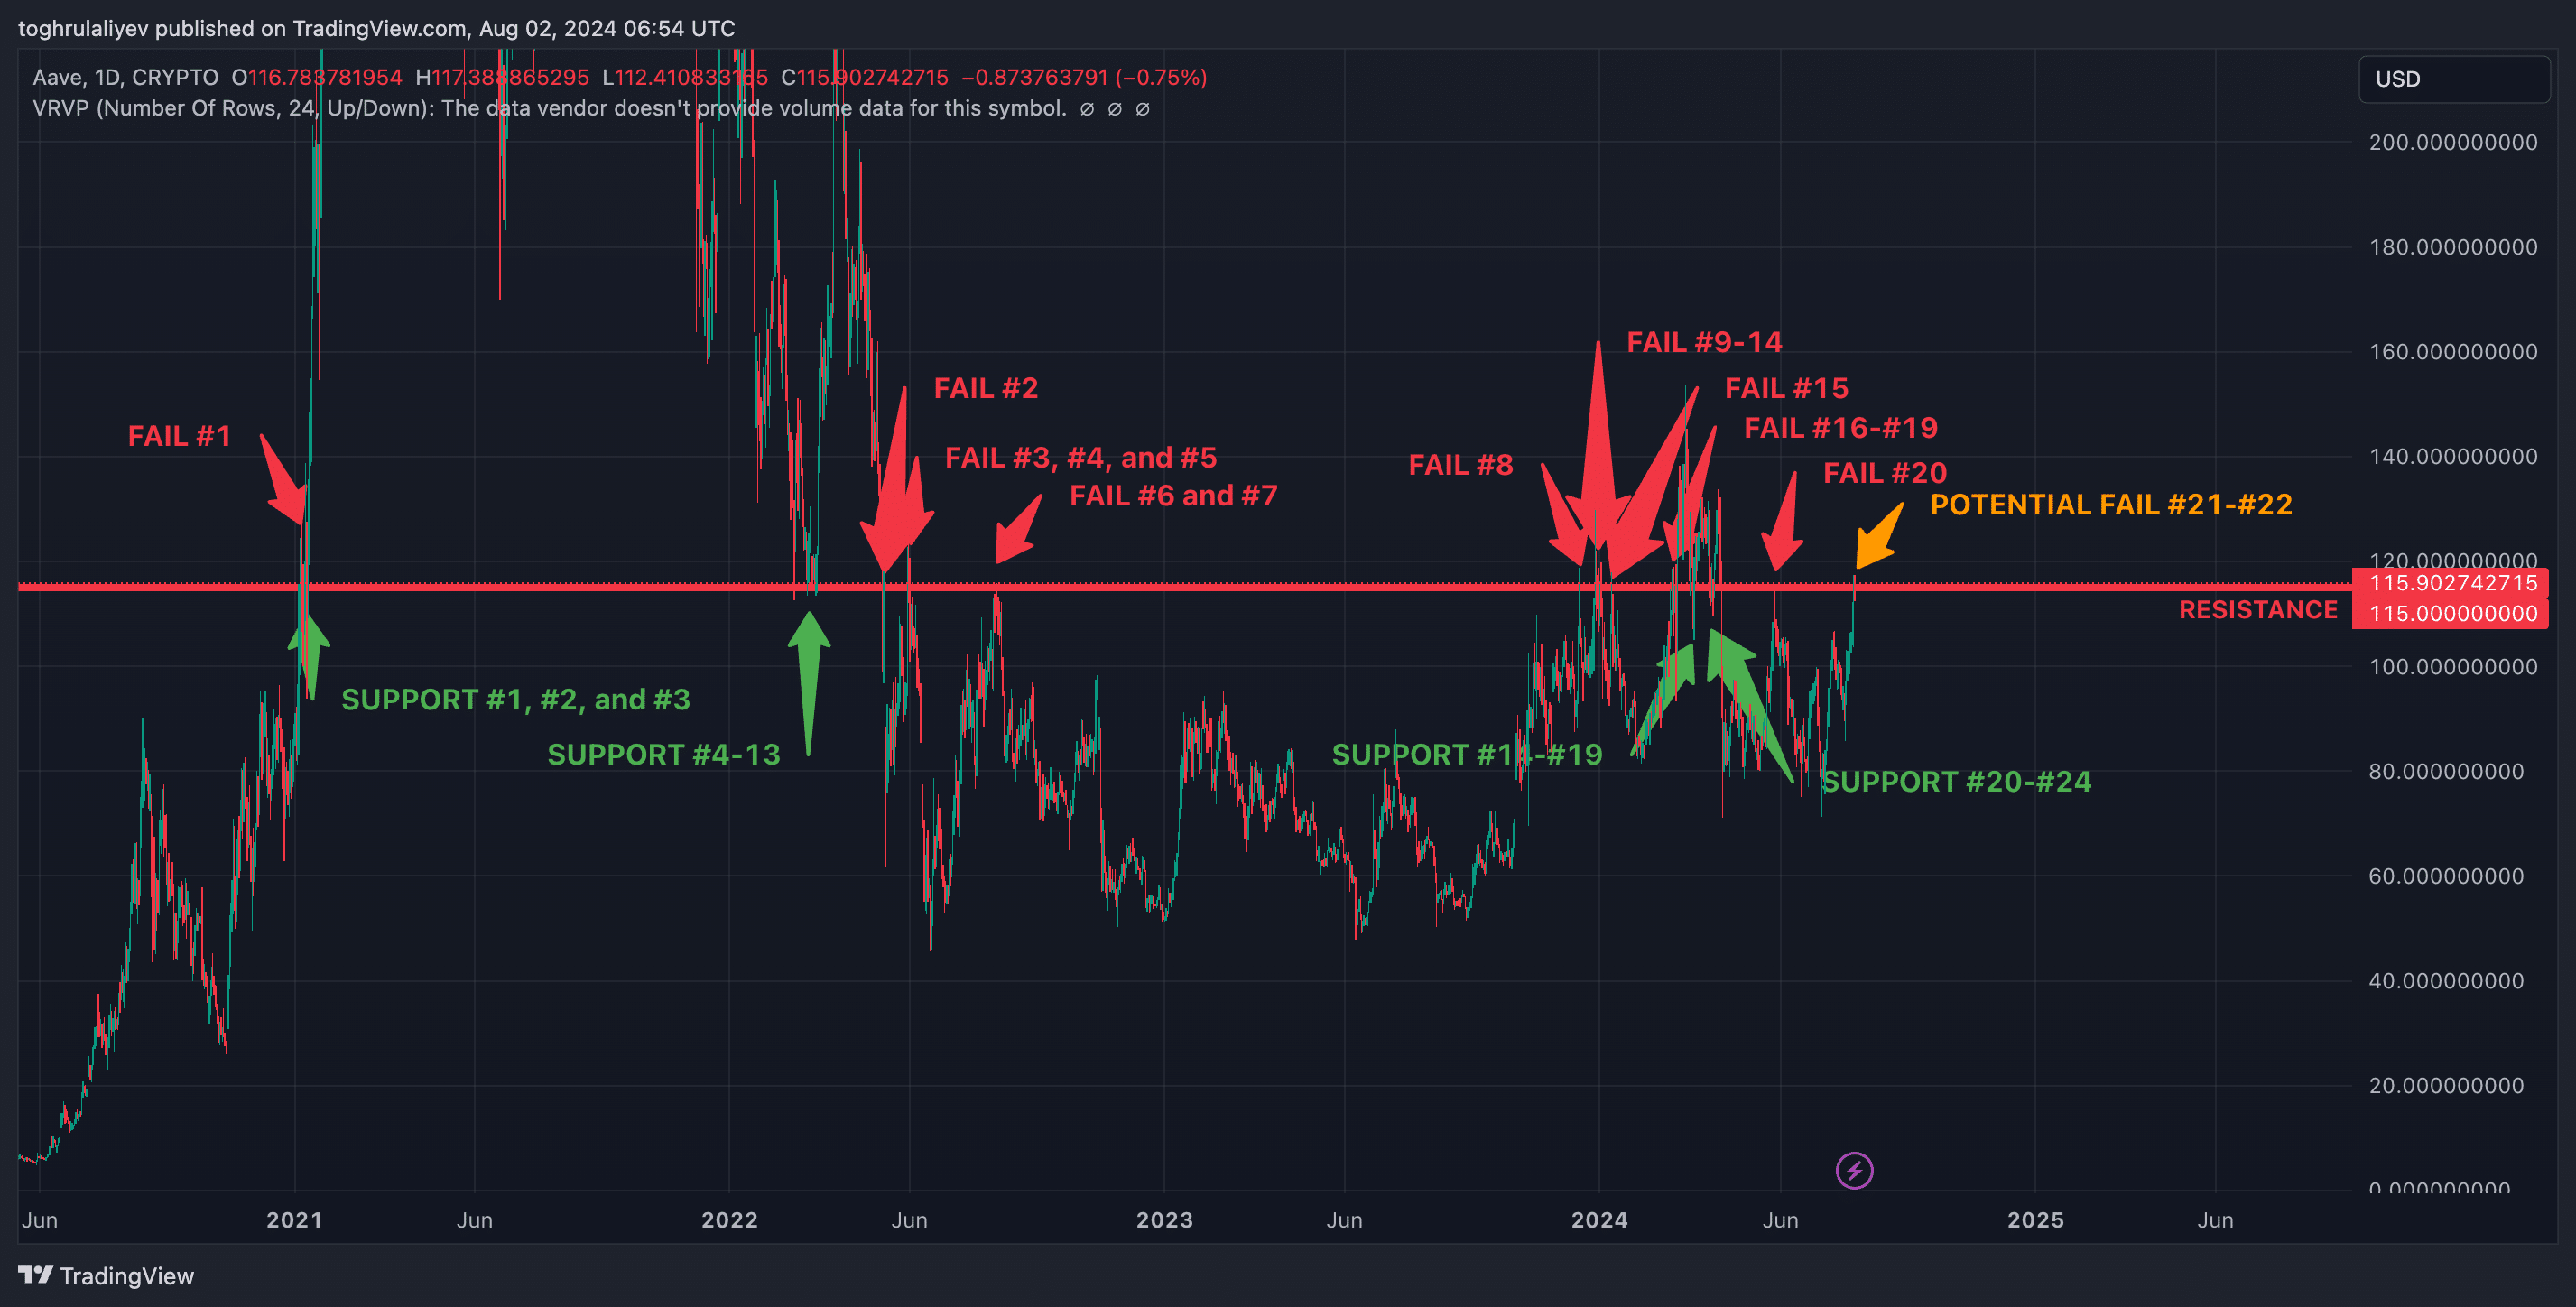
Aave (AAVE) faces a critical juncture as it approaches a very strong resistance level at $115. This level has a significant history, having acted as resistance 20 times and support 24 times in the past. The price currently hovers around this key level, and the market is closely watching to see if Aave (AAVE) will once again encounter resistance for the 21st and 22nd times or finally break through. However, signs suggest that it may be difficult to overcome this barrier.
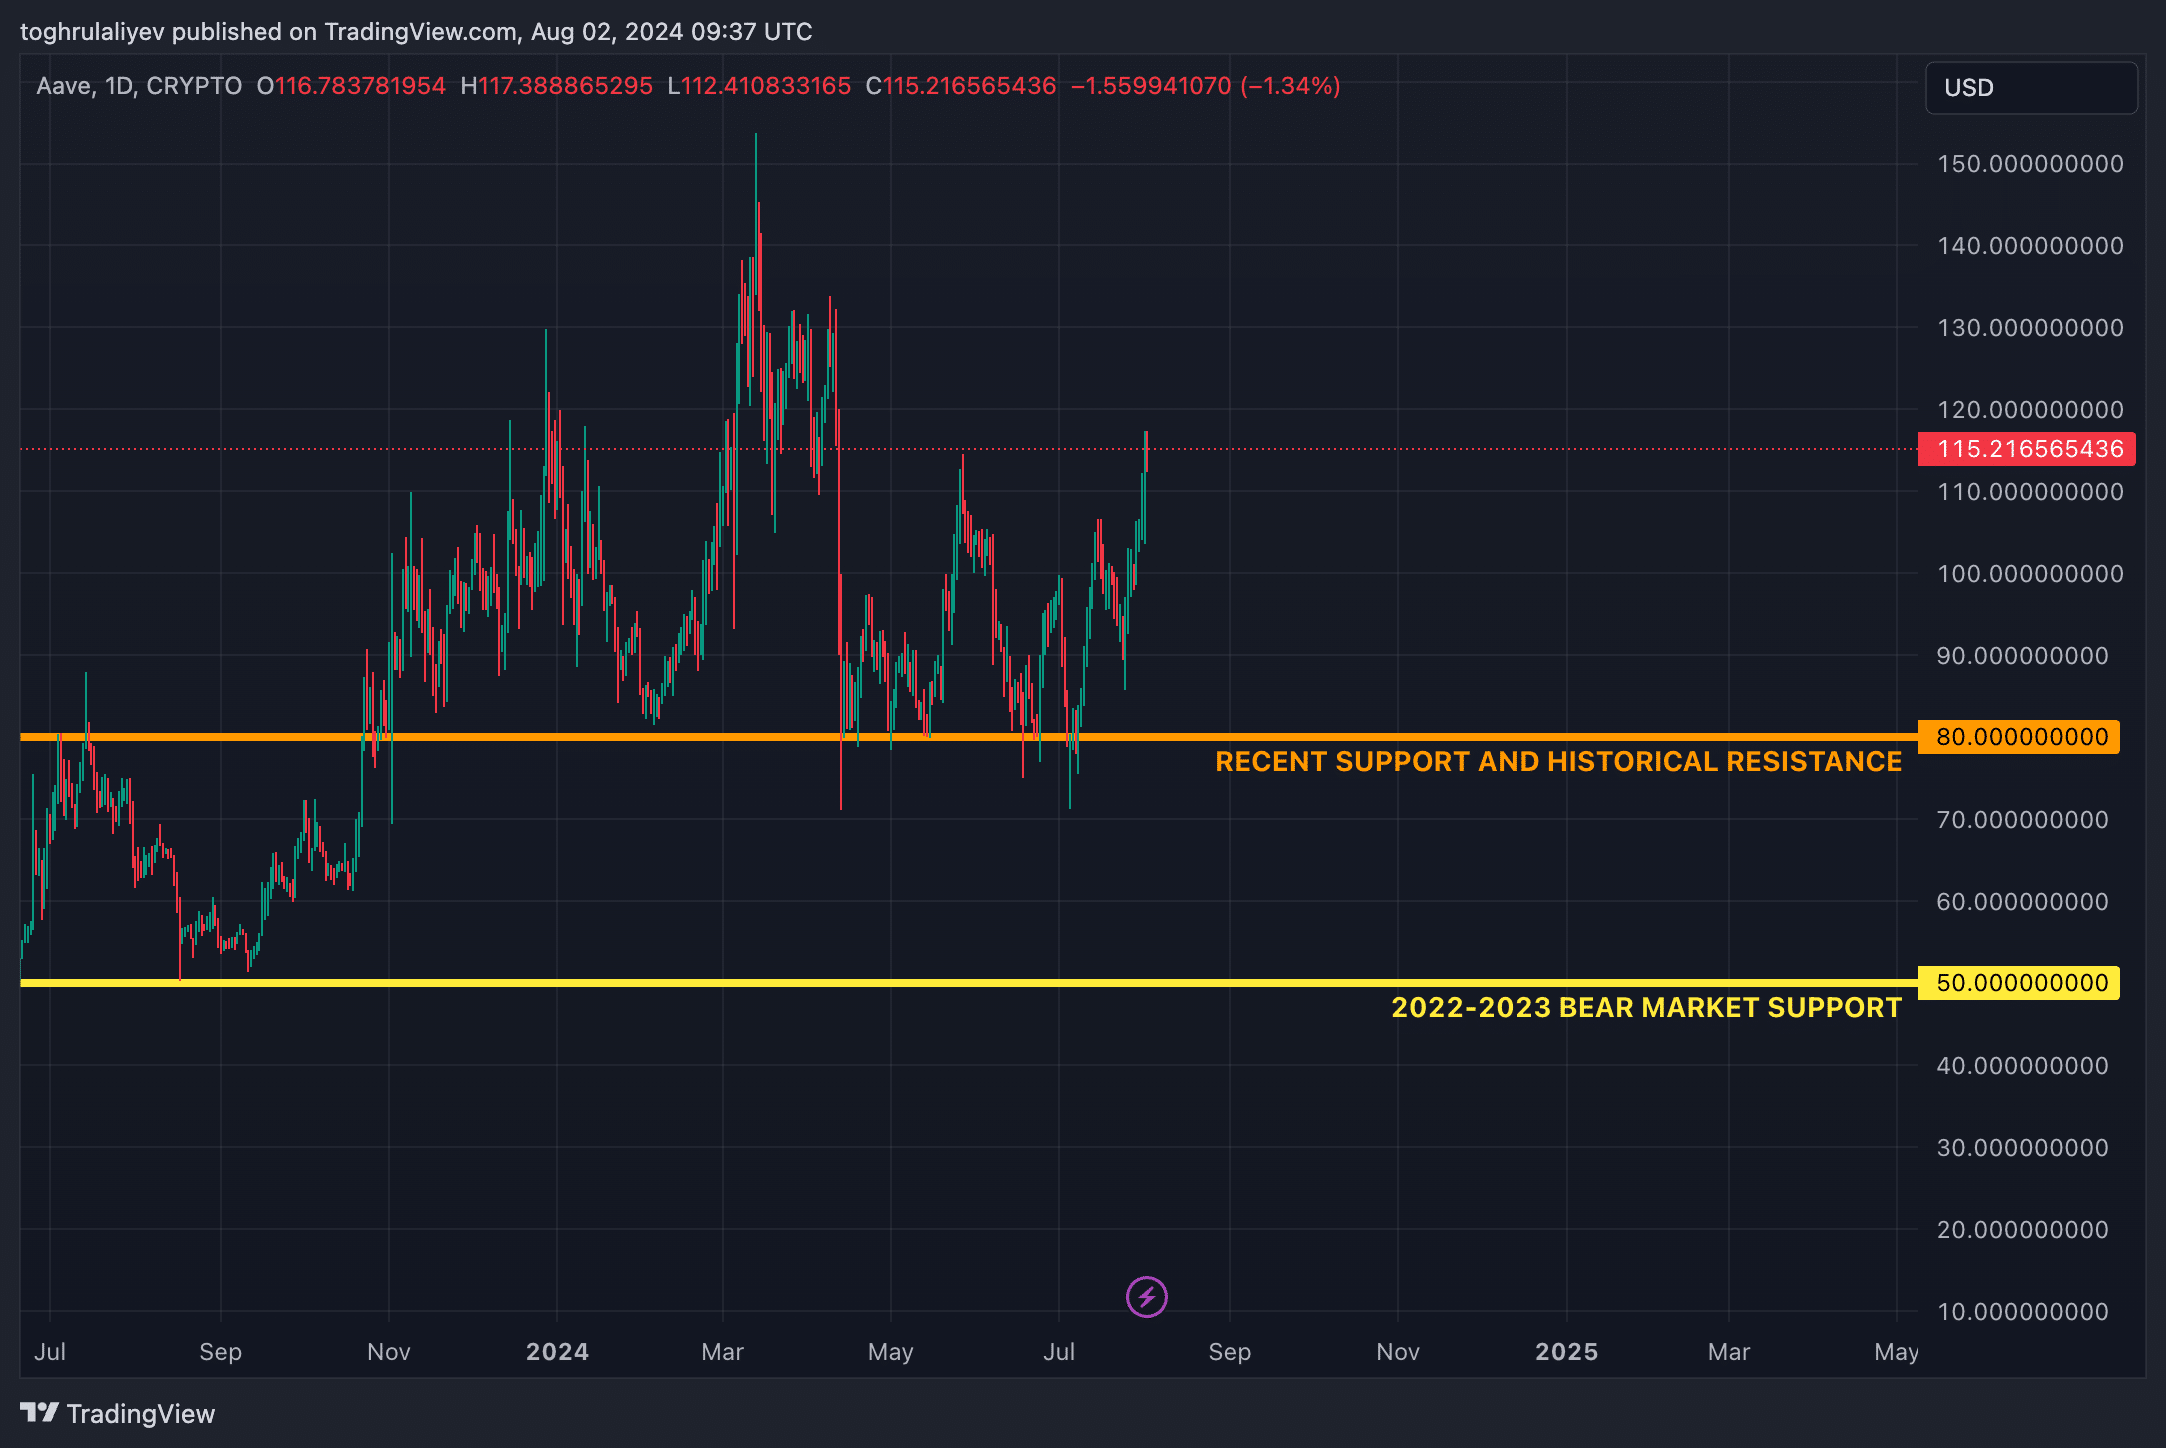
When examining historical support levels, two key areas stand out: the $80 mark and the $50 mark. While the $50 level served as support during the bear market, it seems unlikely that Aave (AAVE) will revisit this area in the current market conditions. On the other hand, the $80 level is a more recent occurrence and represents a support level worth keeping in mind as Aave’s (AAVE) price action unfolds.
Fibonacci retracements analysis
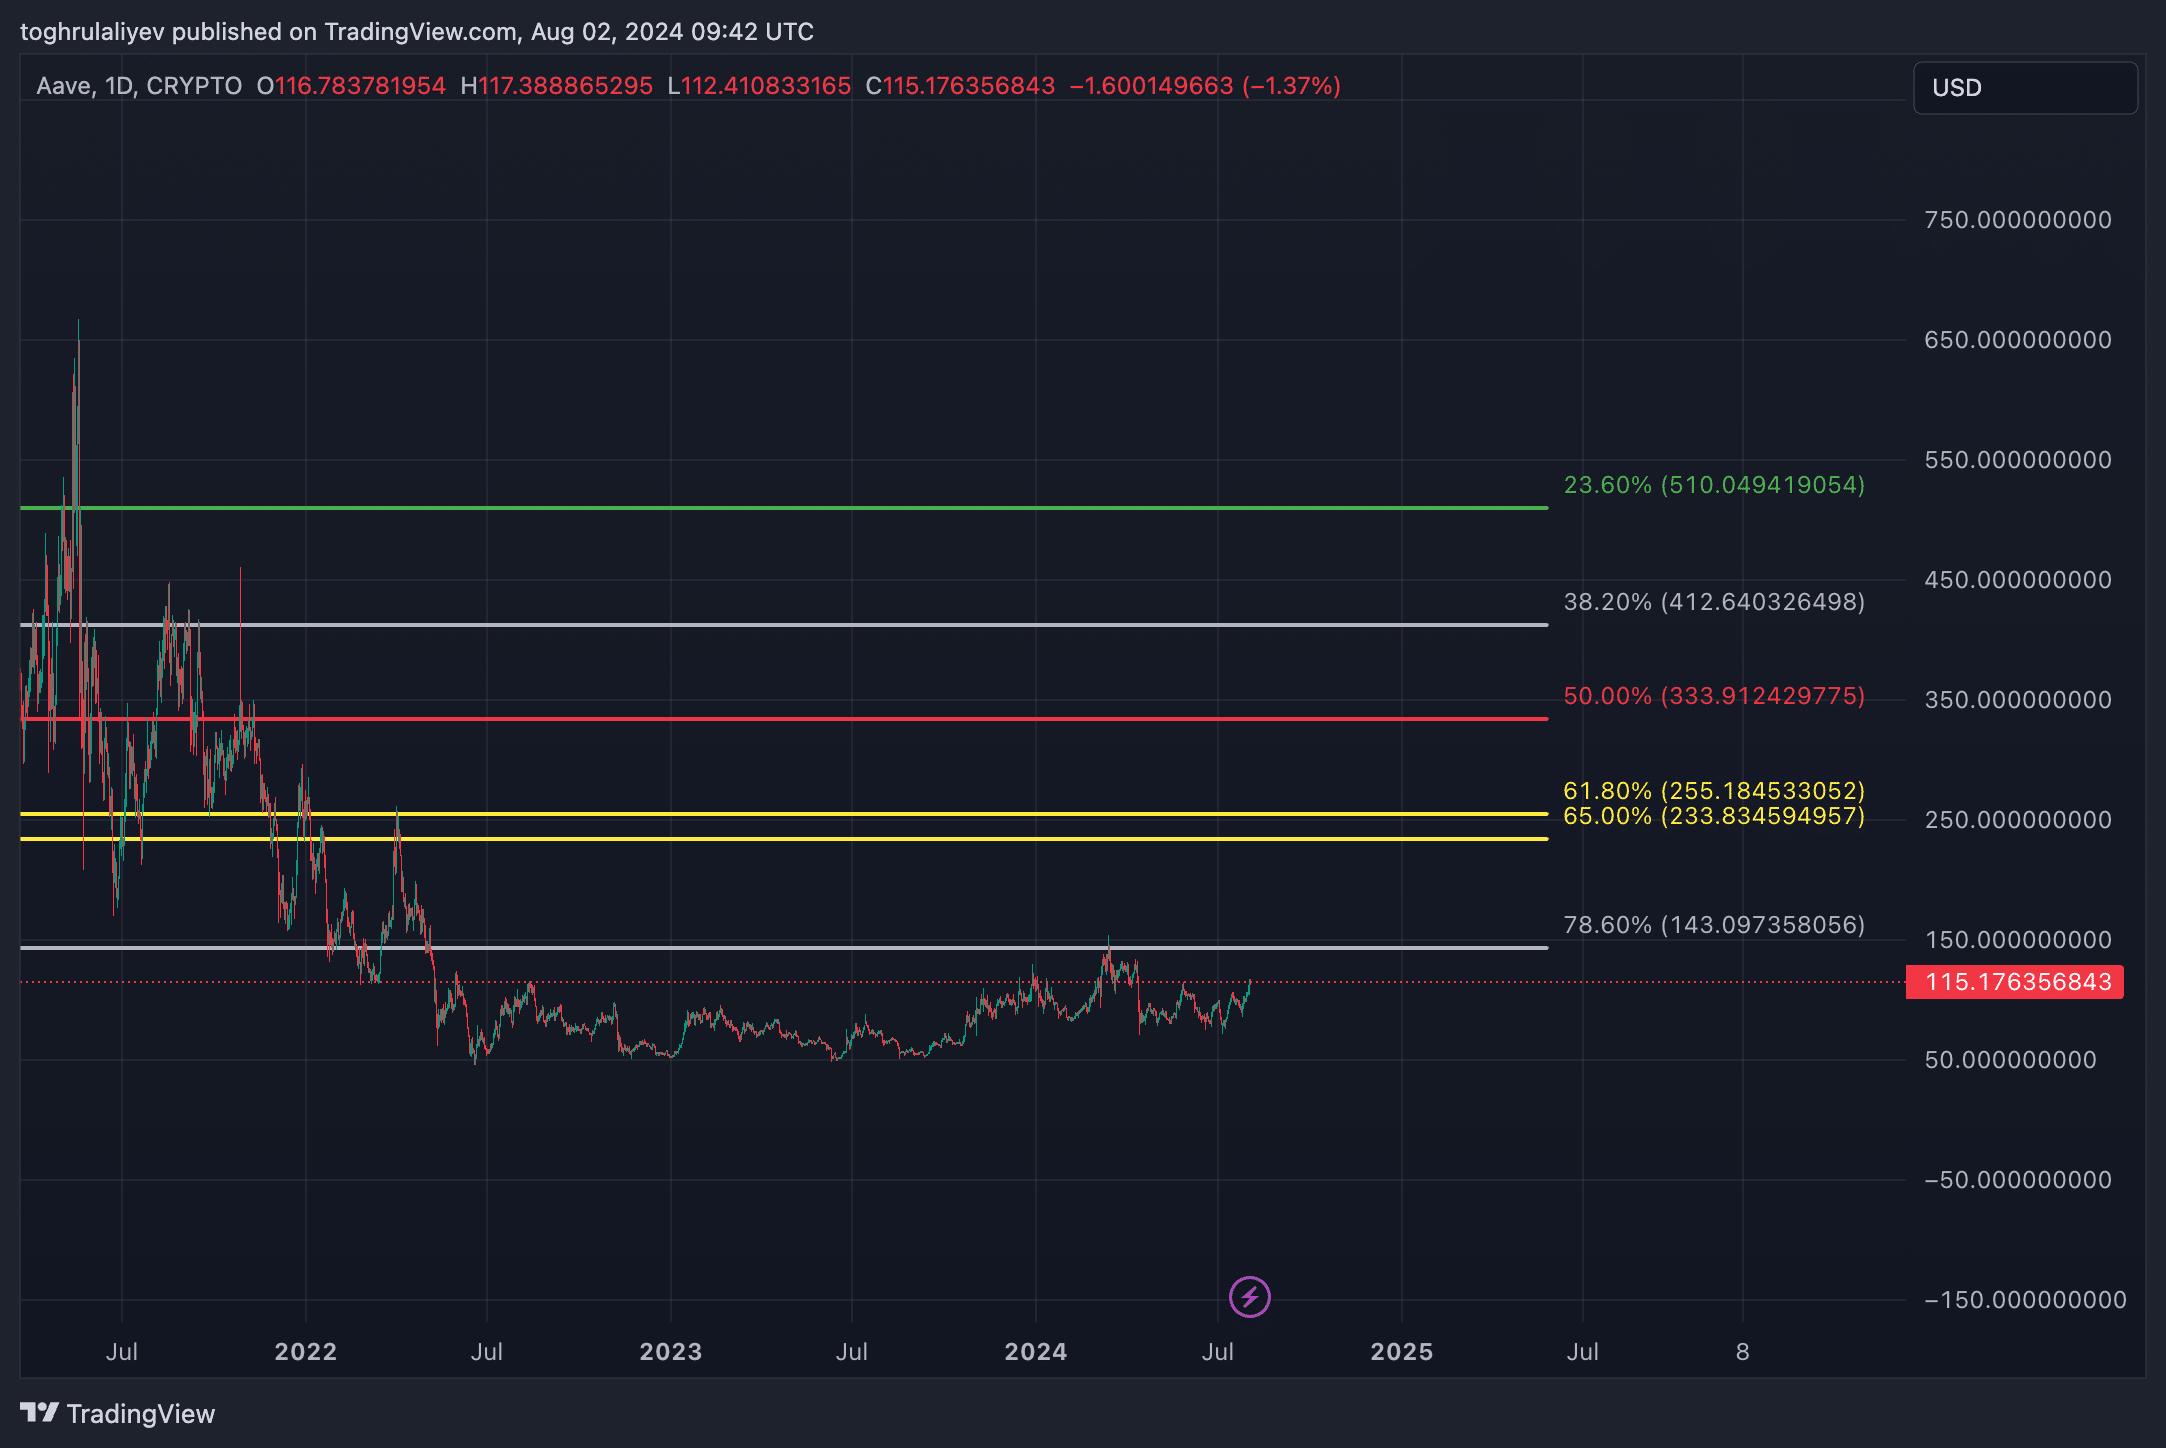
Looking at the macro Fibonacci retracement from the low in August 2019 to the high in May 2021, we observe a significant 78.6% retracement level at $143.09. The last time Aave (AAVE) approached this level was in March 2024, when it ultimately failed to break through. Should Aave (AAVE) succeed in surpassing its historical resistance at $115, the next logical profit target would likely be set at this $143.09 level.
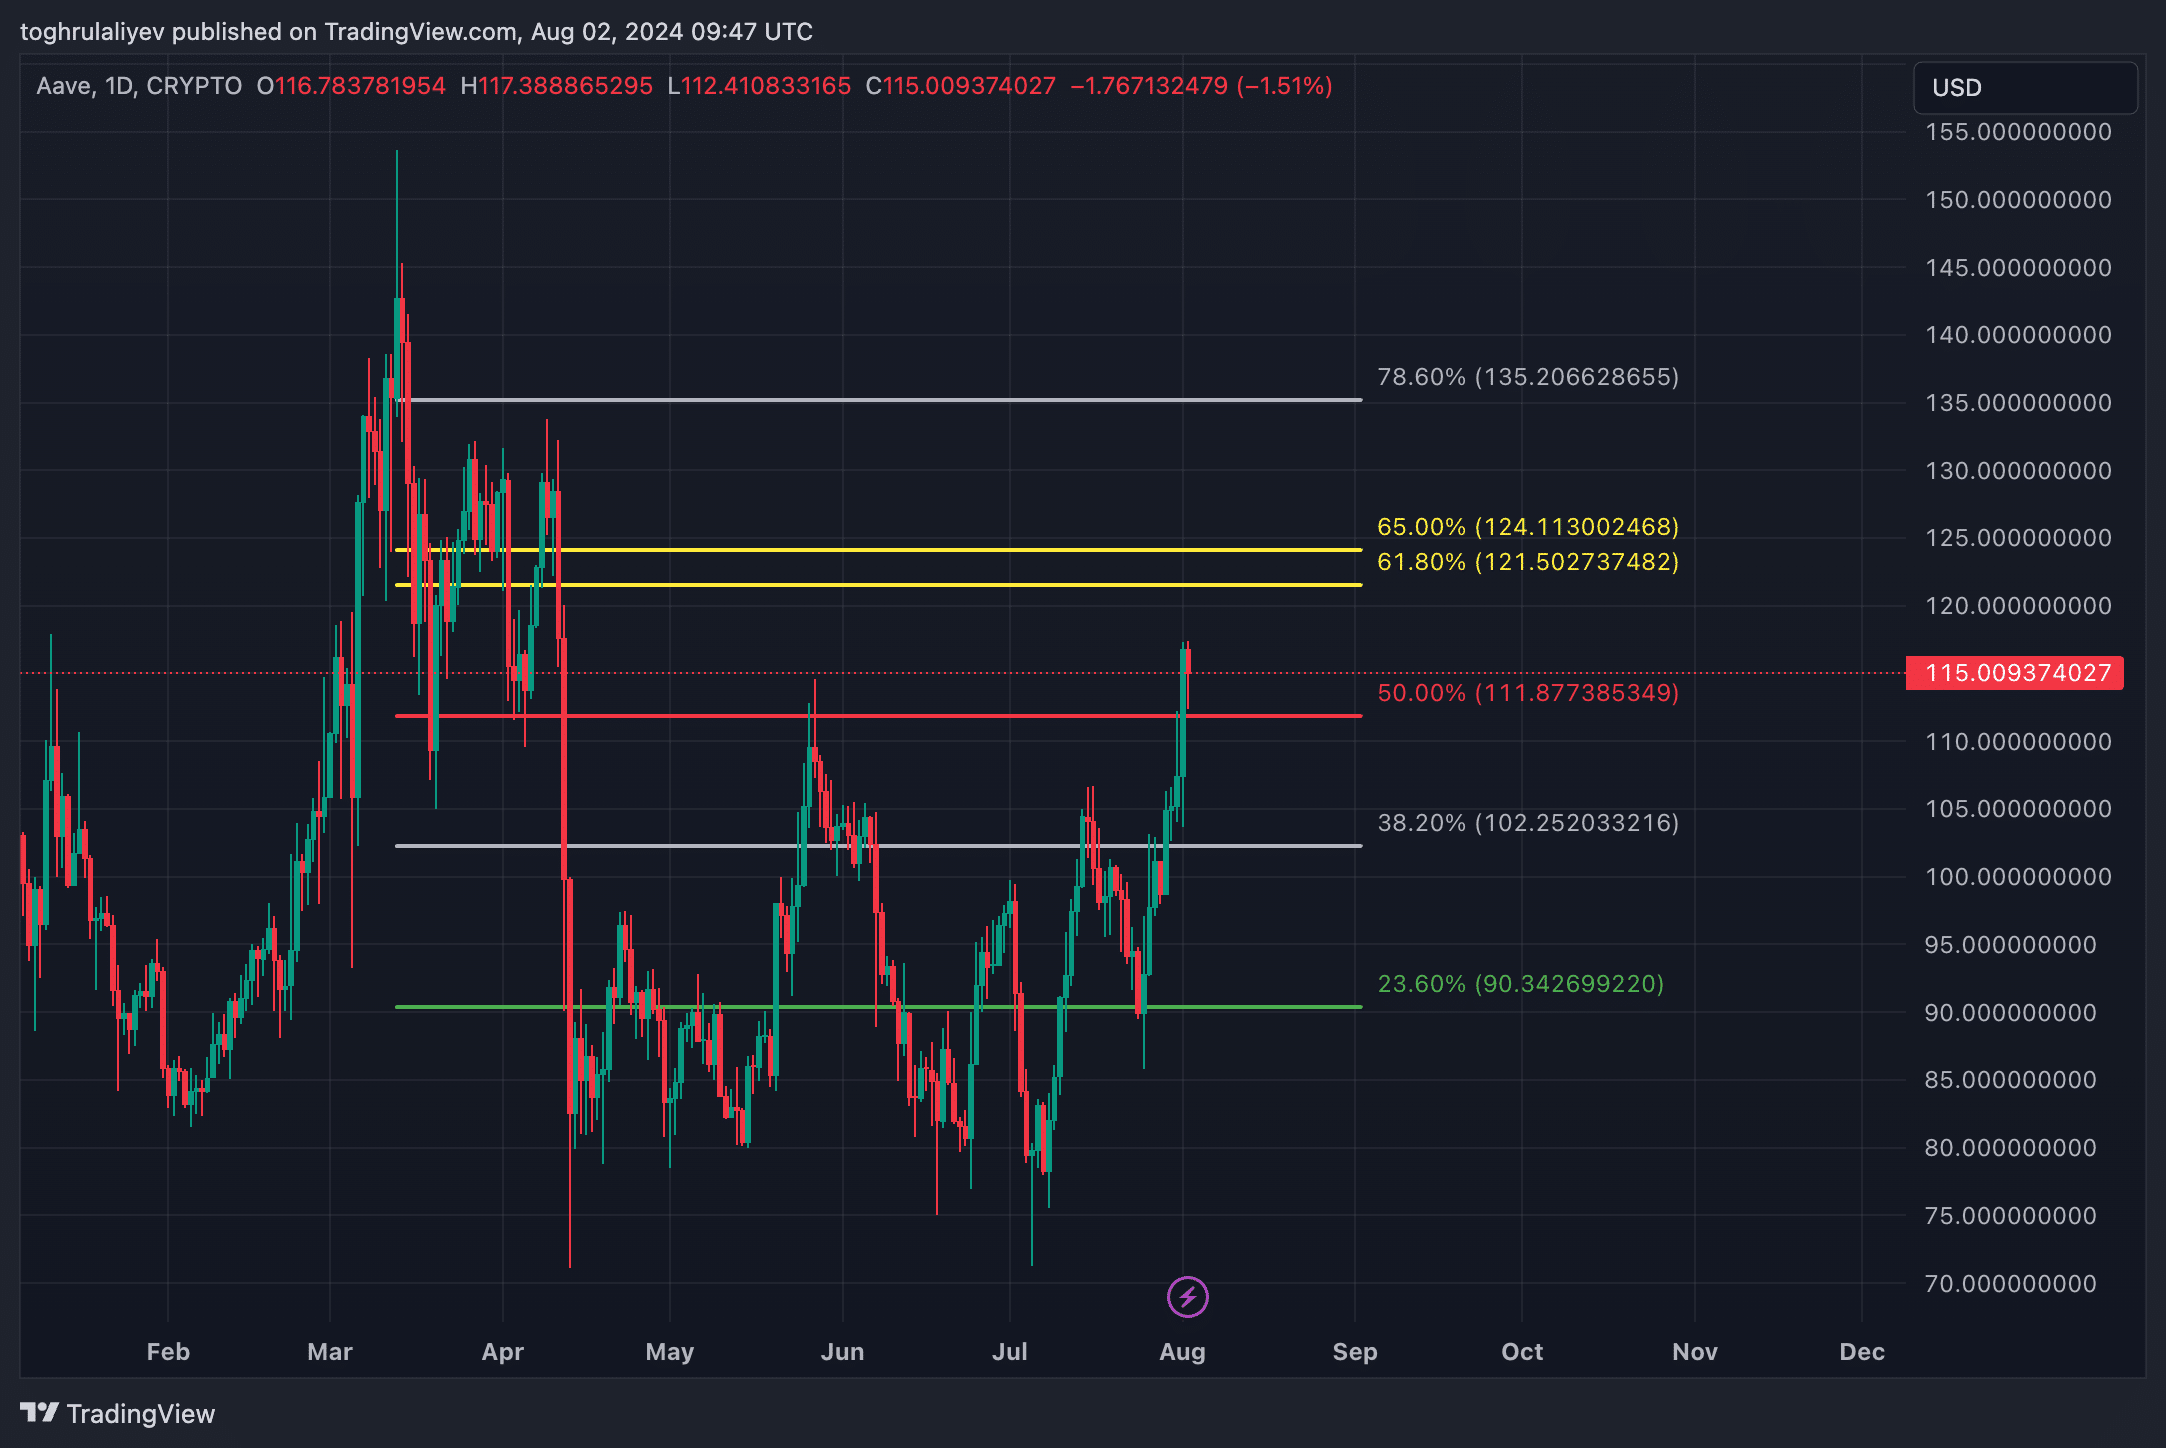
On a more positive note, when examining the Fibonacci retracement from the March 2024 high to the April 2024 low, Aave (AAVE) successfully breached the 23.6%, 38.2%, and 50% levels. It is now approaching the golden pocket, which lies between $121.50 and $124.11. If Aave (AAVE) manages to break above the $115 resistance, this golden pocket represents the next key area to watch. It is a strong, bullish zone with minimal resistance, making it a likely target for further upward movement.
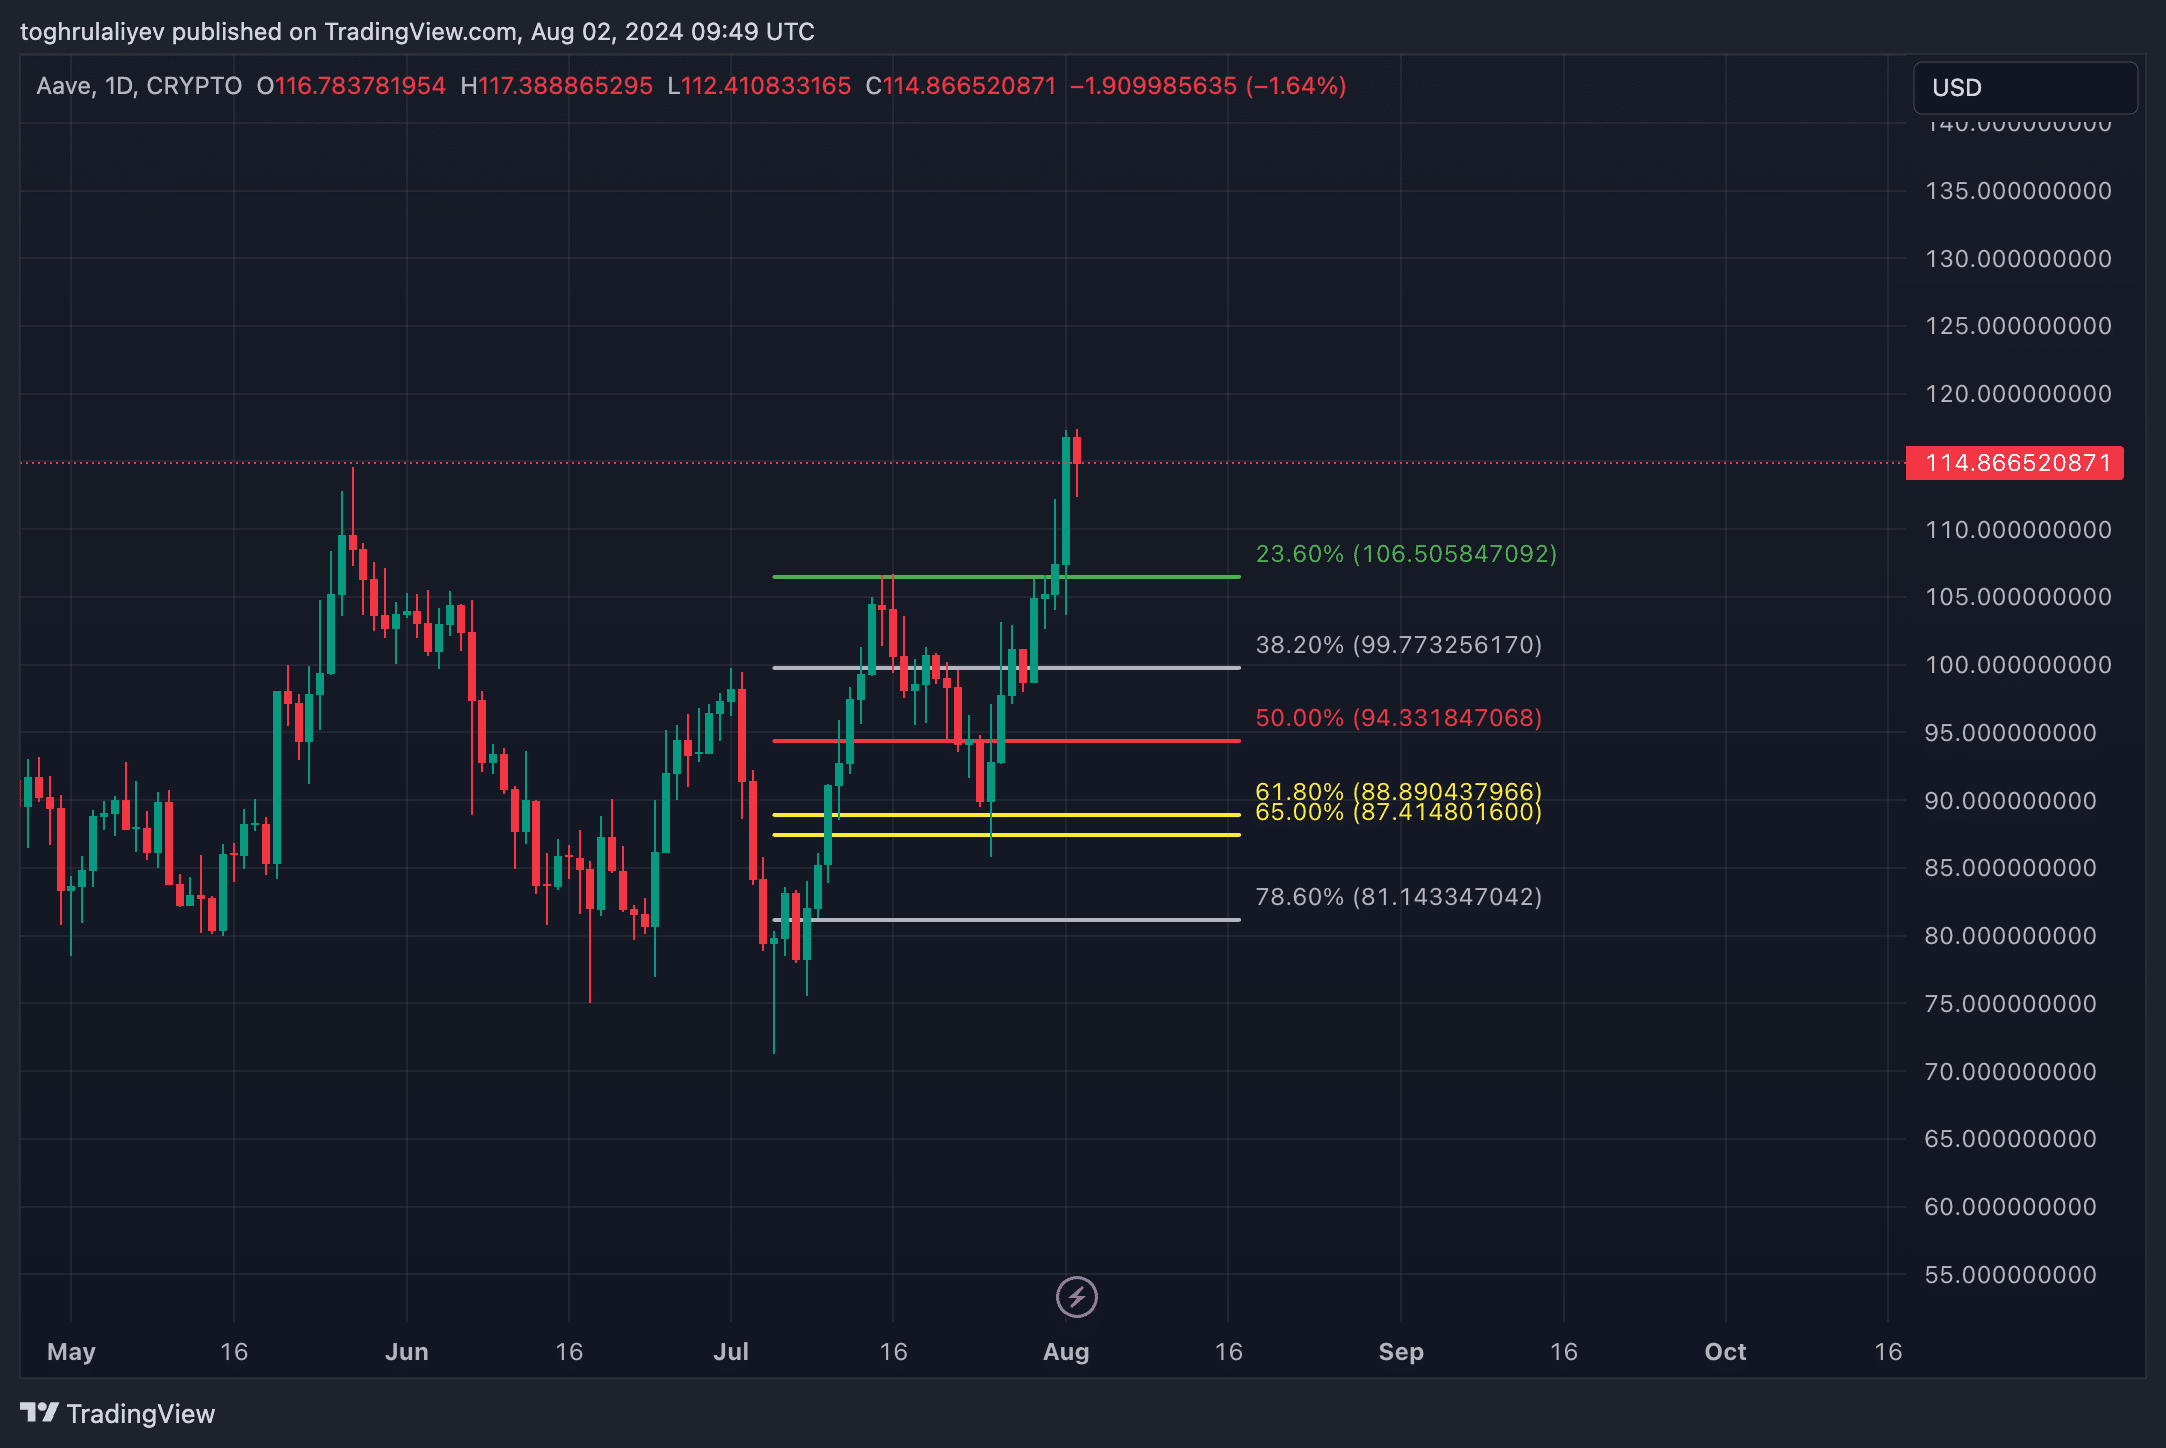
Lastly, when applying Fibonacci from the early July low to the present, we identify two potential levels where Aave (AAVE) might retrace if it fails to break through the $115 resistance. The first is the 23.6% level at $106.50, and the second is the 38.2% level at $99.77, which aligns closely with the psychological $100 mark.
Technical indicators
Bollinger Bands
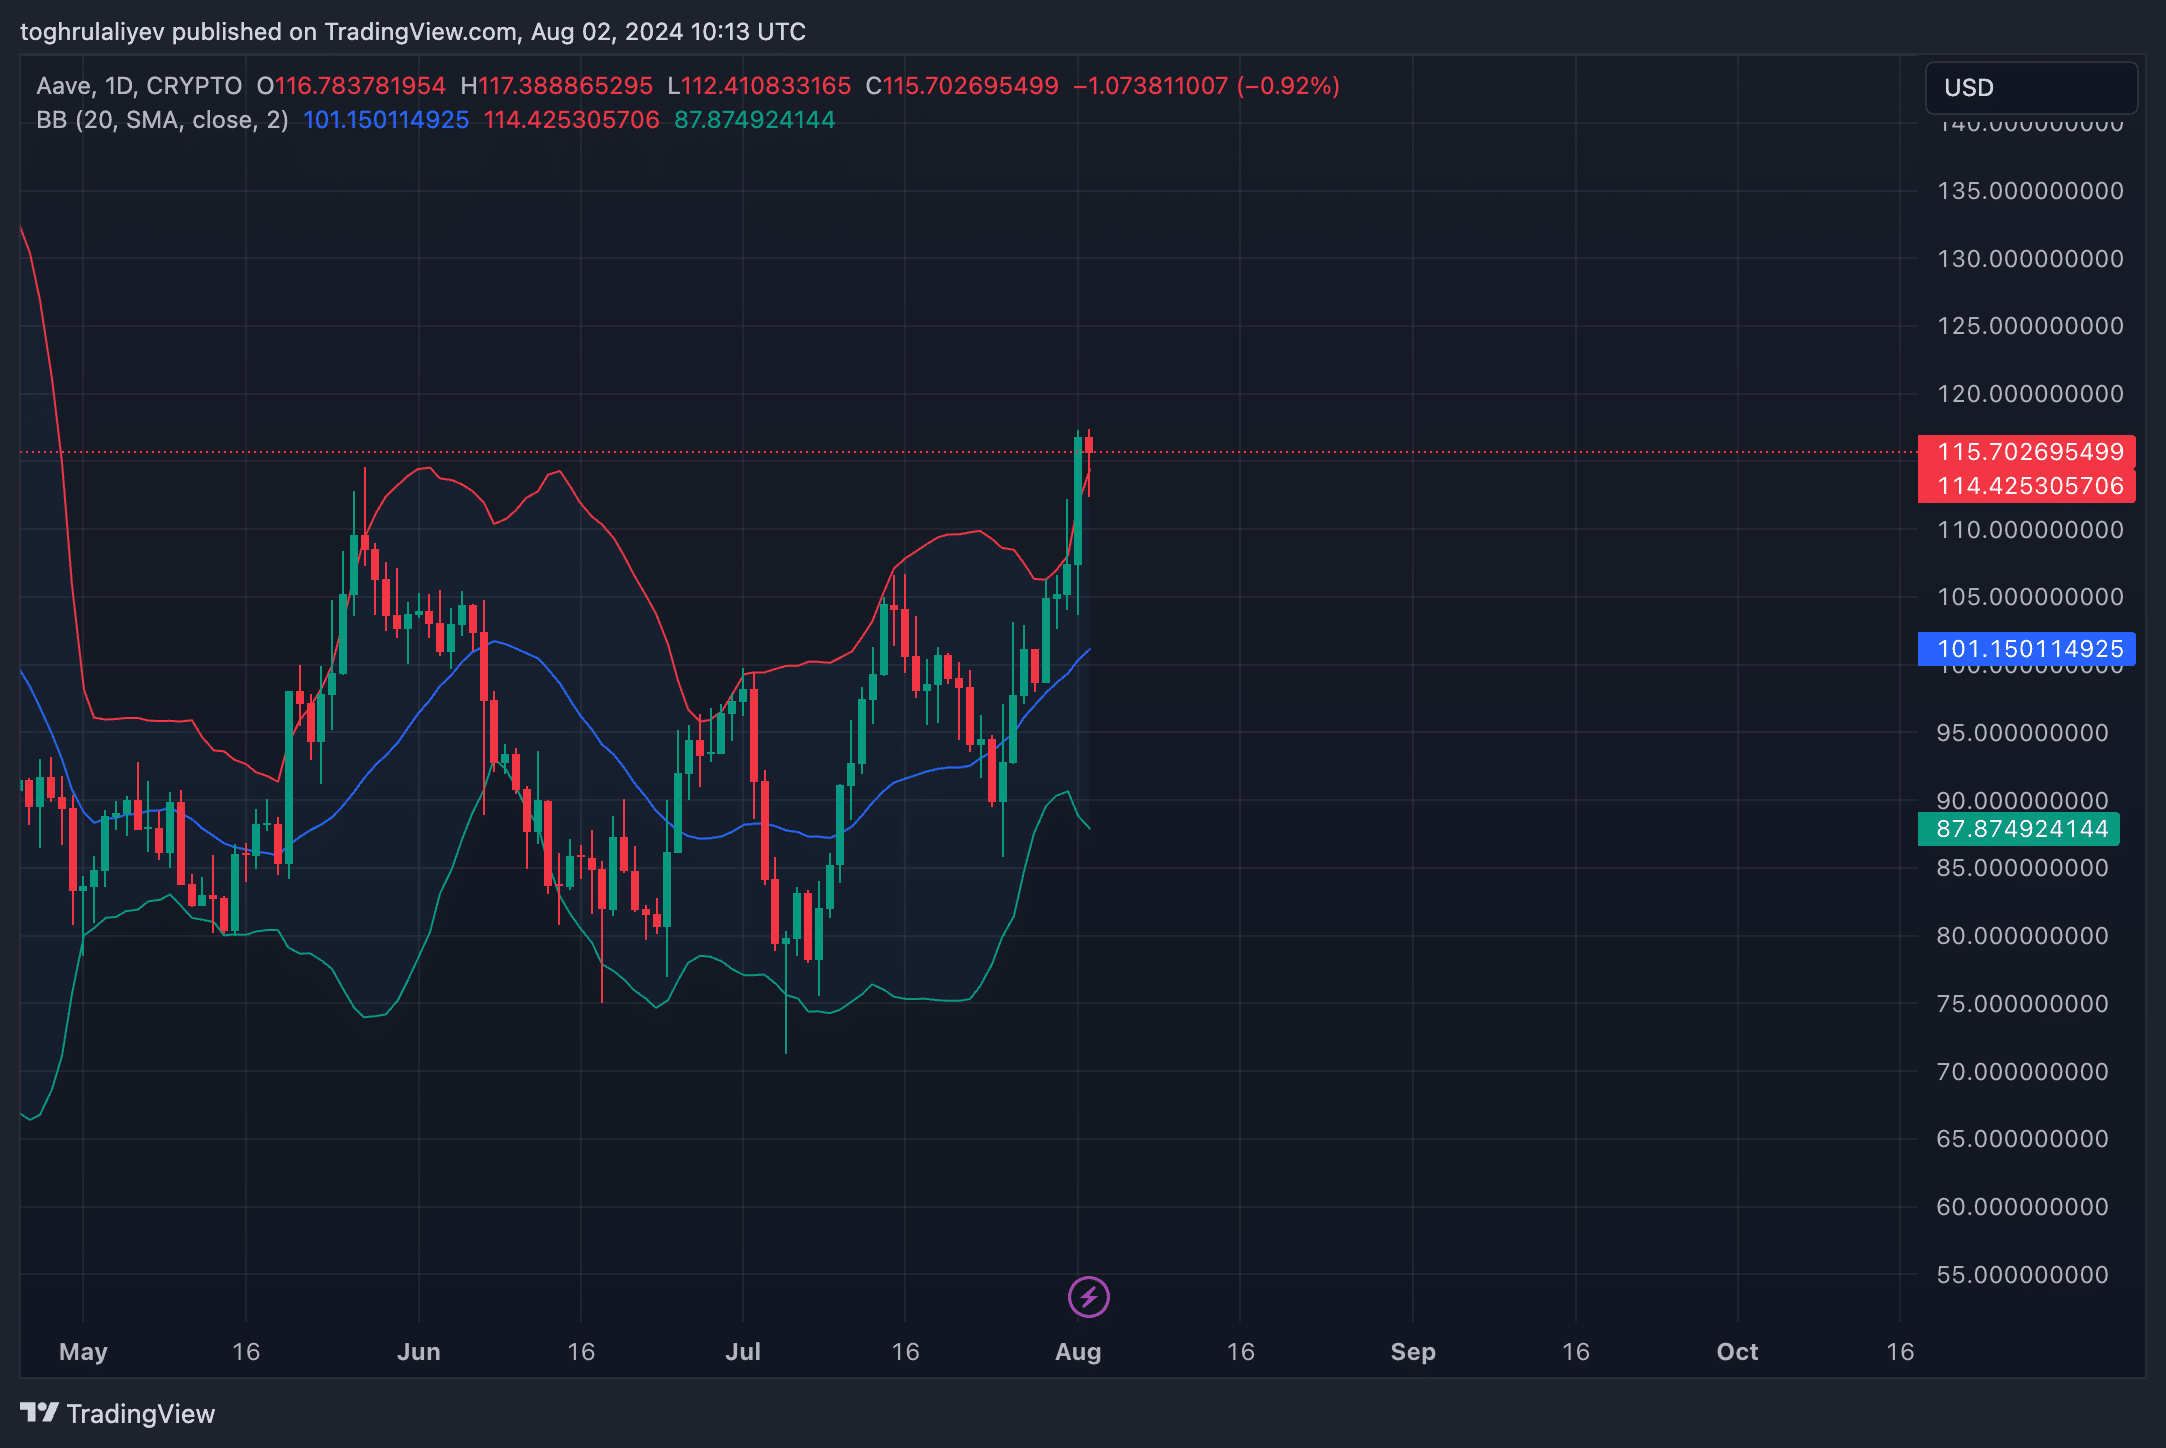
Aave’s (AAVE) recent price action has moved it above the upper Bollinger Band, indicating an overextension in the current uptrend. While trading above the middle band typically signifies a strong upward trend, the price being above the upper band often suggests that the asset is overbought. This positioning implies that the upper band is likely acting as a resistance level, making sustained movement at this level improbable. Given this, it is likely that Aave (AAVE) may experience a correction soon as the price reverts to a more sustainable level within the bands.
MACD
The Moving Average Convergence Divergence (MACD) histogram continues to grow and remains in the green, which signals increasing bullish momentum. The recent bullish crossover, where the MACD line has crossed above the signal line, also strengthens the case for continued upward movement in the near term.

RSI
On the other hand, the Relative Strength Index (RSI) is approaching the overbought territory, hovering near the 70 level. Historically, when Aave’s (AAVE) RSI has reached around 70, the bullish momentum has often stalled and led to a pullback.

Strategic considerations
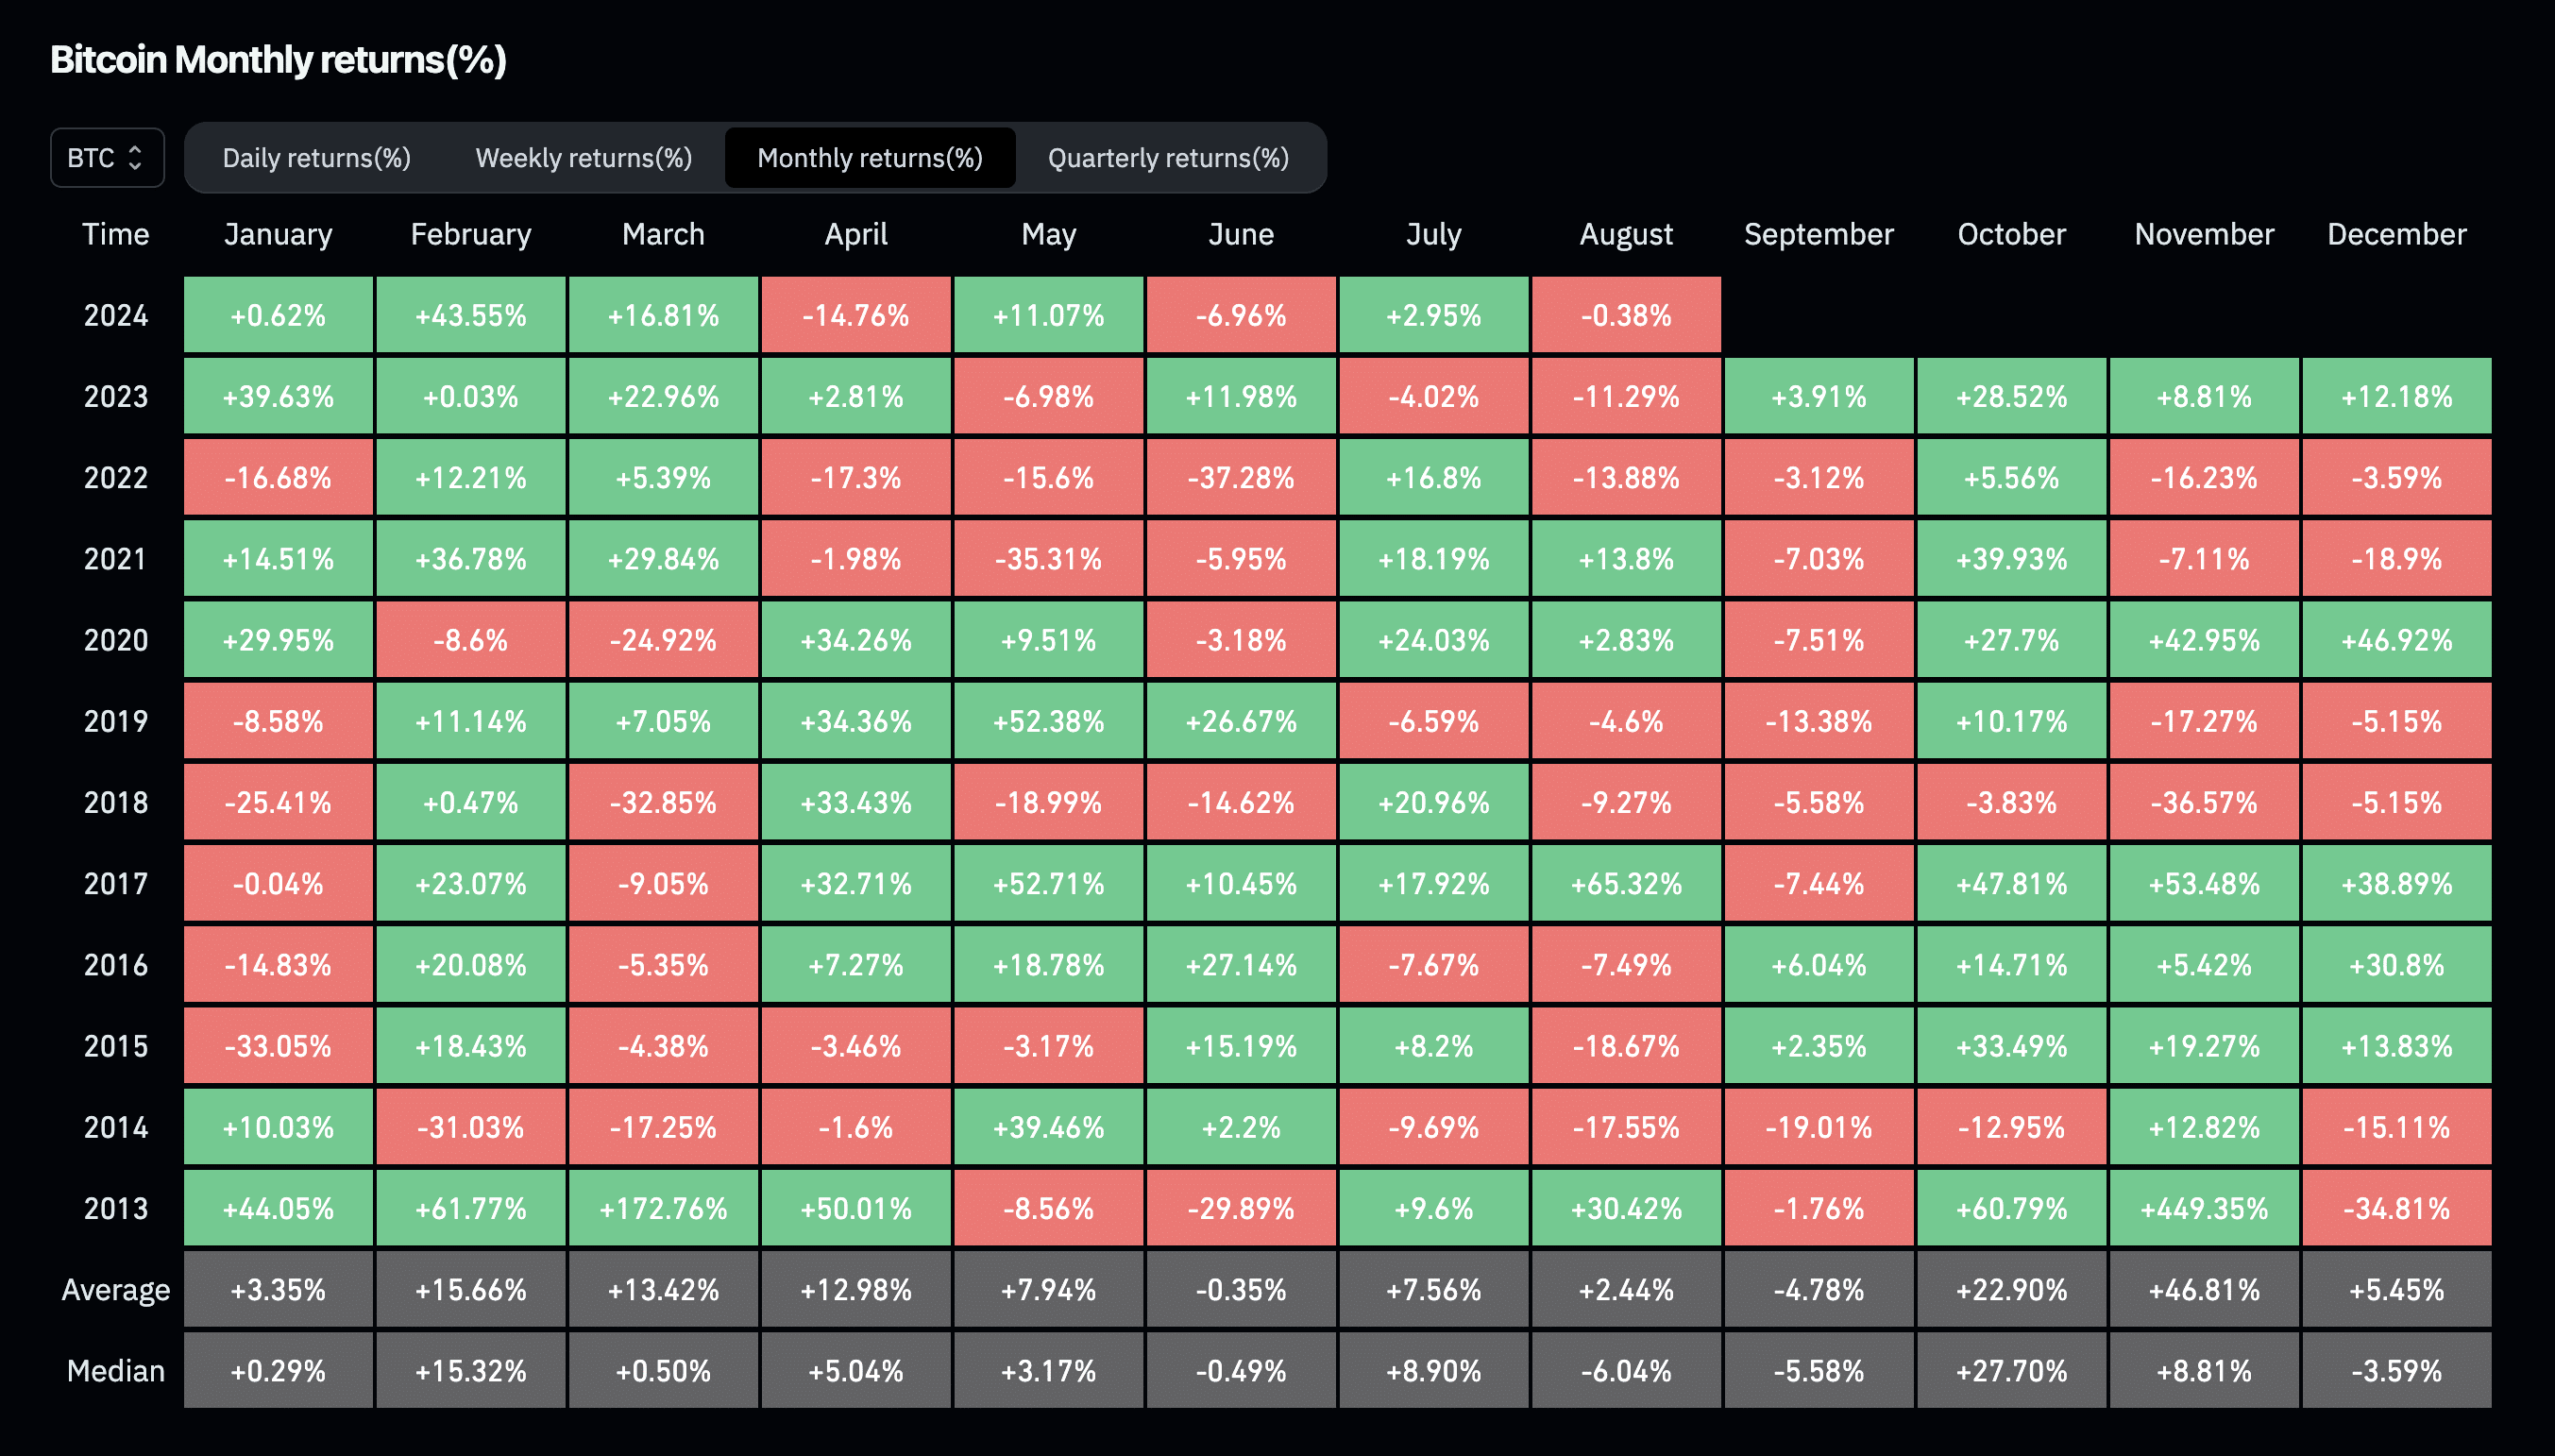
First, it’s important to consider the seasonal patterns within the cryptocurrency market. Historically, August and September have been challenging months for crypto assets. According to data from CoinGlass, the median Bitcoin monthly returns during these months are among the worst in the calendar year. Therefore, expecting significant upward momentum in Aave (AAVE) during this period may be overly optimistic.
Secondly, when evaluating Aave’s (AAVE) current situation using the technical indicators discussed, it becomes apparent that the bullish momentum is not as strong as it might initially appear. The recent breakthroughs in Fibonacci retracement levels and the bullish signals from the MACD are the only indicators suggesting potential upward movement. However, everything else points towards a likely correction.
Moreover, while Aave (AAVE) has benefited from positive news and increased whale activity, these factors seem to be losing steam.
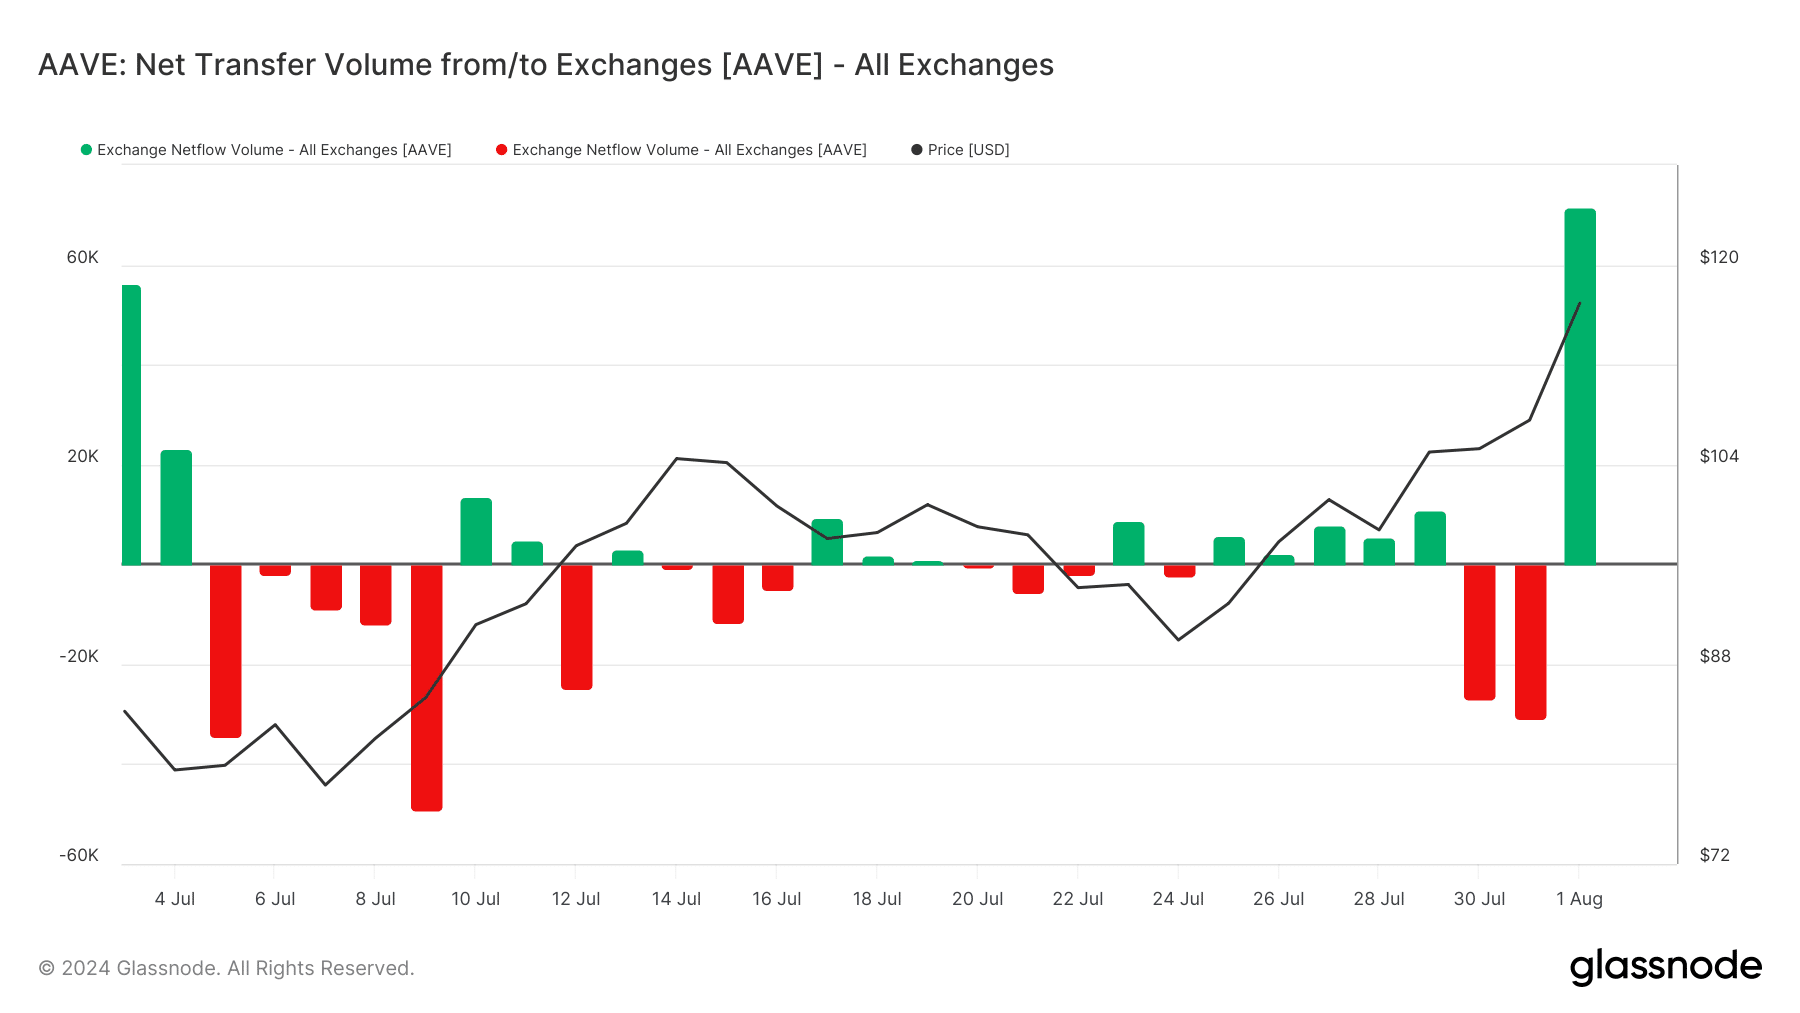
The net flow of Aave (AAVE) into exchanges has risen, which indicates potential selling pressure. For instance, on August 1, the net flow into exchanges exceeded $8 million.
Considering these factors, several price targets emerge if Aave (AAVE) fails to break above $115:
- First target: $106.50
- Second target: $100
- Third target: $95
- Fourth target (worst-case scenario): The golden pocket is between $87.41 and $88.89, which closely aligns with the $90 level.
If Aave (AAVE) does manage to break above $115, the outlook will shift toward a bullish scenario. In such a case, traders should watch for a subsequent retest of the $115 level as new support. Successfully holding this level would confirm the breakout and reinforce the momentum. Profit targets should then be adjusted upwards, focusing on the golden pocket between $121.50 and $124.11, followed by $135.20, and ultimately $143.09.
Disclosure: This content is provided by a third party. crypto.news does not endorse any product mentioned on this page. Users must do their own research before taking any actions related to the company.
Source link
You may like


Experts say these 3 altcoins will rally 3,000% soon, and XRP isn’t one of them


Robert Kiyosaki Hints At Economic Depression Ahead, What It Means For BTC?


BNB Steadies Above Support: Will Bullish Momentum Return?


Metaplanet makes largest Bitcoin bet, acquires nearly 620 BTC


Tron’s Justin Sun Offloads 50% ETH Holdings, Ethereum Price Crash Imminent?


Investors bet on this $0.0013 token destined to leave Cardano and Shiba Inu behind
Aave
AAVE Dominates DeFi Lending – Metrics Reveal 45% Market Share
Published
1 week agoon
December 15, 2024By
admin
Aave (AAVE), the leading decentralized finance (DeFi) lending protocol, has captured the spotlight with an extraordinary surge of over 200% since November 5. Outperforming the broader market, AAVE has reached its highest levels since 2021, marking a remarkable recovery and reaffirming its dominance in the DeFi ecosystem.
Related Reading
Key metrics from IntoTheBlock underscore AAVE’s unmatched position in the lending sector. With an impressive 45% market share, it remains the top choice for users seeking decentralized borrowing and lending solutions.
With AAVE trading at multi-year highs and on-chain data suggesting robust activity, the altcoin’s trajectory remains a focal point for investors and analysts alike. The question is whether the price can sustain this momentum and reach new all-time highs in the coming months.
AAVE Keeps Growing
Aave (AAVE) has shown consistent growth over the past year, solidifying its position as a market leader in the DeFi lending sector. Known for its innovative approach to creating non-custodial liquidity markets, Aave enables users to earn interest on supplied and borrowed assets at variable interest rates. This approach has made Aave a go-to protocol for decentralized borrowing and lending.
For years, Aave has been at the forefront of DeFi innovation, continually enhancing its platform and user experience. Its success is evident in its market dominance. Metrics from IntoTheBlock highlight Aave’s unrivaled leadership, boasting an impressive 45% market share in the DeFi lending space.
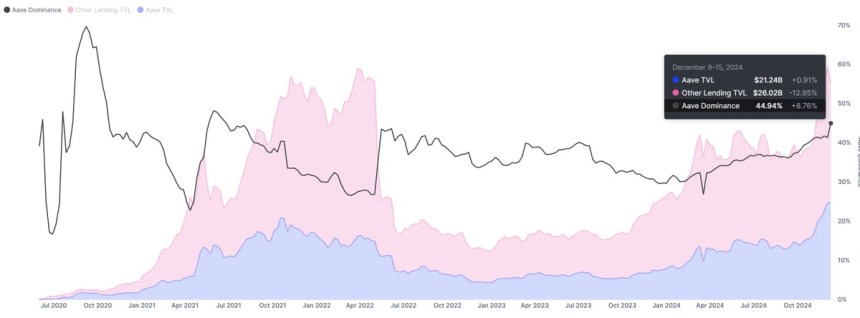
This dominance is further emphasized by Aave’s staggering total value locked (TVL), which stands at $21.2 billion—almost equal to the combined TVL of all other lending protocols.
Related Reading
Such figures underline Aave’s critical role in the DeFi ecosystem. Its established presence and robust infrastructure position it as a key player in the event of a broader DeFi resurgence. Should the sector heat up in the coming weeks, Aave is likely to attract significant attention from investors and traders.
Price Targets Fresh Supply Levels
Aave (AAVE) is currently trading at $366, following a surge to a multi-year high of $396 just hours ago. The altcoin continues its upward momentum as it approaches the critical $420 resistance level, a threshold last held in September 2021. This mark is seen as a pivotal area for AAVE’s next phase of price action, with many analysts expecting a significant reaction once tested.
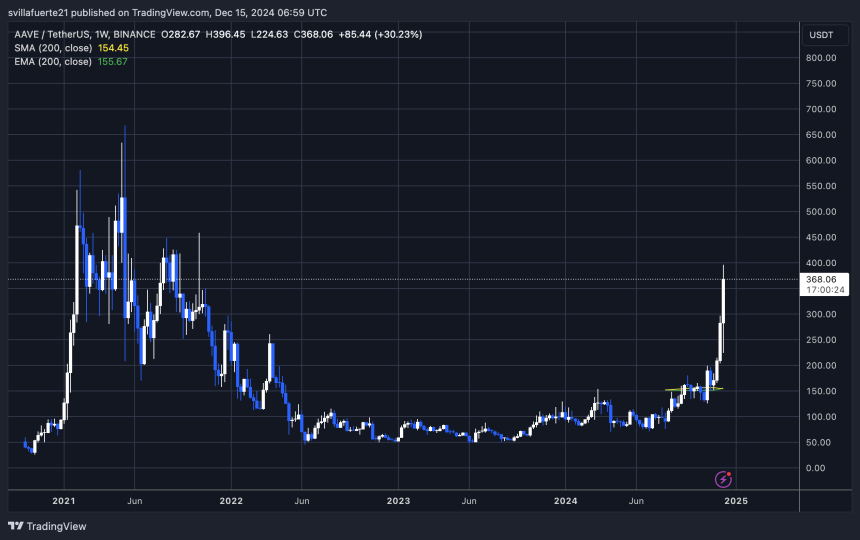
If AAVE manages to hold its current levels and sustain the bullish momentum, the next logical target would be the $420 resistance zone. Breaking above this level could signal a continuation of its multi-month rally, setting the stage for even higher price targets as investor confidence builds.
On the downside, failure to maintain support above the $320–$340 range could lead to a broader correction. A move below this zone might push the price lower, erasing some of its recent gains and dampening bullish sentiment in the short term.
Related Reading
AAVE remains in a strong position for now, but traders are closely monitoring its price action near these key levels. Whether it can sustain its upward trajectory or faces a pullback will depend on its ability to break and hold above significant resistance zones.
Featured image from Dall-E, chart from TradingView
Source link
24/7 Cryptocurrency News
US Government Makes First AAVE Transaction In 8 Months
Published
2 months agoon
October 24, 2024By
admin
The US government has ignited a selloff scare for AAVE after initiating its first transaction for the token in 8 months. According to data insights from Arkham Intelligence, the US Government transaction features a total of $5.4 million.
Is the US Government Earning With Aave?
Per the data shared, the funds were originally secured from the Bitfinex Hacker as marked by Arkham Intelligence. However, the exact transactions remains partly unclear considering the funds are paid out in USDC.
According to comments from the community, one explanation for this is that the US government locked up the funds on Aave. Based on this, it started earning interest as a liquidity provider on the Decentralized Finance (DeFi) lending platform.
This is a developing story, please check back for updates!!!
Godfrey Benjamin
Benjamin Godfrey is a blockchain enthusiast and journalists who relish writing about the real life applications of blockchain technology and innovations to drive general acceptance and worldwide integration of the emerging technology. His desires to educate people about cryptocurrencies inspires his contributions to renowned blockchain based media and sites. Benjamin Godfrey is a lover of sports and agriculture.
Disclaimer: The presented content may include the personal opinion of the author and is subject to market condition. Do your market research before investing in cryptocurrencies. The author or the publication does not hold any responsibility for your personal financial loss.
Source link
Aave
AAVE Price Eyes $200 as Whale Buying Sphere Hits Key Fibonacci Support
Published
2 months agoon
October 13, 2024By
admin
AAVE price displays a modest downtick of 0.83% during Sunday’s low volatility trading. The pullback temporarily stalled the current recovery but allowed buyers to replenish the bullish momentum before the next leap. Amid the formation of a bullish reversal pattern, the recently recorded whale buying positions AAVE price for a sustained rally.
AAVE Price Targets $200 as Whale Buying Spree Aligns with Fibonacci Support
According to Lookonchain analytics, a crypto whale recently bought 31,173 AAVE tokens worth around $4.8 million and deposited them into Aave. Shortly after, the whale borrowed around 2.7M GHO stablecoin from the Aave protocol and swapped them for USDC.
These stablecoins were deposited into the Coinbase exchange to acquire more AAVE, projecting a bullish outlook for this smart money. The use of GHO, a stablecoin associated with Aave, further showcases confidence in the Aave ecosystem.
A whale is going long on $AAVE.
The whale bought 31,173 $AAVE($4.8M) 9 hours ago and deposited it into #Aave.
Then he borrowed 2.7M $GHO from #Aave and swapped it to $USDC.
And deposited the $USDC into #Coinbase to buy more $AAVE.
Address:https://t.co/s8cD7dHTb5 pic.twitter.com/WuVkTIbj38
— Lookonchain (@lookonchain) October 13, 2024
The supply distribution metric from Santiment indicates that large holders with wallet sizes between 1 million to 10 million AAVE initiated a buying spree in August. This accumulation has now reached 4.17 million AAVE, highlighting strong whale activity.
This trend suggests increasing confidence among large investors in AAVE’s price potential, possibly hinting at further upside momentum in the market.
![Aave [on Ethereum]](https://coingape.com/wp-content/uploads/2024/10/Aave-on-Ethereum-AAVE-17.22.17-13-Oct-2024.png)
![Aave [on Ethereum]](https://coingape.com/wp-content/uploads/2024/10/Aave-on-Ethereum-AAVE-17.22.17-13-Oct-2024.png)
AAVE Hint Major Reversal Pattern Breakout
Following the early October sell-off, the AAVE price managed to stabilize above $135 support since last week. This support is reinforced by both the 50-day exponential moving average and the 38.2% Fibonacci retracement level, providing a solid foundation for a potential price reversal.
The 38.2% FIB is typically seen as an ideal pullback zone for buyers to regain control after a period of exhausted bullish momentum. The recent reversal has uplifted asset 12% up to trade at $152.5 and formed a bullish reversal pattern called a double bottom.
The chart setup resembles a ‘W’ letter and indicates a renewed bullish momentum for a breakout opportunity. If the pattern holds true, the AAVE price rally could breach the $154.8 neckline and drive a post-breakout rally to $180, followed by $200.


Alternatively, if the AAVE buyers fail to sustain a neckline breakout, the sellers could revert the price lower and seek support at the $115 level.
Frequently Asked Questions (FAQs)
Recent whale buying has significantly boosted confidence in AAVE, with large holders accumulating 4.17 million AAVE. This activity, aligned with key Fibonacci support, is pushing the price toward the $200 target.
The 38.2% Fibonacci retracement level has provided a key pullback zone, allowing buyers to regain control and pushing AAVE’s price recovery
AAVE has formed a double bottom pattern on the daily chart, which suggests a bullish reversal
Sahil Mahadik
Sahil is a dedicated full-time trader with over three years of experience in the financial markets. Armed with a strong grasp of technical analysis, he keeps a vigilant eye on the daily price movements of top assets and indices. Drawn by his fascination with financial instruments, Sahil enthusiastically embraced the emerging realm of cryptocurrency, where he continues to explore opportunities driven by his passion for trading
Disclaimer: The presented content may include the personal opinion of the author and is subject to market condition. Do your market research before investing in cryptocurrencies. The author or the publication does not hold any responsibility for your personal financial loss.
Source link

Experts say these 3 altcoins will rally 3,000% soon, and XRP isn’t one of them

Robert Kiyosaki Hints At Economic Depression Ahead, What It Means For BTC?

BNB Steadies Above Support: Will Bullish Momentum Return?

Metaplanet makes largest Bitcoin bet, acquires nearly 620 BTC

Tron’s Justin Sun Offloads 50% ETH Holdings, Ethereum Price Crash Imminent?

Investors bet on this $0.0013 token destined to leave Cardano and Shiba Inu behind

End of Altcoin Season? Glassnode Co-Founders Warn Alts in Danger of Lagging Behind After Last Week’s Correction

Can Pi Network Price Triple Before 2024 Ends?

XRP’s $5, $10 goals are trending, but this altcoin with 7,400% potential takes the spotlight

CryptoQuant Hails Binance Reserve Amid High Leverage Trading

Trump Picks Bo Hines to Lead Presidential Crypto Council

The introduction of Hydra could see Cardano surpass Ethereum with 100,000 TPS

Top 4 Altcoins to Hold Before 2025 Alt Season

DeFi Protocol Usual’s Surge Catapults Hashnote’s Tokenized Treasury Over BlackRock’s BUIDL

DOGE & SHIB holders embrace Lightchain AI for its growth and unique sports-crypto vision
182267361726451435

Why Did Trump Change His Mind on Bitcoin?

Top Crypto News Headlines of The Week

New U.S. president must bring clarity to crypto regulation, analyst says

Will XRP Price Defend $0.5 Support If SEC Decides to Appeal?

Bitcoin Open-Source Development Takes The Stage In Nashville

Ethereum, Solana touch key levels as Bitcoin spikes

Bitcoin 20% Surge In 3 Weeks Teases Record-Breaking Potential

Ethereum Crash A Buying Opportunity? This Whale Thinks So

Shiba Inu Price Slips 4% as 3500% Burn Rate Surge Fails to Halt Correction

Washington financial watchdog warns of scam involving fake crypto ‘professors’

‘Hamster Kombat’ Airdrop Delayed as Pre-Market Trading for Telegram Game Expands

Citigroup Executive Steps Down To Explore Crypto
Mostbet Güvenilir Mi – Casino Bonus 2024

NoOnes Bitcoin Philosophy: Everyone Eats
Trending

 3 months ago
182267361726451435

 Donald Trump5 months ago
Why Did Trump Change His Mind on Bitcoin?

 24/7 Cryptocurrency News4 months ago
Top Crypto News Headlines of The Week

 News4 months ago
New U.S. president must bring clarity to crypto regulation, analyst says

 Price analysis4 months ago
Will XRP Price Defend $0.5 Support If SEC Decides to Appeal?

 Opinion5 months ago
Bitcoin Open-Source Development Takes The Stage In Nashville

 Bitcoin5 months ago
Ethereum, Solana touch key levels as Bitcoin spikes

 Bitcoin5 months ago
Bitcoin 20% Surge In 3 Weeks Teases Record-Breaking Potential


✓ Share: