
Bitcoin price
Is the Bitcoin Bull Cycle Over?

After reaching new all-time highs earlier this year, Bitcoin has entered a multi-month period of choppy price action, leading many to wonder if the bull cycle is over. In this article, we dive deep into key metrics and trends to understand if the market is just cooling off or if we’ve already seen the peak for this cycle.
Fundamentally Overvalued?
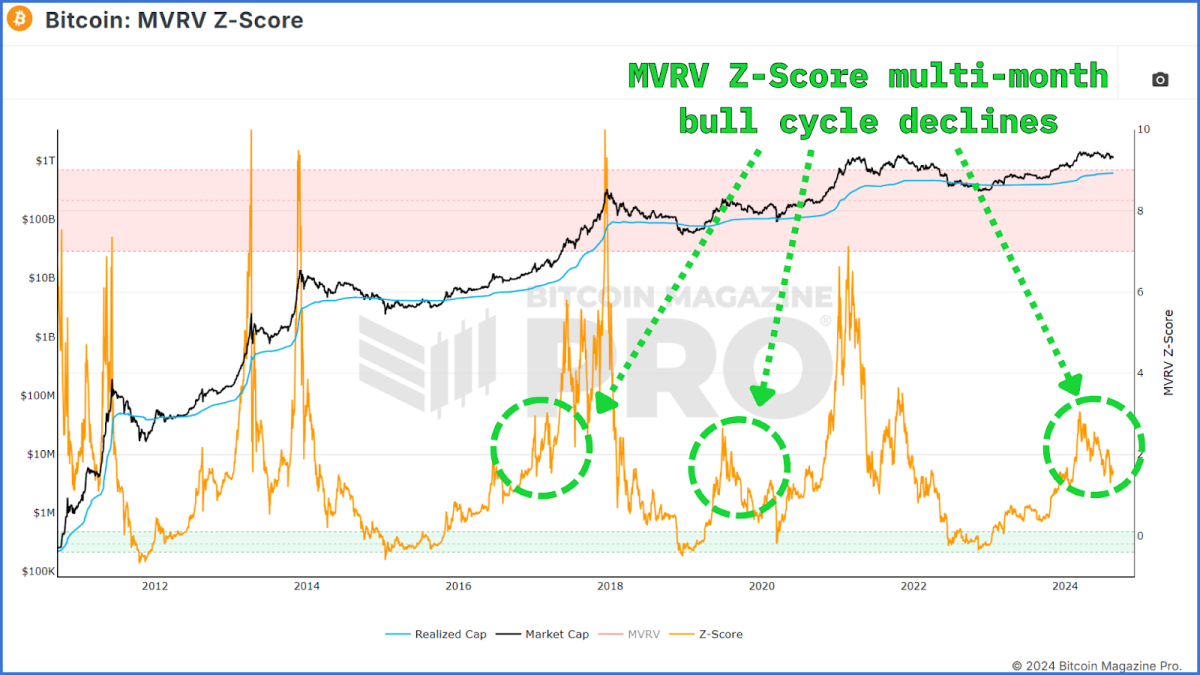
One of the most reliable tools for gauging Bitcoin’s market cycles is the MVRV Z-Score. This metric measures the difference between Bitcoin’s market cap and its realized cap, or cost-basis for all circulating BTC, helping investors determine whether Bitcoin is over or undervalued according to this ‘fundamental’ cost of BTC.
Recent data shows that the MVRV Z-Score has demonstrated a sustained downward movement, which might suggest that Bitcoin’s upward trajectory has ended. However, a historical analysis tells a different story. During previous bull cycles, including those in 2016-2017 and 2019-2020, similar declines in the MVRV Z-Score were observed. These drawdown periods were followed by significant rallies, leading to new all-time highs. Thus, while the current downtrend may seem concerning, it’s not necessarily indicative of the bull cycle being over.
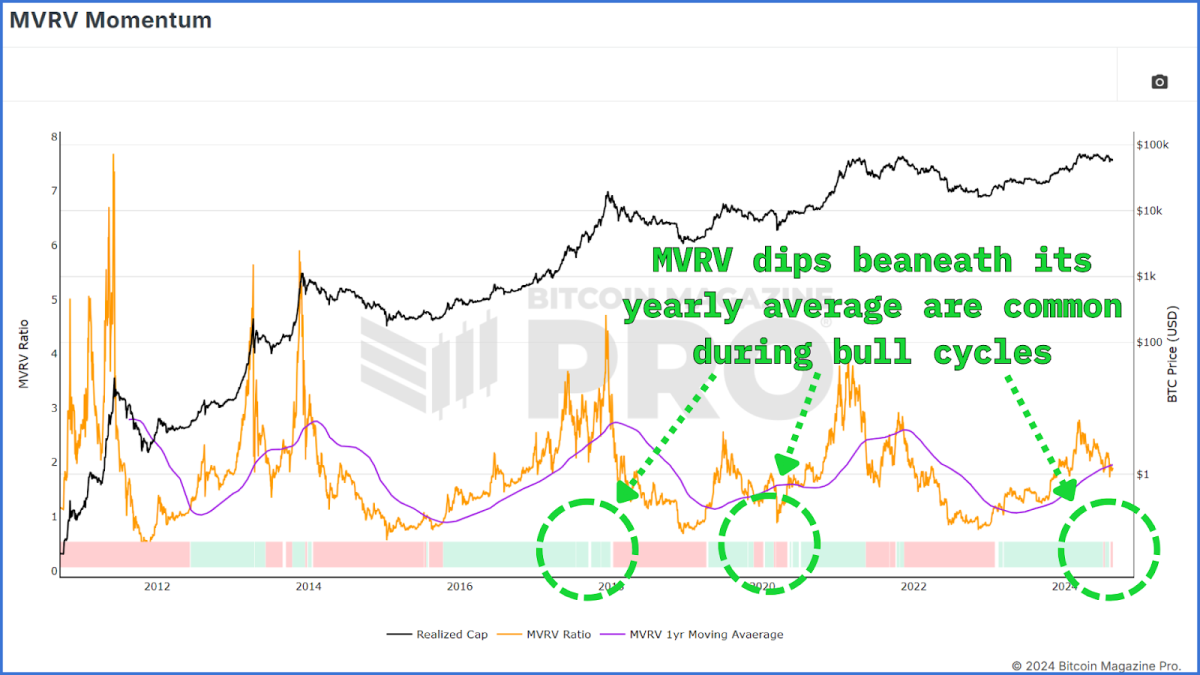
The MVRV Momentum Indicator helps distinguish between bull and bear cycles by applying a moving average to the raw MVRV data. It recently dipped below its moving average and turned red, which may signal the start of a bear cycle. However, historical data shows that similar dips have occurred without leading to a prolonged bear market.
Struggling Beneath Resistance?
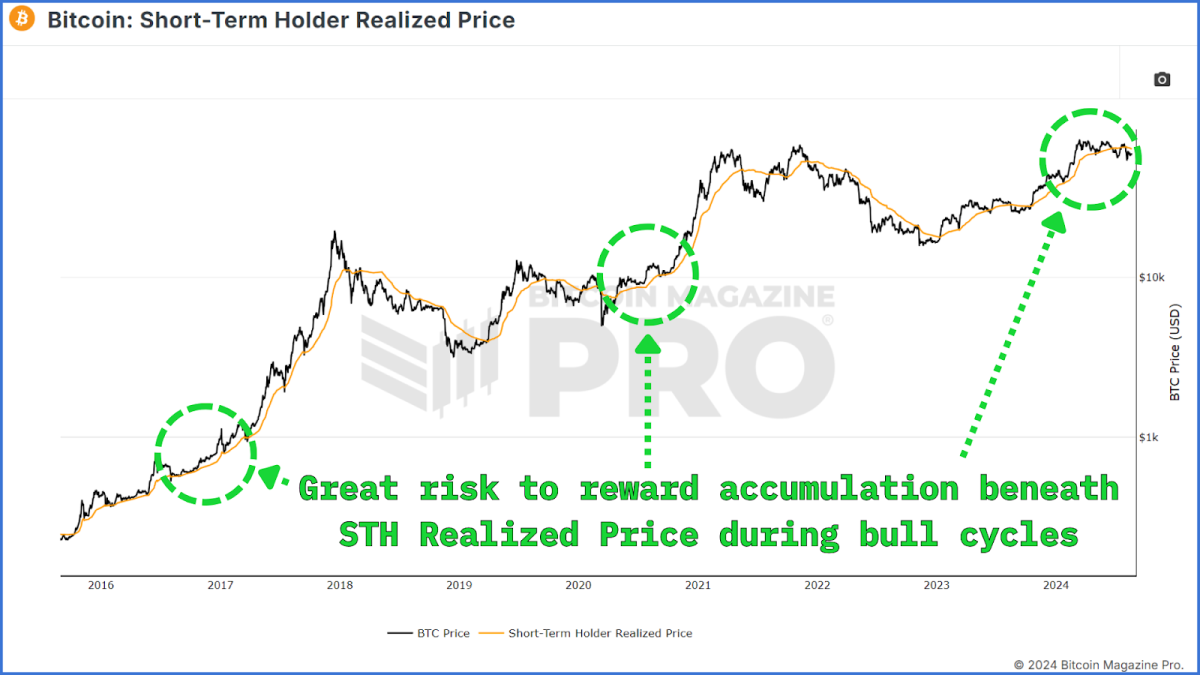
Another essential metric to consider is the Short-Term Holder (STH) Realized Price, which represents the average price at which recent market participants acquired their Bitcoin. Currently, the STH Realized Price is around $63,000, slightly above the current market price. This means that many new investors are holding Bitcoin at a loss.
However, during previous bull cycles, Bitcoin’s price dipped below the STH Realized Price multiple times without signaling the end of the bull market. These dips often presented opportunities for investors to accumulate Bitcoin at discounted prices before the next leg up.
Investor Capitulation?
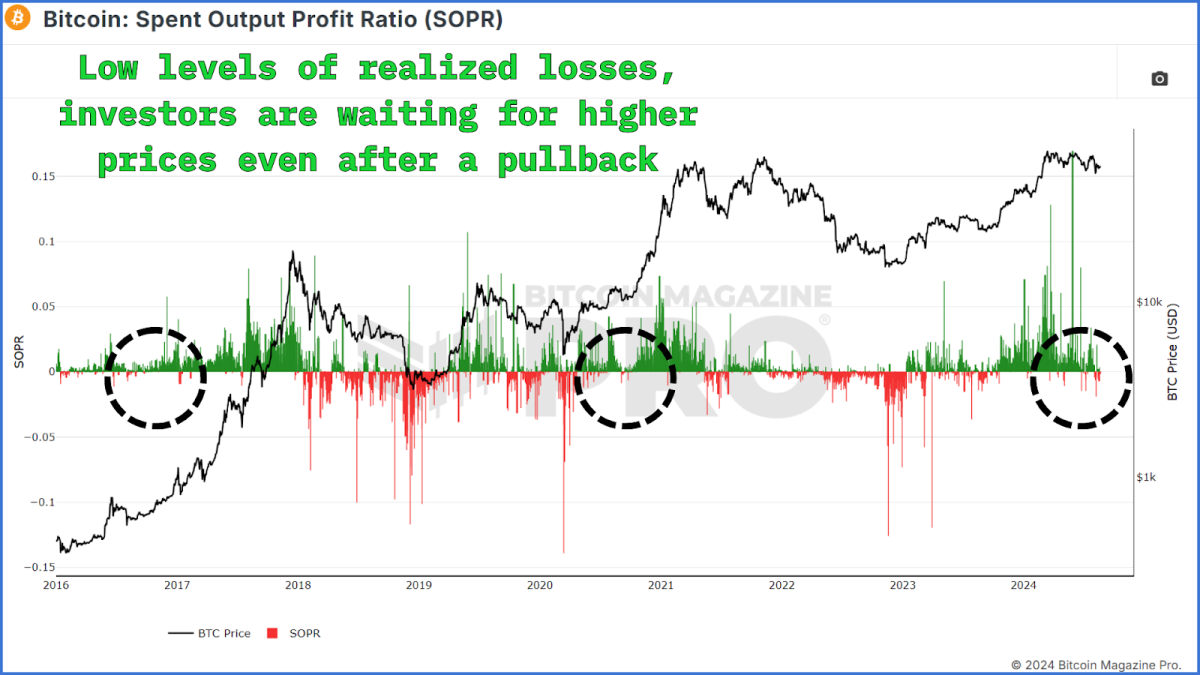
The Spent Output Profit Ratio (SOPR) assesses whether Bitcoin holders are selling at a profit or a loss. When the SOPR is below 0, it suggests that more holders are selling at a loss, which can signal market capitulation. However, recent SOPR data shows only a few instances of selling at a loss, which have been brief. This implies that there is no widespread panic among Bitcoin holders, typically seen during a bear market’s early stages.
In the past, brief periods of selling at a loss during a bull cycle have been followed by significant price increases, as seen in the 2020-2021 run-up. Therefore, the lack of sustained losses and capitulation in the SOPR data supports the view that the bull cycle is still intact.
Diminishing Returns?
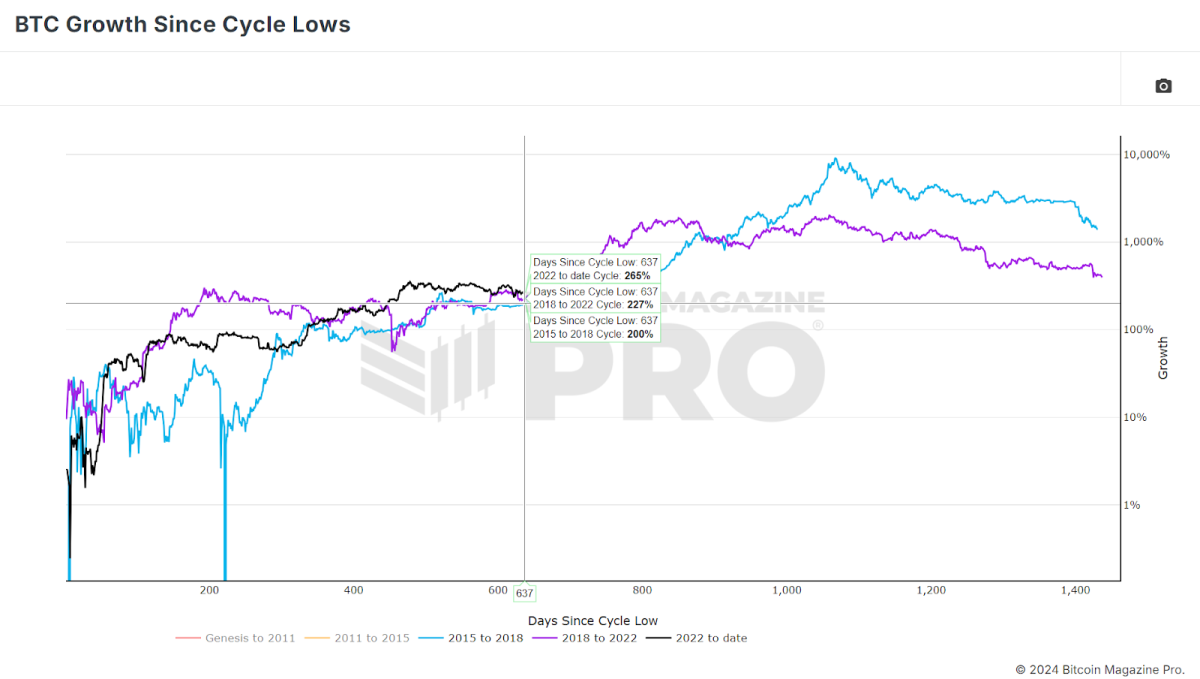
There’s a theory that each Bitcoin cycle has diminishing returns, with lower percentage gains than the previous cycle. If we compare the current cycle to previous ones, it’s clear that Bitcoin has already outperformed both the 2015-2018 and 2018-2022 cycles regarding percentage gains. This outperformance might suggest that Bitcoin has gotten ahead of itself, necessitating a cooling-off period.
However, it’s also important to remember that this cooling-off period doesn’t mean the end of the bull market. Historically, Bitcoin has experienced similar pauses before resuming its upward trajectory. Thus, while we might see more sideways or even downward price action in the short term, this doesn’t necessarily indicate that the bull market is over.
The Hash Ribbons Buy Signal
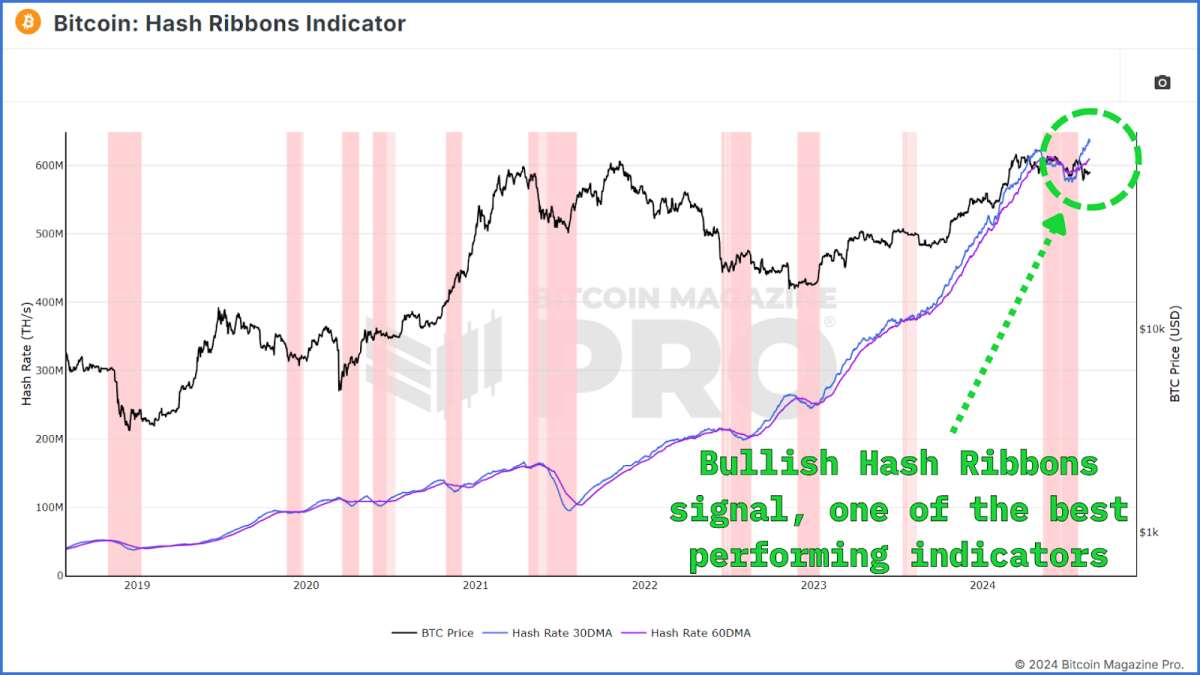
One of the most promising indicators for Bitcoin’s future price action is the Hash Ribbons Buy Signal. This signal occurs when the 30-day moving average of Bitcoin’s hash rate crosses above the 60-day moving average, indicating that miners are recovering after a period of capitulation. The Hash Ribbons Buy Signal has historically been a reliable indicator of bullish price action in the months that follow.
Recently, Bitcoin has shown this buy signal for the first time since the halving event earlier this year, suggesting that Bitcoin could see positive price action in the coming weeks and months.
Conclusion
In summary, while there are signs of weakness in the Bitcoin market, such as the dip in the MVRV Z-Score and the STH Realized Price, these metrics have shown similar behavior in previous bull cycles without signaling the end of the market. The lack of widespread capitulation, as indicated by the SOPR and the recent Hash Ribbons Buy Signal, provides further confidence that the bull cycle is still intact.
For a more in-depth look into this topic, check out a recent YouTube video here:
Source link


With Bitcoin now making six-figure territory feel normal and higher prices a seeming inevitability, the analysis of key on-chain data provides valuable insights into the underlying health of the market. By understanding these metrics, investors can better anticipate price movements and prepare for potential market peaks or even any upcoming retracements.
Terminal Price
The Terminal Price metric, which incorporates the Coin Days Destroyed (CDD) while factoring in Bitcoin’s supply, has historically been a reliable indicator for predicting Bitcoin cycle peaks. Coin Days Destroyed measures the velocity of coins being transferred, considering both the holding duration and the quantity of Bitcoin moved.
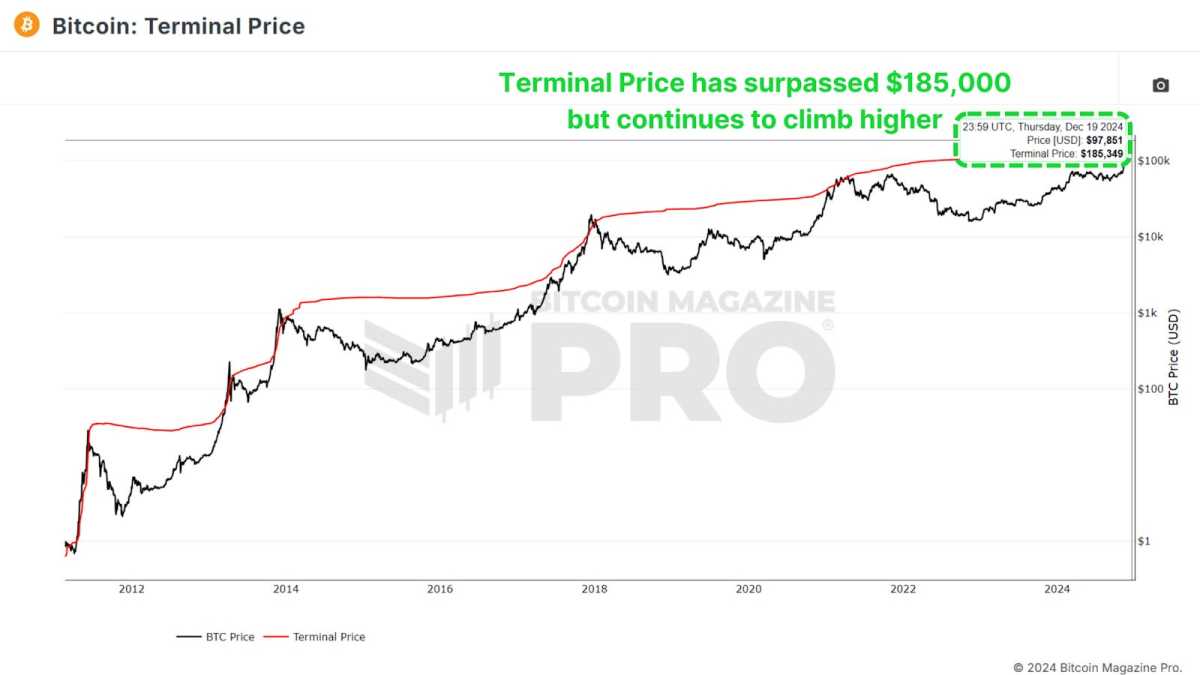
Currently, the terminal price has surpassed $185,000 and is likely to rise toward $200,000 as the cycle progresses. With Bitcoin already breaking $100,000, this suggests we may still have several months of positive price action ahead.
Puell Multiple
The Puell Multiple evaluates daily miner revenue (in USD) relative to its 365-day moving average. After the halving event, miners experienced a sharp drop in revenue, creating a period of consolidation.
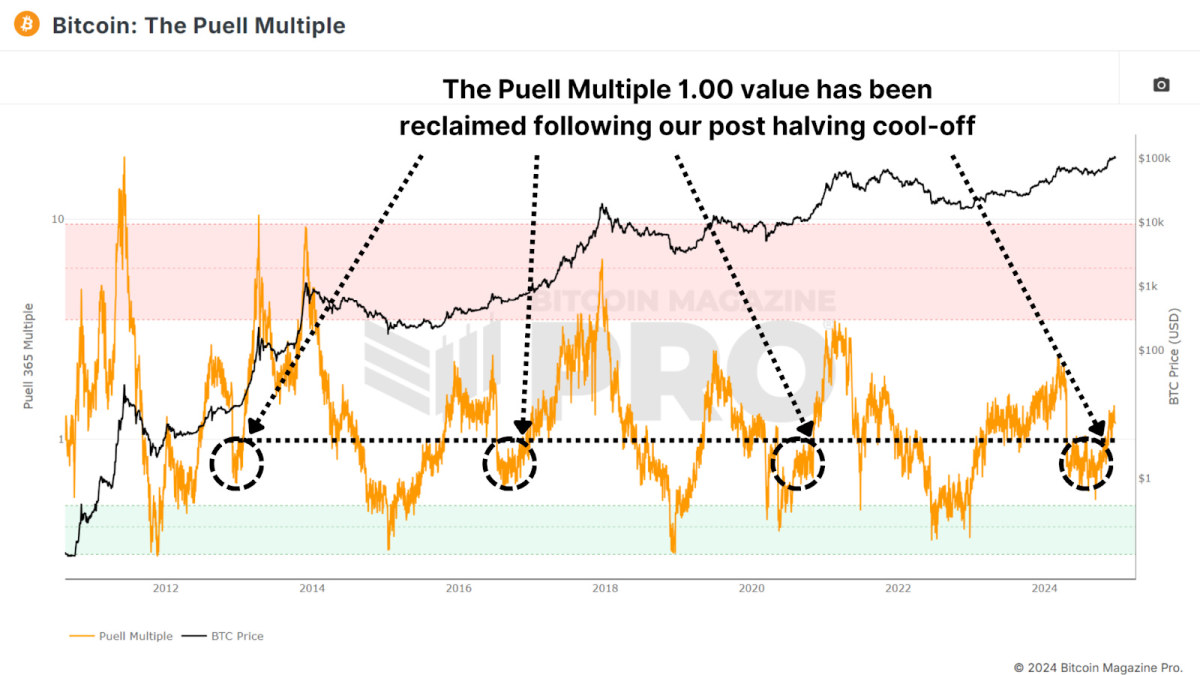
Now, the Puell Multiple has climbed back above 1, signaling a return to profitability for miners. Historically, surpassing this threshold has indicated the later stages of a bull cycle, often marked by exponential price rallies. A similar pattern was observed during all previous bull runs.
MVRV Z-Score
The MVRV Z-Score measures the market value relative to the realized value (average cost basis of Bitcoin holders). Standardized into a Z-Score to account for the asset’s volatility, it’s been highly accurate in identifying cycle peaks and bottoms.
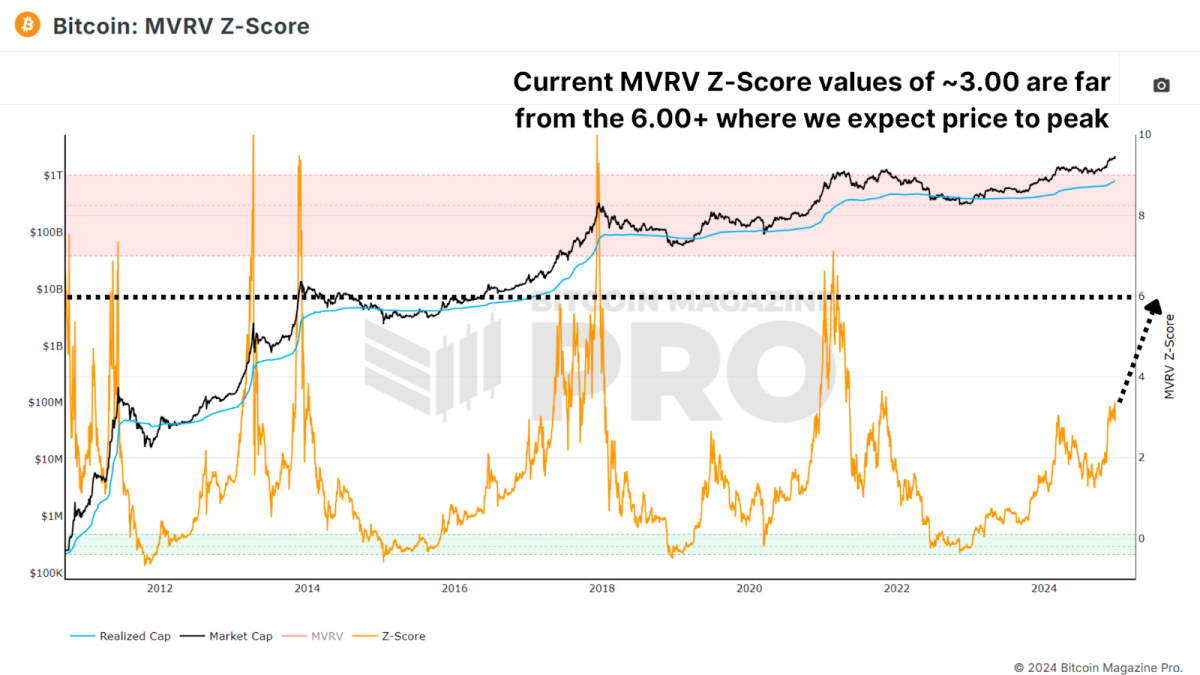
Currently, Bitcoin’s MVRV Z-Score remains below the overheated red zone with a value of around 3.00, signaling that there’s still room for growth. While diminishing peaks have been a trend in recent cycles, the Z-Score suggests that the market is far from reaching a euphoric top.
Active Address Sentiment
This metric tracks the 28-day percentage change in active network addresses alongside the price change over the same period. When price growth outpaces network activity, it suggests the market may be short-term overbought, as the positive price action may not be sustainable given network utilization.
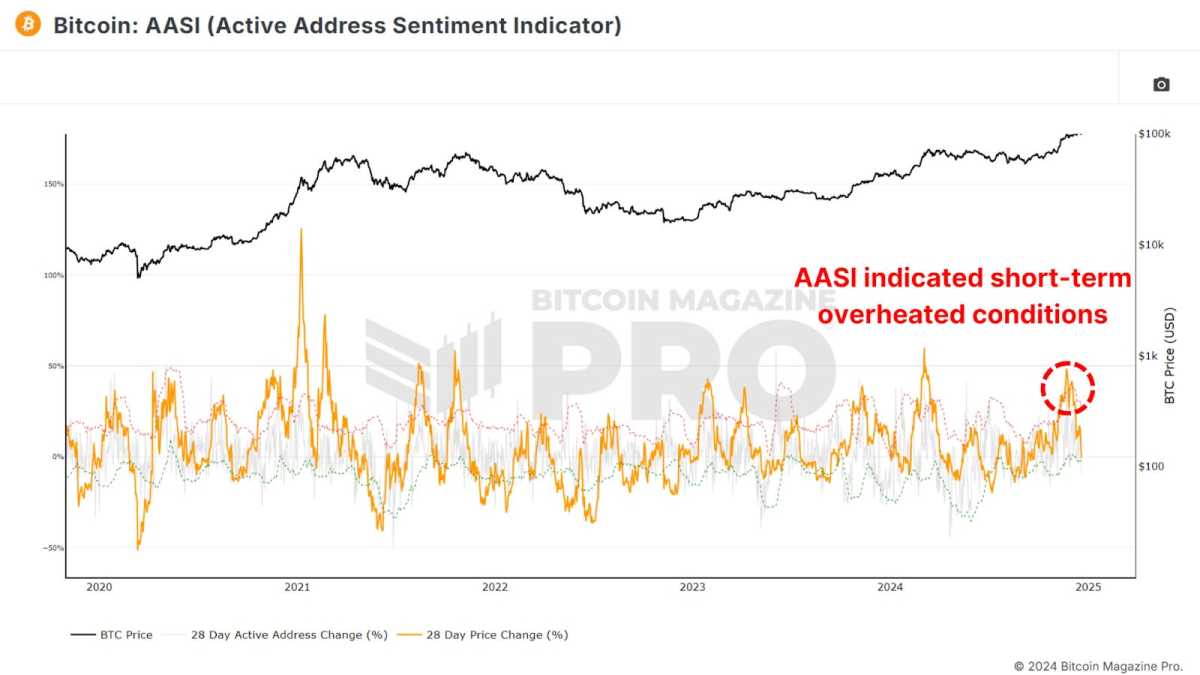
Recent data shows a slight cooling after Bitcoin’s rapid climb from $50,000 to $100,000, indicating a healthy consolidation period. This pause is likely setting the stage for sustained long-term growth and does not indicate we should be medium to long-term bearish.
Spent Output Profit Ratio
The Spent Output Profit Ratio (SOPR) measures realized profits from Bitcoin transactions. Recent data shows an uptick in profit-taking, potentially indicating we are entering the latter stages of the cycle.
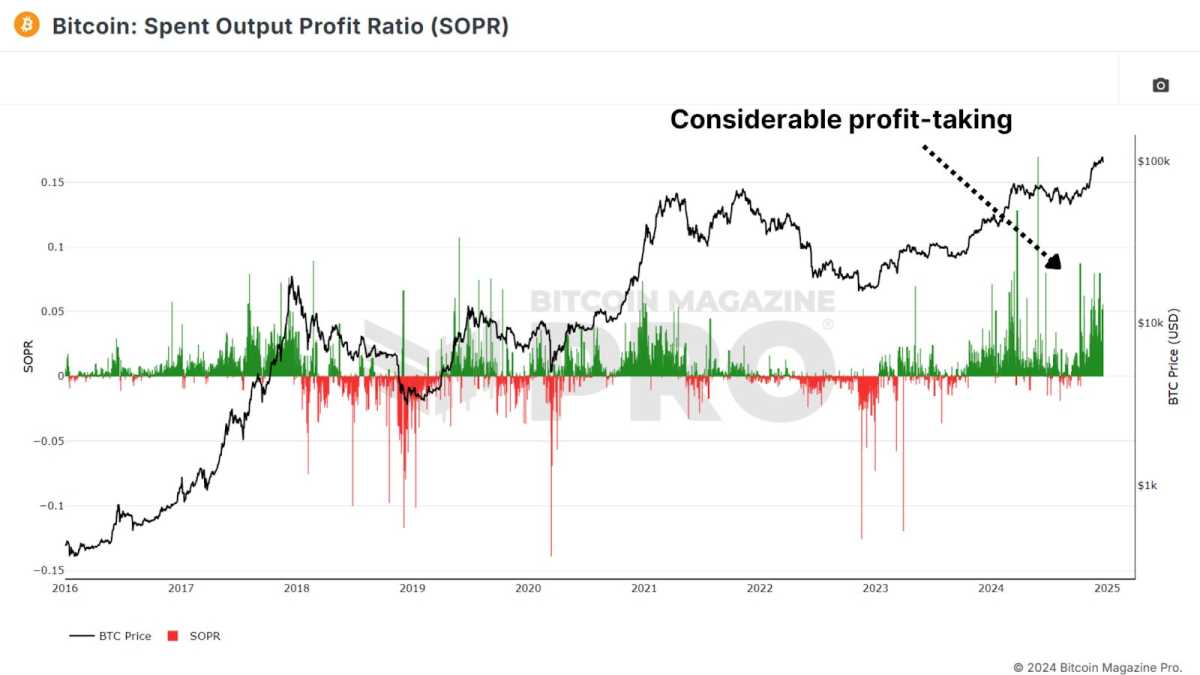
One caveat to consider is the growing use of Bitcoin ETFs and derivative products. Investors may be shifting from self-custody to ETFs for ease of use and tax advantages, which could influence SOPR values.
Value Days Destroyed
Value Days Destroyed (VDD) Multiple expands on CDD by weighting larger, long-term holders. When this metric enters the overheated red zone, it often signals major price peaks as the market’s largest and most experienced participants begin cashing out.
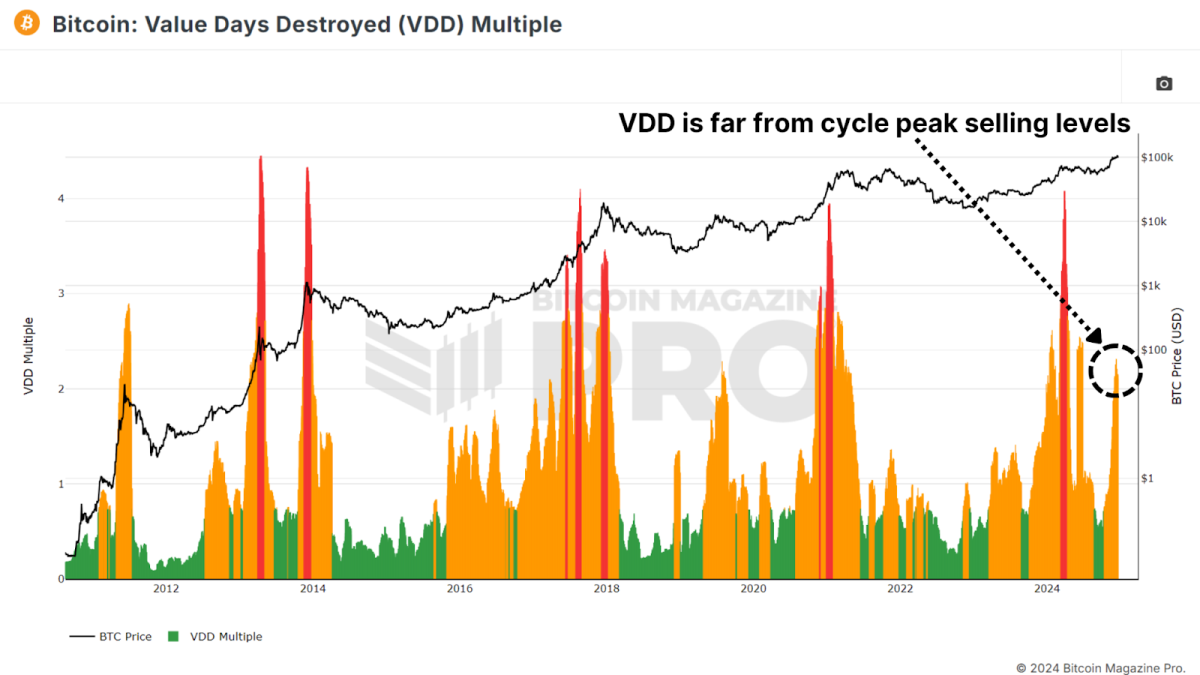
While Bitcoin’s current VDD levels indicate a slightly overheated market, history suggests it could sustain this range for months before a peak. For example, in 2017, VDD indicated overbought conditions nearly a year before the cycle’s top.
Conclusion
Taken together, these metrics suggest that Bitcoin is entering the latter stages of its bull market. While some indicators point to short-term cooling or slight overextension, most highlight substantial remaining upside throughout 2025. Key resistance levels for this cycle may emerge between $150,000 and $200,000, with metrics like SOPR and VDD providing clearer signals as we approach the peak.
For a more in-depth look into this topic, check out a recent YouTube video here: What’s Happening On-chain: Bitcoin Update
Disclaimer: This newsletter is for informational purposes only and should not be considered financial advice. Always do your own research before making any investment decisions.
Source link
The Bitcoin price has dropped below the $100,000 psychological level and is now holding between the $96,000 and $98,000 range. Crypto analyst Ali Martinez provided insights into why Bitcoin could be holding well within this range.
Why The Bitcoin Price Is Holding Steady Between $96,000 And $98,000
In an X post, Ali Martinez noted that one of the most important support levels for the Bitcoin price is between $98,830 and $95,830, where 1.09 wallets bought over 1.16 million BTC. This explains why Bitcoin is holding steady between $96,000 and $98,000 as investors who bought between this level continue to provide huge support for the flagship crypto.
Related Reading
As Martinez suggested, it is important for these holders to continue to hold steady as a wave of sell-offs could send the Bitcoin price tumbling even below $90,000. The flagship crypto dropped below $100,000 following the Federal Reserve Jerome Powell’s recent speech, in which he hinted at a hawkish stance from the US Central Bank.
This sparked a massive wave of sell-offs, as a Hawkish Fed paints a bearish picture for risk assets like Bitcoin. However, despite the Bitcoin price drop below, most Bitcoin holders remain in profit, which is a positive for the flagship crypto. IntoTheBlock data shows that 86% of Bitcoin holders are in the money, 4% are out of the money, and 9% are at the money.
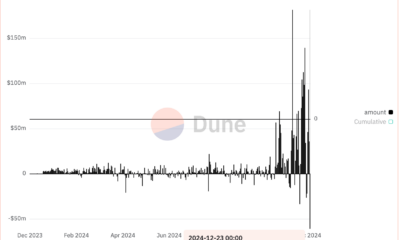
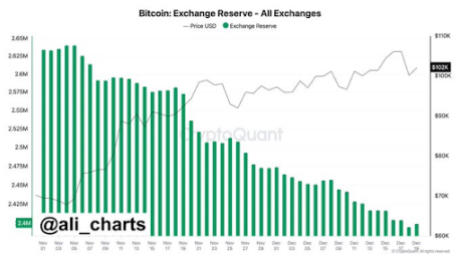
These Bitcoin holders still seem bullish on the leading crypto as they continue to accumulate more BTC. In an X post, Ali Martinez stated that so far in December, 74,052 BTC have been withdrawn from exchanges, and this trend doesn’t seem to be slowing down.
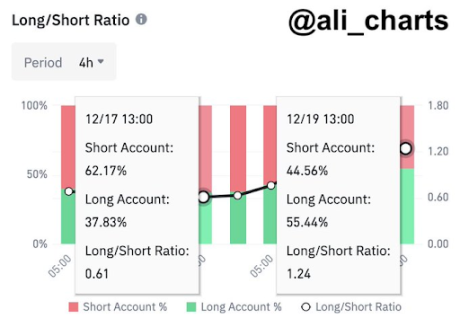
Traders Anticipate A Bullish Reversal
Ali Martinez suggested that crypto traders anticipate a bullish reversal for the Bitcoin price from its current level. This came as he revealed that traders on Binance nailed the top, with 62.17% shorting Bitcoin while it was trading at $108,000. Now, Martinez stated that sentiment has flipped, with 55.44% of these trading now longing dips below $96,000.
Related Reading
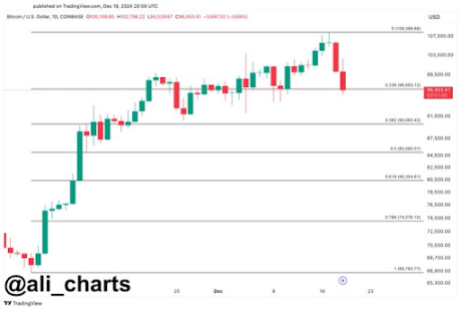
Meanwhile, it is crucial for the Bitcoin price to hold this $96,000, as Martinez warned that if BTC loses this support, it could drop below $90,000. The analyst stated that based on the Fibonacci level, if Bitcoin loses $96,000, the next point of focus becomes $90,000 and $85,000. Meanwhile, from a bullish perspective, crypto analyst Justin Bennett suggested that the $110,000 target is still in focus for the Bitcoin price.
At the time of writing, the Bitcoin price is trading at around $97,000, down over 3% in the last 24 hours, according to data from CoinMarketCap.
Featured image created with Dall.E, chart from Tradingview.com
Source link
With Bitcoin now making six-figure territory feel normal and higher prices a seeming inevitability, the analysis of key on-chain data provides valuable insights into the underlying health of the market. By understanding these metrics, investors can better anticipate price movements and prepare for potential market peaks or even any upcoming retracements.
Terminal Price
The Terminal Price metric, which incorporates the Coin Days Destroyed (CDD) while factoring in Bitcoin’s supply, has historically been a reliable indicator for predicting Bitcoin cycle peaks. Coin Days Destroyed measures the velocity of coins being transferred, considering both the holding duration and the quantity of Bitcoin moved.
Currently, the terminal price has surpassed $185,000 and is likely to rise toward $200,000 as the cycle progresses. With Bitcoin already breaking $100,000, this suggests we may still have several months of positive price action ahead.
Puell Multiple
The Puell Multiple evaluates daily miner revenue (in USD) relative to its 365-day moving average. After the halving event, miners experienced a sharp drop in revenue, creating a period of consolidation.
Now, the Puell Multiple has climbed back above 1, signaling a return to profitability for miners. Historically, surpassing this threshold has indicated the later stages of a bull cycle, often marked by exponential price rallies. A similar pattern was observed during all previous bull runs.
MVRV Z-Score
The MVRV Z-Score measures the market value relative to the realized value (average cost basis of Bitcoin holders). Standardized into a Z-Score to account for the asset’s volatility, it’s been highly accurate in identifying cycle peaks and bottoms.
Currently, Bitcoin’s MVRV Z-Score remains below the overheated red zone with a value of around 3.00, signaling that there’s still room for growth. While diminishing peaks have been a trend in recent cycles, the Z-Score suggests that the market is far from reaching a euphoric top.
Active Address Sentiment
This metric tracks the 28-day percentage change in active network addresses alongside the price change over the same period. When price growth outpaces network activity, it suggests the market may be short-term overbought, as the positive price action may not be sustainable given network utilization.
Recent data shows a slight cooling after Bitcoin’s rapid climb from $50,000 to $100,000, indicating a healthy consolidation period. This pause is likely setting the stage for sustained long-term growth and does not indicate we should be medium to long-term bearish.
Spent Output Profit Ratio
The Spent Output Profit Ratio (SOPR) measures realized profits from Bitcoin transactions. Recent data shows an uptick in profit-taking, potentially indicating we are entering the latter stages of the cycle.
One caveat to consider is the growing use of Bitcoin ETFs and derivative products. Investors may be shifting from self-custody to ETFs for ease of use and tax advantages, which could influence SOPR values.
Value Days Destroyed
Value Days Destroyed (VDD) Multiple expands on CDD by weighting larger, long-term holders. When this metric enters the overheated red zone, it often signals major price peaks as the market’s largest and most experienced participants begin cashing out.
While Bitcoin’s current VDD levels indicate a slightly overheated market, history suggests it could sustain this range for months before a peak. For example, in 2017, VDD indicated overbought conditions nearly a year before the cycle’s top.
Conclusion
Taken together, these metrics suggest that Bitcoin is entering the latter stages of its bull market. While some indicators point to short-term cooling or slight overextension, most highlight substantial remaining upside throughout 2025. Key resistance levels for this cycle may emerge between $150,000 and $200,000, with metrics like SOPR and VDD providing clearer signals as we approach the peak.
For a more in-depth look into this topic, check out a recent YouTube video here: What’s Happening On-chain: Bitcoin Update
Disclaimer: This newsletter is for informational purposes only and should not be considered financial advice. Always do your own research before making any investment decisions.
Source link

Most Layer 2 solutions are still struggling with scalability

Here’s why Stellar Price Could Go Parabolic Soon

Perp-Focused HyperLiquid Experiences Record $60M in USDC Net Outflows

Experts say these 3 altcoins will rally 3,000% soon, and XRP isn’t one of them

Robert Kiyosaki Hints At Economic Depression Ahead, What It Means For BTC?

BNB Steadies Above Support: Will Bullish Momentum Return?

Metaplanet makes largest Bitcoin bet, acquires nearly 620 BTC

Tron’s Justin Sun Offloads 50% ETH Holdings, Ethereum Price Crash Imminent?

Investors bet on this $0.0013 token destined to leave Cardano and Shiba Inu behind

End of Altcoin Season? Glassnode Co-Founders Warn Alts in Danger of Lagging Behind After Last Week’s Correction

Can Pi Network Price Triple Before 2024 Ends?

XRP’s $5, $10 goals are trending, but this altcoin with 7,400% potential takes the spotlight

CryptoQuant Hails Binance Reserve Amid High Leverage Trading

Trump Picks Bo Hines to Lead Presidential Crypto Council

The introduction of Hydra could see Cardano surpass Ethereum with 100,000 TPS
182267361726451435
Why Did Trump Change His Mind on Bitcoin?

Top Crypto News Headlines of The Week

New U.S. president must bring clarity to crypto regulation, analyst says

Will XRP Price Defend $0.5 Support If SEC Decides to Appeal?

Bitcoin Open-Source Development Takes The Stage In Nashville

Ethereum, Solana touch key levels as Bitcoin spikes

Bitcoin 20% Surge In 3 Weeks Teases Record-Breaking Potential

Ethereum Crash A Buying Opportunity? This Whale Thinks So

Shiba Inu Price Slips 4% as 3500% Burn Rate Surge Fails to Halt Correction

Washington financial watchdog warns of scam involving fake crypto ‘professors’

‘Hamster Kombat’ Airdrop Delayed as Pre-Market Trading for Telegram Game Expands

Citigroup Executive Steps Down To Explore Crypto
Mostbet Güvenilir Mi – Casino Bonus 2024

NoOnes Bitcoin Philosophy: Everyone Eats

 3 months ago
182267361726451435

 Donald Trump5 months ago
Why Did Trump Change His Mind on Bitcoin?
 24/7 Cryptocurrency News4 months ago
Top Crypto News Headlines of The Week
 News4 months ago
New U.S. president must bring clarity to crypto regulation, analyst says
 Price analysis4 months ago
Will XRP Price Defend $0.5 Support If SEC Decides to Appeal?
 Opinion5 months ago
Bitcoin Open-Source Development Takes The Stage In Nashville
 Bitcoin5 months ago
Ethereum, Solana touch key levels as Bitcoin spikes
 Bitcoin5 months ago
Bitcoin 20% Surge In 3 Weeks Teases Record-Breaking Potential
