
Bitcoin
NFT sales surge 34%, Ethereum network enjoys sales spike

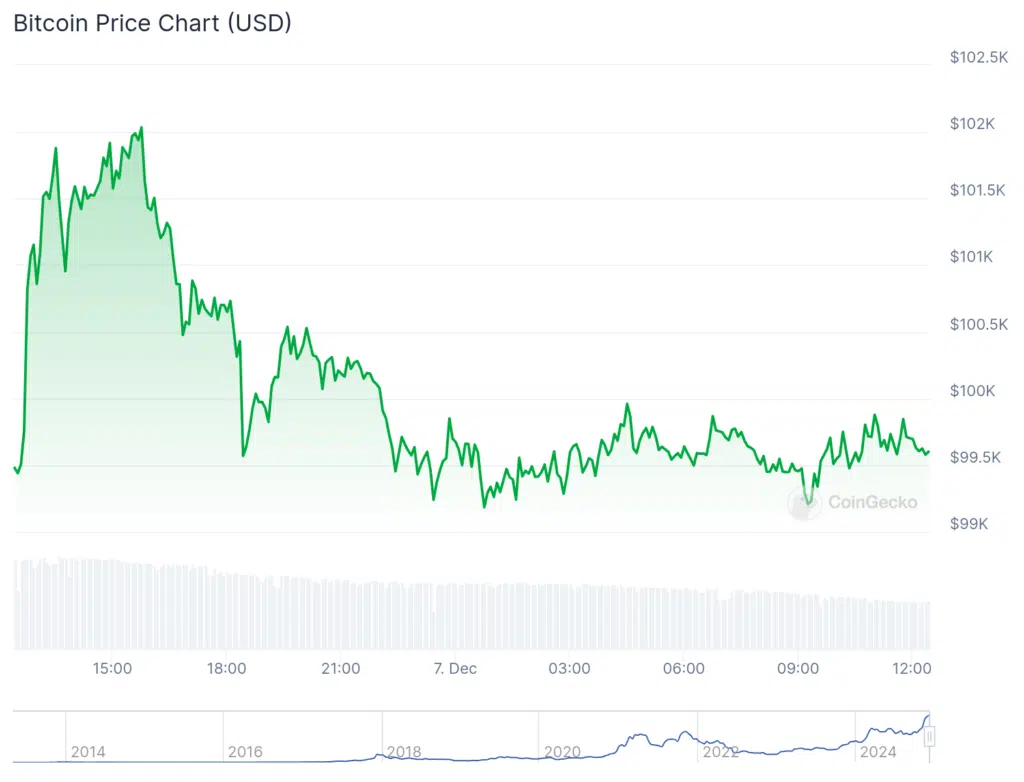
The non-fungible token, or NFT, market has shown decent growth amid Bitcoin’s historic breakthrough exceeding $100,000.
The surge in cryptocurrency prices continues as Ethereum (ETH) strengthens its position, climbing 3.5% in the last 24 hours to reclaim the $4,000 level.
The global cryptocurrency market capitalization has expanded to $3.67 trillion from last week’s $3.42 trillion. This is a 2.3% increase over the last day, with Bitcoin (BTC) trading around $99,611 at last check Saturday. See below.
According to the latest data from CryptoSlam, the NFT market has experienced a major upswing, with total sales volume reaching $196.2 million. This is a 34.23% increase from last week’s $146.5 million.
The market metrics show expansion across all key indicators:
- NFT buyers have increased to 693,833, showing a healthy 20.29% growth
- NFT sellers have grown to 402,069, with a 15.97% increase
- NFT transactions have slightly decreased by 1.92% to 1,405,054
Ethereum Leads with major Growth
The Ethereum NFT blockchain has shown the highest performance, nearly doubling its sales volume to $100.9 million. This marks a 97.33% increase in the last seven days. The network has attracted 61,020 buyers, representing a 23.15% growth. Notably, wash trading also increased by 52.79% to $18.2 million, indicating heightened market activity.
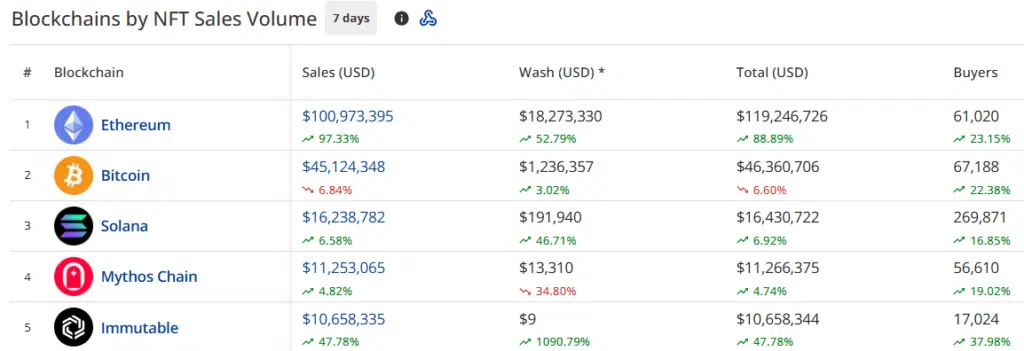
Bitcoin’s NFT ecosystem, while maintaining its second position, experienced a slight decline of 6.84%. The sales volume of the Bitcoin network stood at $45.1 million. However, the network continues to show strong user engagement with 67,188 buyers, a 22.38% increase from the previous period.
Solana (SOL) has maintained its third position with $16.2 million in sales. Solana has shown only a modest 6.58% increase. However, the network has strong user participation with 269,871 buyers.
Mythos Chain and ImmutableX (IMX) round out the top five, with sales of $11.2 million and $10.6 million, respectively.
Pudgy Penguins Lead Collection Rankings
The announcement of their PENGU token launch has pushed Pudgy Penguins to the top position with $21.6 million in sales. This marks a 384.26% increase in the last seven days.
CryptoPunks follows closely with $21.3 million in sales, showing impressive growth of 173.86%. BRC-20 NFTs have moved to third place with $9.9 million in sales, while Guild of Guardians Heroes and Uncategorized Ordinals complete the top five with $8.9 million and $8.4 million in sales, respectively.
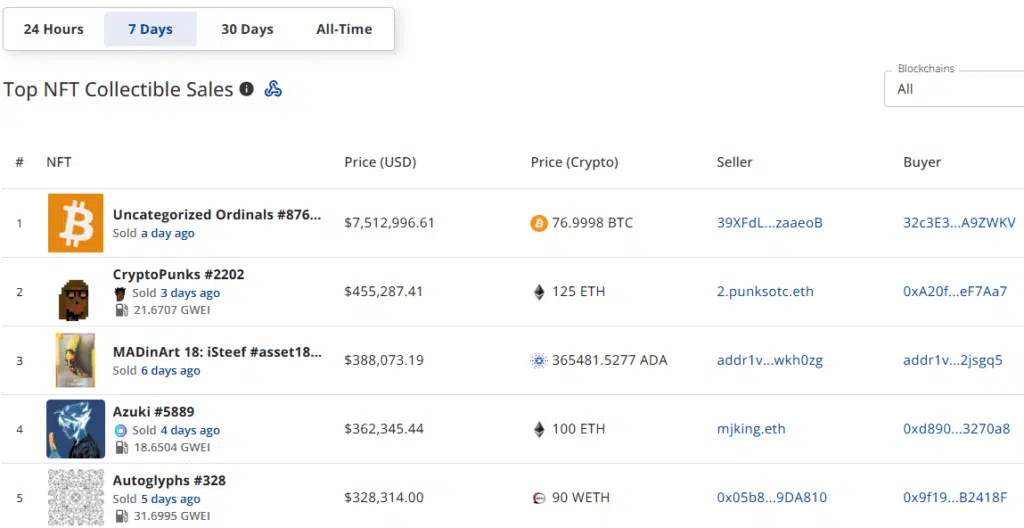
Notable individual sales this week include:
- Uncategorized Ordinals #876 sold for $7,512,996 (76.9998 BTC)
- CryptoPunks #2202 sold for $455,287 (125 ETH)
- MADinArt 18: iSteef #asset18 sold for $388,073 (365,481.5277 ADA)
- Azuki #5889 sold for $362,345 (100 ETH)
- Autoglyphs #328 sold for $328,314 (90 WETH)
This week’s data reflects a maturing NFT market with major growth in both established collections and new entrants.
Source link


Hopes for the crypto recovery to continue vanished on Friday, as a market-wide rout erased virtually all gains from earlier this week.
Bitcoin (BTC), hovering just below $88,000 a day ago, tumbled to $83,800 recently and is down 3.8% over the past 24 hours. The broad-market benchmark CoinDesk 20 Index declined 5.7%, with native cryptos Avalanche (AVAX), Polygon (POL), Near (NEAR), and Uniswap (UNI) all nursing almost 10% losses during the same period. Today’s sell-off wiped out $115 billion of the total market value of cryptocurrencies, TradingView data shows.

Ethereum’s ether (ETH) declined over 6% to extend its downtrend against BTC, falling to its weakest relative price to the largest cryptocurrency since May 2020. Underscoring the bearish trend, spot ETH exchange-traded funds failed to attract any net inflows since early March, while their BTC counterparts saw over $1 billion of inflows in the past two weeks, according to Farside Investors data.
The ugly crypto price action coincided with U.S. stocks selling off during the day on poor economic data, with the S&P 500 and the tech-heavy Nasdaq index down 2% and 2.8%, respectively. Crypto-focused stocks also suffered heavy losses: Strategy (MSTR), the largest corporate BTC holder, closed the day 10% lower, while crypto exchange Coinbase (COIN) dropped 7.7%.
The February PCE inflation report, released this morning, showed a 2.5% year-over-year increase in the price index, with core inflation at 2.8%, slightly above expectations. Consumer spending showed a modest 0.4% rise, though inflation-adjusted figures indicate minimal growth, suggesting potential headwinds for economic growth. The Federal Reserve of Atlanta’s GDPNow model now projects the U.S. economy to contract 2.8% in the first quarter, 0.5% adjusted for gold imports and exports, spurring stagflationary fears.
The implementation of broad-scale U.S. tariffs next week—the so-called “Liberation Day’ on April 2, as the Trump administration refers to—also compounded investor concerns across markets.
CME gapfill or another leg lower?
Bitcoin has closely correlated with the Nasdaq lately, so U.S. equities rolling over for another leg down could weigh on the broader crypto market. However, on a more optimistic note, today’s decline could be BTC filling the price gap at around $84,000-$85,000 between Monday’s open and the previous week’s close on the Chicago Mercantile Exchange futures market. Historically, BTC usually revisited similar CME gaps and a drop to $84,000 was in the cards, CoinDesk senior analyst James Van Straten noted earlier this week.
Read more: Bitcoin’s Weekend Surge Forms Another CME Gap, Signaling Possible Drop Back
“At this stage it’s difficult to determine if we have already seen a bottom in 2025,” Joel Kruger, market strategist at LMAX Group, said in a market note. Despite the on-going correction, he noted several positive trends such as crypto-friendly policies in the U.S. and more traditional financial firms entering the industry or expanding crypto offerings, which could bode well for digital assets later in the year.
“Any additional setbacks that we might see should be exceptionally well supported into the $70-75k area,” he added.
Source link

Following a sharp multi-week selloff that dragged Bitcoin from above $100,000 to below $80,000, the recent price bounce has traders debating whether the Bitcoin bull market is truly back on track or if this is merely a bear market rally before the next macro leg higher.
Bitcoin’s Local Bottom or Bull Market Pause?
Bitcoin’s latest correction was deep enough to rattle confidence, but shallow enough to maintain macro trend structure. Price seems to have set a local bottom between $76K–$77K, and several reliable metrics are beginning to solidify the local lows and point towards further upside.
The Net Unrealized Profit and Loss (NUPL) is one of the most reliable sentiment gauges across Bitcoin cycles. As price fell, NUPL dropped into “Anxiety” territory, but following the rebound, NUPL has now reclaimed the “Belief” zone, a critical sentiment transition historically seen at macro higher lows.

The Value Days Destroyed (VDD) Multiple weighs BTC spending by both coin age and transaction size, and compares the data to a previous yearly average, giving insight into long term holder behavior. Current readings have reset to low levels, suggesting that large, aged coins are not being moved. This is a clear signal of conviction from smart money. Similar dynamics preceded major price rallies in both the 2016/17 and 2020/21 bull cycles.

Bitcoin Long-Term Holders Boost Bull Market
We’re also now seeing the Long Term Holder Supply beginning to climb. After profit-taking above $100K, long-term participants are now re-accumulating at lower levels. Historically, these phases of accumulation have set the foundation for supply squeezes and subsequent parabolic price action.

Bitcoin Hash Ribbons Signal Bull Market Cross
The Hash Ribbons Indicator has just completed a bullish crossover, where the short-term hash rate trend moves above the longer-term average. This signal has historically aligned with bottoms and trend reversals. Given that miner behavior tends to reflect profitability expectations, this cross suggests miners are now confident in higher prices ahead.

Bitcoin Bull Market Tied to Stocks
Despite bullish on-chain data, Bitcoin remains closely tied to macro liquidity trends and equity markets, particularly the S&P 500. As long as that correlation holds, BTC will be partially at the mercy of global monetary policy, risk sentiment, and liquidity flows. While rate cut expectations have helped risk assets bounce, any sharp reversal could cause renewed choppiness for Bitcoin.

Bitcoin Bull Market Outlook
From a data-driven perspective, Bitcoin looks increasingly well-positioned for a sustained continuation of its bull cycle. On-chain metrics paint a compelling picture of resilience for the Bitcoin bull market. The Net Unrealized Profit and Loss (NUPL) has shifted from “Anxiety” during the dip to the “Belief” zone after the rebound—a transition often seen at macro higher lows. Similarly, the Value Days Destroyed (VDD) Multiple has reset to levels signaling conviction among long-term holders, echoing patterns before Bitcoin’s rallies in 2016/17 and 2020/21. These metrics point to structural strength, bolstered by long-term holders aggressively accumulating supply below $80,000.
Further supporting this, the Hash Ribbons indicator’s recent bullish crossover reflects growing miner confidence in Bitcoin’s profitability, a reliable sign of trend reversals historically. This accumulation phase suggests the Bitcoin bull market may be gearing up for a supply squeeze, a dynamic that has fueled parabolic moves before. The data collectively highlights resilience, not weakness, as long-term holders seize the dip as an opportunity. Yet, this strength hinges on more than just on-chain signals—external factors will play a critical role in what comes next.
However, macro conditions still warrant caution, as the Bitcoin bull market doesn’t operate in isolation. Bull markets take time to build momentum, often needing steady accumulation and favorable conditions to ignite the next leg higher. While the local bottom between $76K–$77K seems to hold, the path forward won’t likely feature vertical candles of peak euphoria yet. Bitcoin’s tie to the S&P 500 and global liquidity trends means volatility could emerge from shifts in monetary policy or risk sentiment.
For example, while rate cut expectations have lifted risk assets, an abrupt reversal—perhaps from inflation spikes or geopolitical shocks—could test Bitcoin’s stability. Thus, even with on-chain data signaling a robust setup, the next phase of the Bitcoin bull market will likely unfold in measured steps. Traders anticipating a return to six-figure prices will need patience as the market builds its foundation.
If you’re interested in more in-depth analysis and real-time data, consider checking out Bitcoin Magazine Pro for valuable insights into the Bitcoin market.
Disclaimer: This article is for informational purposes only and should not be considered financial advice. Always do your own research before making any investment decisions.
Source link

Is Strategy (MSTR) in trouble?
Led by Executive Chairman Michael Saylor, the firm formerly known as MicroStrategy has vacuumed up 506,137 bitcoin (BTC), currently worth roughly $44 billion at BTC’s current price near $87,000, in the span of about five years. To the casual observer, the company seems to have a magic, unlimited pool of funds from which to draw on to buy more bitcoin. But Strategy acquired a sizable chunk of its stash by issuing billions of dollars in equity and convertible notes (debt securities which can be converted into equity under special conditions), and more recently via the issuance of preferred stock, a type of equity that provides dividends to investors.
However, the price of bitcoin has been pushed down about 20% since peaking above $109,000 two months ago. And though such swings in prices are far from unusual, the particularly aggressive recent purchases by Saylor and team mean Strategy’s average acquisition price has risen to $66,000. The company is really only one more moderate swing down in price from being in the red on its buys.
Which begs the question: Could all of Strategy’s financial wizardry end up backfiring on the company should bitcoin keep heading lower?
“It’s highly unlikely that it results in a scenario where [Strategy] has to liquidate a bunch of bitcoin because it gets margin called,” Quinn Thompson, founder of crypto hedge fund Lekker Capital, told CoinDesk in an interview. “For the most part, the debt is very likely to be able to be refinanced for the convertible notes. And then [the firm] started issuing this perpetual preferred stock, which never has to be repaid.”
In other words, not only is there very little chance that Strategy could suffer the kind of blowup that shook over crypto firms and projects in 2022 (like Genesis or Three Arrows Capital), but the firm has even refrained from posting its bitcoin holdings as collateral for loans — with the exception of a loan taken from Silvergate, which was repaid in 2023.
Even so, that does not necessarily mean that it’s blue skies ahead for MSTR investors, because under various scenarios, Saylor could be forced to issue more equity than the market can handle in order to maintain course.
“If he’s not paying dividends with Strategy’s cash flow, he’s going to issue more shares and wreck the stock price. But it’s no different than what he’s doing already. Every time the retail bids it up, he wrecks the stock price by issuing more shares. In the future, he will have to do that, and the flows might not go into bitcoin. They might go to repay these debtors, and it will hurt the share price,” Thompson said.
Saylor’s balancing act
Strategy currently employs three different methods for raising capital: it can issue equity, convertible notes, or preferred stock.
Issuing equity means that Strategy creates new MSTR shares, sells them on the market, and uses the proceeds to buy bitcoin. Naturally, that creates selling pressure on MSTR and can potentially push the stock downward.
Convertible notes have allowed Strategy to raise funds quickly without diluting MSTR stock. Typically, investors like these notes because they offer a solid yield, they benefit if the stock surges, and they can usually be redeemed in cash for an amount equal to the original investment in addition to interest payments. The tremendous volatility of Strategy’s convertible notes, however, has allowed the company to mostly issue them at a zero percent interest rate and still meet high demand from sophisticated market participants, who have made bank trading that volatility.
Finally, Strategy has begun deploying preferred stocks. These are instruments that tend to appeal to investors seeking lower volatility and more predictable returns through dividends. There are currently two offerings: STRK, which gives an 8% annual return; and STRF, which pays 10% annualized.
But why is Strategy issuing all of these different types of investment vehicles? The idea is to create demand for Strategy for all kinds of investors that may have different tolerances to risk, Jeffrey Park, head of Alpha Strategies at crypto asset management Bitwise, told CoinDesk in an interview.
“The convertible bond investors and the common equity investors were generally aligned in that they were both volatility seeking structures,” Park said. “Preferred equities are different. They actually are favored by investors who want to minimize volatility at all costs for a steady, reliable and high coupon that they feel is worth the credit risk.”
“Strategy’s capital structure is almost like a seesaw in a playground,” Park added. “The common shareholders and converts are on one side, the preferred equity holders are on the other side. As sentiment shifts, the weights move around, and it tilts the value between these securities. But no matter how the seesaw moves, its total weight — which is Strategy’s enterprise value — remains the same. It’s just a redistribution of people’s perceived value across the liabilities that exist on the company’s balance sheet.”
Risks
Even so, Strategy now finds itself in a situation where it must pay 8% dividends on STRK, 10% dividends on STRF, and a blend of 0.4% interest rate on its convertible bonds.
With Strategy’s software business providing very little cash flow, finding the funds to pay for all of these dividends might be tricky.
The company will likely need to keep issuing MSTR stock to pay the interest it owes, Thompson said. “It will hurt the share price. In the most extreme scenario, the stock could trade at a discount [from its bitcoin holdings], because he would be having to issue shares to pay interest and cover cash flow.”
“The really draconian scenario would be for the discount to get so wide, like 20% or 30%, like Grayscale’s GBTC [prior to its conversion into an ETF], that the shareholders riot and tell him to buy back shares and close the discount,” Thompson added. “Right now, he’s adding shareholder value by selling the stock at an elevated price and buying bitcoin, but in the future the reverse might be true, where the best way to add shareholder value would be to sell the bitcoin and buy the stock. But that’s quite far away.”
Saylor lost controlling voting power over the company in 2024 due to the continuous issuance of MSTR stock, meaning that the scenario above could theoretically happen, especially if activist investors decided to get involved.
Another potential risk for MSTR holders is that the 2x long Strategy exchange-traded funds (ETFs) issued by T-Rex and Defiance, MSTX and MSTU, have seen weirdly persistent demand despite the stock’s drawdown. Every time investors want to gain or increase their exposure to these ETFs, the issuers have to buy twice as many MSTR shares. The popularity of these ETFs has helped create constant buying pressure for MSTR — so far, they’ve accumulated over $3 billion in MSTR exposure.


The problem is that the music might stop someday. And if these ETFs begin to sell off their MSTR shares, the reaction on the stock price could be violent.
“I don’t know where the endless capital comes from to buy the dip. These ETFs have gotten obliterated. They’re down huge,” Thompson said. “I mean, this is not a structural move up in the demand curve that you should count on. It’s not something you should really bake into your 10-year predictions of bitcoin price, but as long as it’s existing, it’s important for bitcoin. So I’m continually amazed by it.”
Source link
Bitcoin Plunges Below $84K as Crypto Sell-Off Wipes Out Weekly Gains

Top 4 Crypto to Buy Now as XRP Price Struggles above $2
Ethereum Price Hits 300-Week MA For The Second Time Ever, Here’s What Happened In 2022

US regulators FDIC and CFTC ease crypto restrictions for banks, derivatives

US Authorities Seize $201,400 Worth of USDT Held in Crypto Wallets Allegedly Intended to Support Hamas

Is Bitcoin’s Bull Market Truly Back?

Stablecoin Bills Unfairly Box Out Foreign Issuers Like Tether, Says House Majority Whip

THORChain price prediction | Is THORChain a good investment?

Strategy (MSTR) Holders Might be at Risk From Michael Saylor’s Financial Wizardry

3 Altcoins to Sell Before March 31 to Prepare for Crypto Bull Market

A Big Idea Whose Time Has Finally Come

XRP price may drop another 40% as Trump tariffs spook risk traders

Trader Says Ethereum-Based Altcoin Primed for 240%+ Rally if Major Resistance Level Breaks, Updates XRP Outlook

Congressman Ro Khanna Says Democrats Are Changing Their Tune On Bitcoin

France’s Public Investment Bank Bpifrance to Invest $27 Million in Crypto


 24/7 Cryptocurrency News5 months ago
Arthur Hayes, Murad’s Prediction For Meme Coins, AI & DeFi Coins For 2025

 Bitcoin2 months ago
Expert Sees Bitcoin Dipping To $50K While Bullish Signs Persist

 24/7 Cryptocurrency News3 months ago
Aptos Leverages Chainlink To Enhance Scalability and Data Access

 Bitcoin5 months ago
Bitcoin Could Rally to $80,000 on the Eve of US Elections

 Altcoins2 months ago
Sonic Now ‘Golden Standard’ of Layer-2s After Scaling Transactions to 16,000+ per Second, Says Andre Cronje

 Bitcoin4 months ago
Institutional Investors Go All In on Crypto as 57% Plan to Boost Allocations as Bull Run Heats Up, Sygnum Survey Reveals

 Opinion5 months ago
Crypto’s Big Trump Gamble Is Risky

 Price analysis5 months ago
Ripple-SEC Case Ends, But These 3 Rivals Could Jump 500x
