
doge
Ready To Rocket? Dogecoin Chart Hints At Major Gains Ahead

Crypto analyst Ali Martinez (@ali_charts) has spotlighted a potential trend reversal for Dogecoin, revealing that the popular memecoin has flashed a bullish technical signal on its daily chart. According to Martinez, the TD Sequential indicator has presented a “buy signal,” suggesting a price rebound could be on the horizon.
Dogecoin Prints TD9 Buy Signal
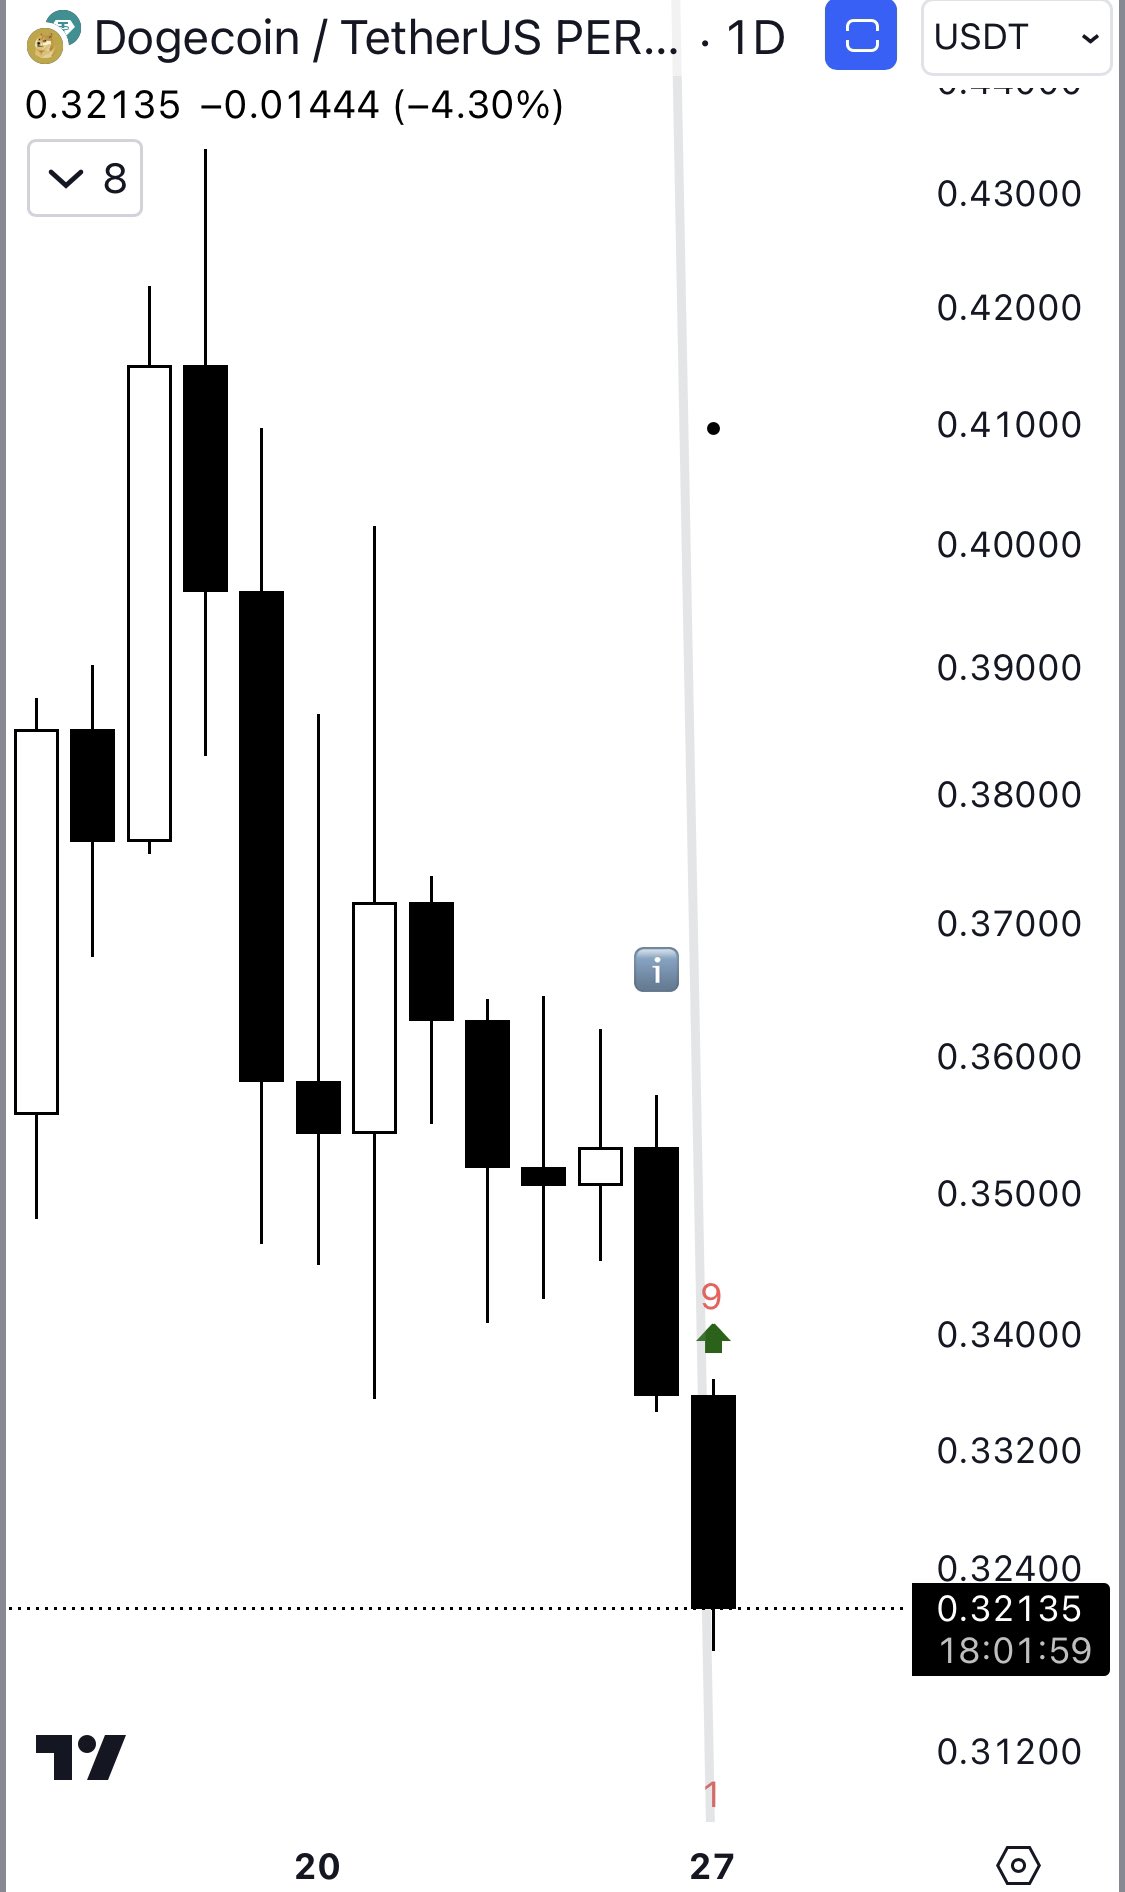
The shared chart—spanning daily candlesticks of the DOGE/USDT pair—illustrates 10 days of downward price action. Dogecoin has retreated from previous highs near $0.4843 to trade at approximately $0.32, shedding around -35% over the past few days. The most recent candle on the chart is a long black (bearish) bar, reflecting notable selling pressure that pushed prices towards $0.3200.
“The TD Sequential presents a buy signal on the Dogecoin daily chart, anticipating a price rebound!” Martinez posted via X. At the core of Martinez’s observation is the TD Sequential, a widely respected technical tool among seasoned traders. Developed by market technician Tom DeMark, the TD Sequential aims to identify price exhaustion points and potential reversals in ongoing trends. It works by counting a series of consecutive candles in one direction.
Related Reading
The indicator typically monitors up to nine consecutive bearish or bullish candles. When a count of nine is reached during a persistent downtrend, it often flags a possible bullish turning point—referred to as a “TD9 Buy Signal.” Conversely, nine consecutive higher closes in an uptrend can signal a potential bearish reversal.
In more extended setups, the indicator can continue counting to 13, offering further confirmation, but the “9” signal itself often draws the most immediate attention from traders. On this Dogecoin chart, the TD9 number has just appeared, signifying that the daily downtrend might be reaching a point of buyer interest. Following a “9” candle, the sequence restarts at “1,” which can hint at the beginning of a new bullish setup, should the upcoming candles confirm the reversal.
Price Levels to Watch
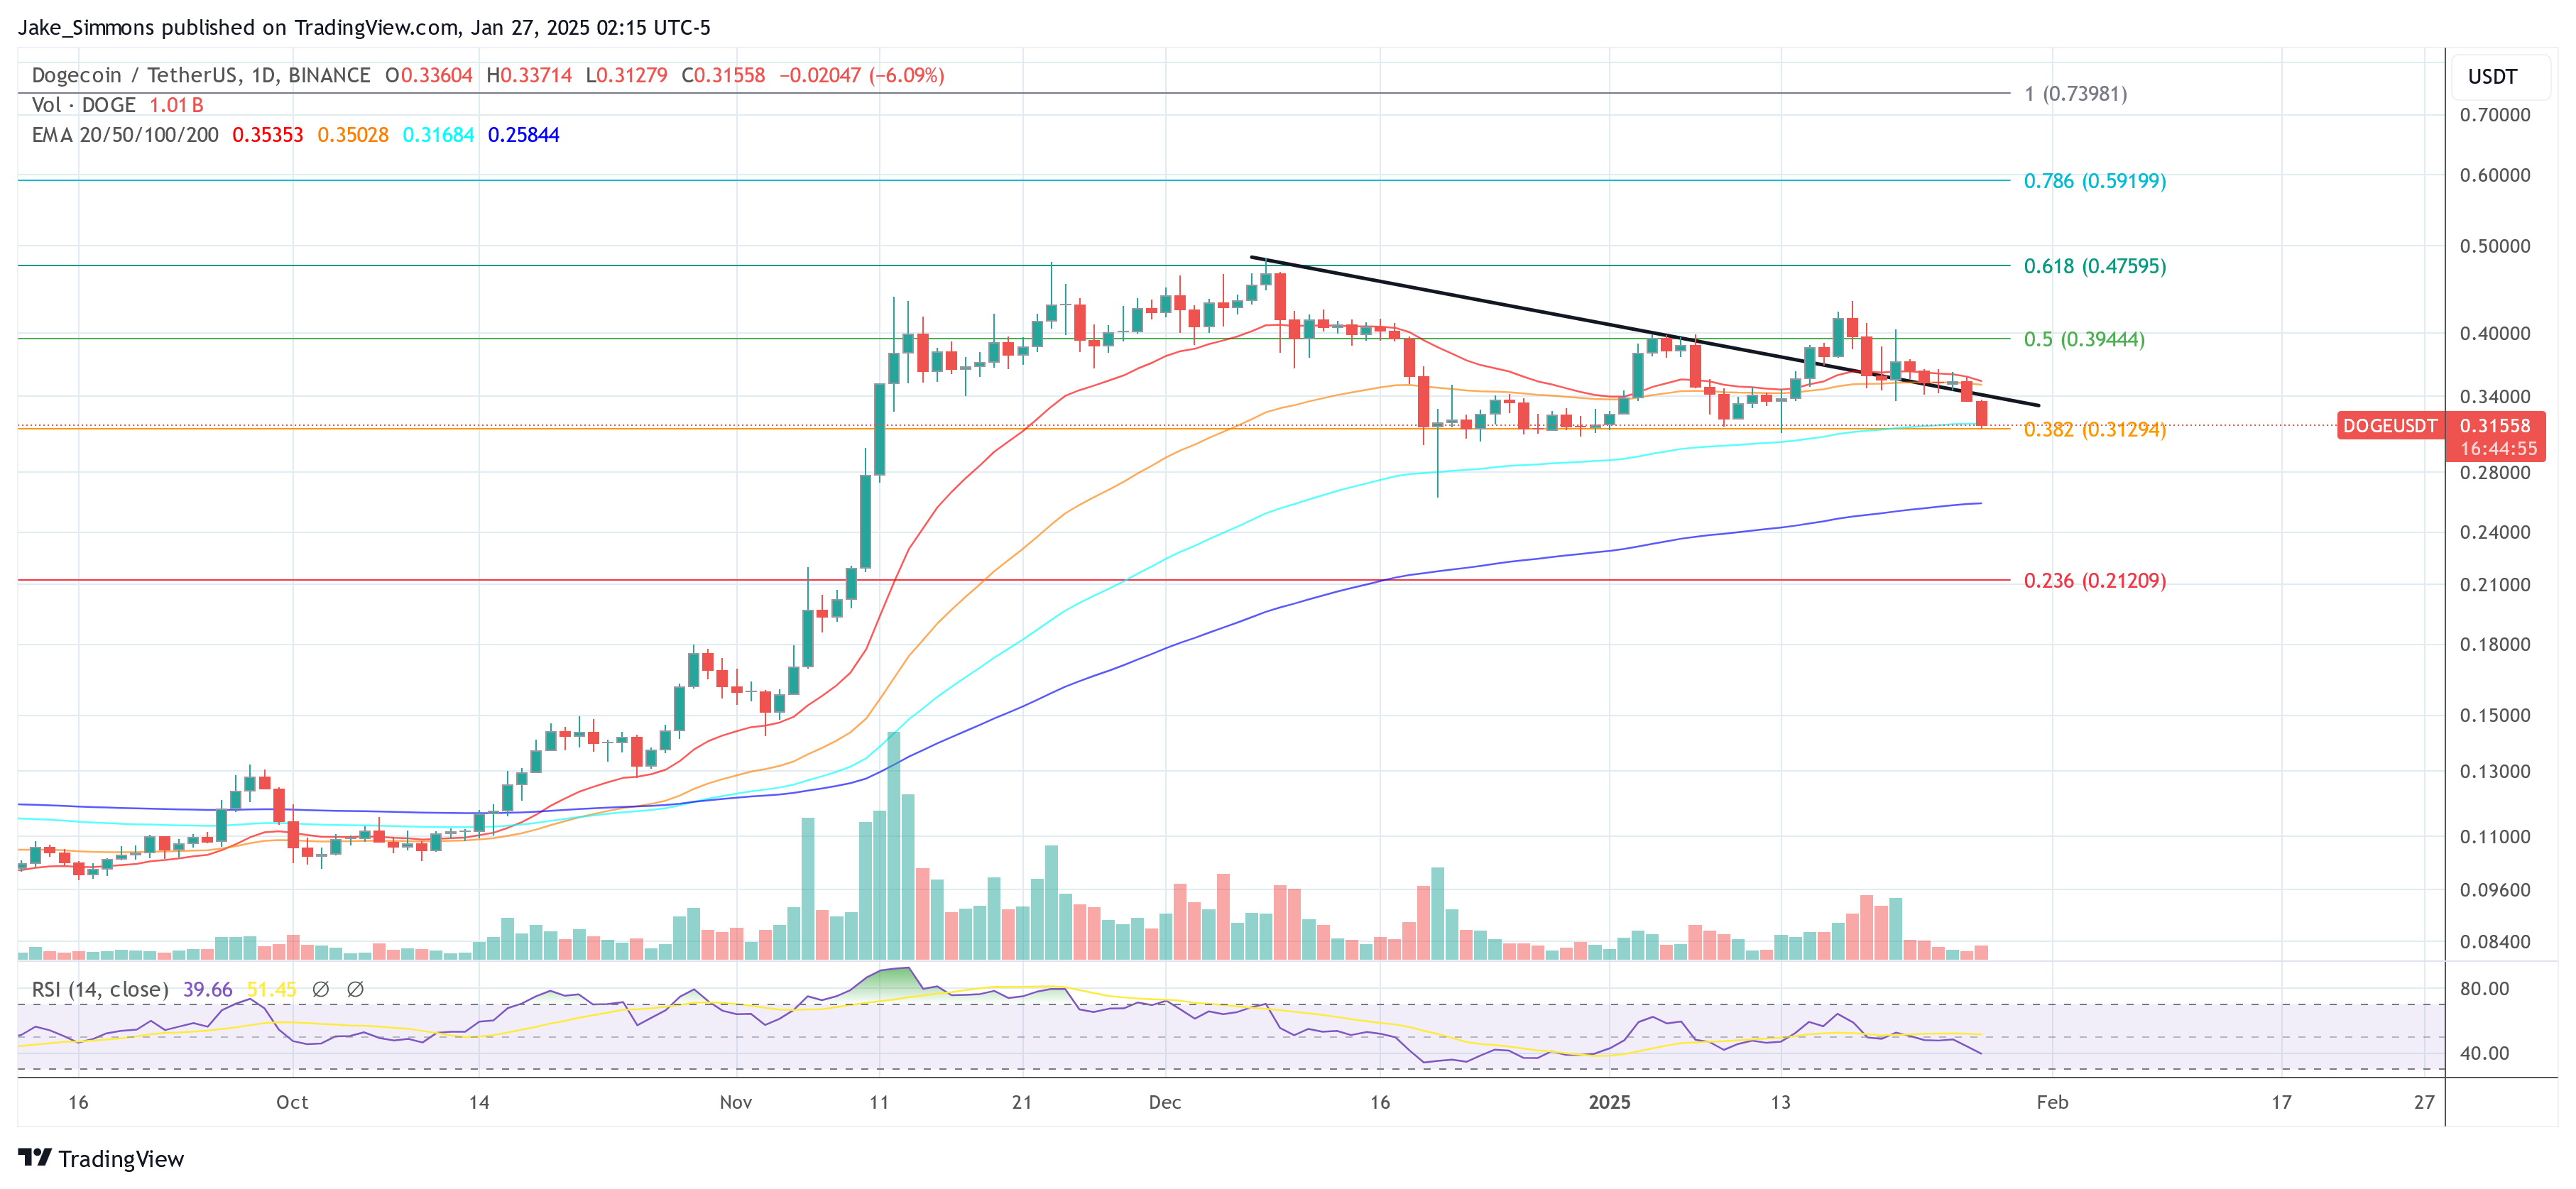
The most crucial support zone lies at $0.313, the 0.382 Fibonacci retracement level on the daily chart. Maintaining a daily close above this level could reinforce bullish momentum if buyers respond to the TD9 signal. Any attempt at a rebound will likely confront initial resistance around $0.3400, where the downtrend line is located. A decisive break above this (black) line may validate the anticipated trend reversal.
Related Reading
While further out of reach, regaining ground in the $0.4000 region (0.5 Fibonacci level at $0.395) would be a stronger sign that Dogecoin has recovered from its downward spiral. Overall, Dogecoin is at a crucial spot. The TD Sequential’s “buy” setup does not guarantee instant upside, but it does historically serve as a reliable early warning of trend fatigue.
If bullish traders capitalize on this signal, Dogecoin could stage a price recovery toward mid-range resistances. In contrast, failure to hold the $0.3100 area might prolong the current downward cycle.
Featured image created with DALL.E, chart from TradingView.com
Source link


Reason to trust
![]()
Strict editorial policy that focuses on accuracy, relevance, and impartiality
Created by industry experts and meticulously reviewed
The highest standards in reporting and publishing
Strict editorial policy that focuses on accuracy, relevance, and impartiality
Morbi pretium leo et nisl aliquam mollis. Quisque arcu lorem, ultricies quis pellentesque nec, ullamcorper eu odio.
Crypto analyst KrissPax has revealed that the Dogecoin price is mirroring a pattern from a previous bull run. Based on this, he raised the possibility of a price surge to $4 for the foremost meme coin.
Dogecoin Price Mirroring 2017 Pattern As It Eyes Rally To $4
In an X post, KrissPax stated that the Dogecoin price continues to trade in a similar pattern to the 2017 bull cycle. He added that if the second large breakout of this cycle happens, DOGE could surge well over its current all-time high (ATH) of $0.73. His accompanying chart showed that the foremost meme coin could reach $4 when this price breakout occurs.
Related Reading
Crypto analyst Master Kenobi also recently mentioned that the Dogecoin price is mirroring a bullish pattern from the 2017 bull run. Like KrissPax, he also alluded to DOGE witnessing a second parabolic phase of its bull run, just like in 2017. However, he gave a more conservative prediction, predicting that DOGE could rally to $1.1 by June later this year.
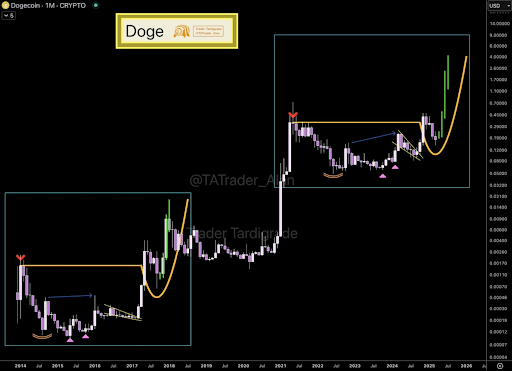
The Dogecoin price already looks set for the second phase of its bull run, seeing as the foremost meme coin looks bottomed. Crypto analysts like Trader Tardigrade also suggested that DOGE has bottomed, having dropped to as low as $0.14. Now, the foremost meme coin could be targeting new highs, especially with the Bitcoin price also in rebound mode.
Crypto analyst Ali Martinez stated that the Dogecoin price is breaking out of a triangle, which can result in a 16% upswing. The target is a rally to $0.183, which could pave the way for a further rally to the psychological $0.2 price level. Dogecoin whales are also actively accumulating in anticipation of this price surge, as they bought over 120 million DOGE last week.
A Breakout Has Yet To Occur
While analyzing DOGE’s daily chart, Trader Tardigrade warned that the Dogecoin price hasn’t broken out just yet. His accompanying chart showed that the foremost meme coin needs to break above $0.185 to confirm the breakout. The analyst also noted that DOGE is struggling to break a descending trendline, as it continues to stay below this resistance after several attempts.
Related Reading
However, the analyst provided some positives for the Dogecoin price, stating that the RSI has shown a breakout, indicating that DOGE has gained significant momentum recently. He added that a strong uptrend could occur if this momentum continues to build. The accompanying chart showed that the meme coin could record a parabolic rally to as high as $0.5 if it breaks above $0.185.
At the time of writing, the Dogecoin price is trading at around $0.18, up over 4% in the last 24 hours, according to data from CoinMarketCap.
Featured image from iStock, chart from Tradingview.com
Source link
Reason to trust
![]()
Strict editorial policy that focuses on accuracy, relevance, and impartiality
Created by industry experts and meticulously reviewed
The highest standards in reporting and publishing
Strict editorial policy that focuses on accuracy, relevance, and impartiality
Morbi pretium leo et nisl aliquam mollis. Quisque arcu lorem, ultricies quis pellentesque nec, ullamcorper eu odio.
Crypto analyst CobraVanguard has revealed the next price target for Dogecoin as an ascending triangle forms for the foremost meme coin. A rally to this price target could pave the way for the new highs, especially with the crypto market looking to be in rebound mode.
Next Target For Dogecoin As Ascending Triangle Forms
In a TradingView post, CobraVanguard set $0.197 as the next target for the Dogecoin price with an ascending triangle forming. He noted that this ascending triangle indicates a potential price increase. The analyst added that it is anticipated that the price could rise, aligning with the projected price movement of AB=CD.
Related Reading
Meanwhile, CobraVanguard warned that it is crucial to wait for the triangle to break before taking any action. His accompanying chart showed that Dogecoin needs to break above $0.177 to confirm a break above the ascending triangle. A break above that target would then lead to a rally to the $0.197 target.
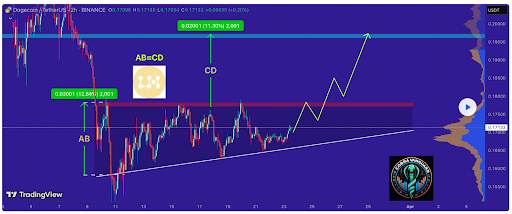
Dogecoin already looks to be in rebound mode at the moment, alongside Bitcoin, which is nearing the $90,000 mark again. The foremost meme coin is nearing the $0.177 target for a break above the ascending triangle. As crypto analyst Kevin Capital suggested, DOGE will likely rally as long as BTC is in bullish territory.
Crypto traders are also betting on a Dogecoin rally to the upside. Crypto analyst Ali Martinez revealed that 76.26% of traders with open DOGE positions on Binance futures are leaning bullish. This is particularly bullish because Binance traders have a good track record of being right most of the time. In another X post, Martinez revealed that whales bought over 120 million DOGE last week, which is also bullish for the foremost meme coin.
DOGE’s Market Structure Has Shifted
In an X post, crypto analyst Trader Tardigrade revealed that Dogecoin’s market structure has shifted. This came as he noted that Dogecoin is recovering from an ascending triangle, forming higher highs and higher lows from lower highs and lower lows.
Related Reading
Based on this, the analyst affirmed that Dogecoin had shifted the market structure from a downtrend to an uptrend on the hourly chart since it just formed the second higher high. His accompanying chart showed that DOGE is eyeing a rally to $0.177 as it continues to form higher highs.
Martinez raised the possibility of the Dogecoin price rallying to as high as $4 or even $20 in the long term. He stated that if DOGE holds above the $0.16 support at the lower boundary of an ascending channel, history suggests that it could rebound toward the mid-range at $4 or upper range at around $20.
At the time of writing, the Dogecoin price is trading at around $0.174, up over 3% in the last 24 hours, according to data from CoinMarketCap.
Featured image from Pexels, chart from Tradingview.com
Source link
doge
Trader Issues Urgent XRP Alert, Says the Top-Five Altcoin at Risk of Sharp Correction – Here’s His Target

Cryptocurrency trader Ali Martinez says a payments-focused altcoin must stay above a key price level to avoid a steep corrective move.
Martinez tells his 133,500 followers on the social media platform X that if XRP (XRP) falls below $2, it risks witnessing a deeper drawdown due to a lack of consolidation below the price level.
“XRP testing the waters! Below $2, a gap with no significant support could pull it to $1.60.”

Based on a chart citing on-chain data from blockchain analytics platform Glassnode, it appears that there’s an “air gap” between $2 and $1.60, indicating a weak foundation for XRP around that price zone.
XRP is trading at $2.56 at time of writing.
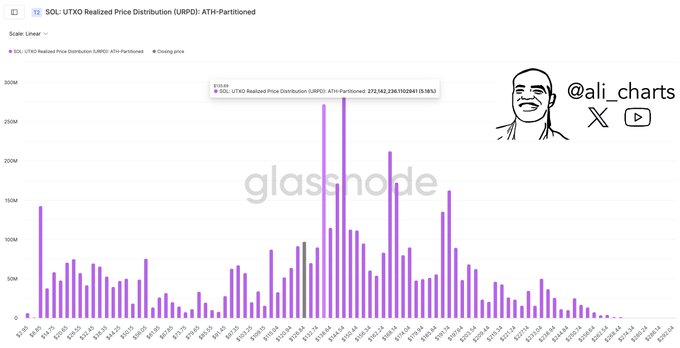
Next up is the layer-1 protocol Solana (SOL). According to Martinez, SOL is facing a “big test” at a resistance level a few percentage points above the current price.
“$135 stands as the most important resistance.”
The widely followed analyst further says that investors in the sixth-largest crypto asset by market cap are capitulating based on the altcoin’s net unrealized profit/loss metric (NUPL), an on-chain indicator that measures whether accumulators of a coin are in a state of profit or loss.
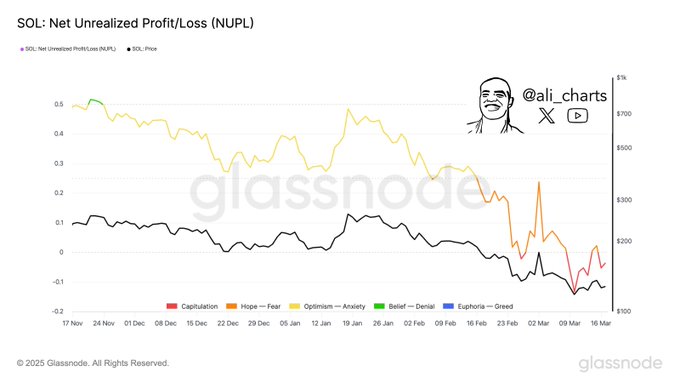
Based on the trader’s chart, SOL’s NUPL is hovering below the zero line, indicating that investors are witnessing losses and in the midst of capitulation.
Solana is trading at $132 at time of writing, down by around 55% from the all-time high price of $293 reached January 20th.
Looking at the top memecoin Dogecoin (DOGE), Martinez says that the altcoin has recorded significant demand in a week.
“Whale alert! Over 110 million Dogecoin bought up in a week. Big players are betting on a breakout.”

Dogecoin is trading at $0.173 at time of writing.
Follow us on X, Facebook and Telegram
Don’t Miss a Beat – Subscribe to get email alerts delivered directly to your inbox
Check Price Action
Surf The Daily Hodl Mix
 

Disclaimer: Opinions expressed at The Daily Hodl are not investment advice. Investors should do their due diligence before making any high-risk investments in Bitcoin, cryptocurrency or digital assets. Please be advised that your transfers and trades are at your own risk, and any losses you may incur are your responsibility. The Daily Hodl does not recommend the buying or selling of any cryptocurrencies or digital assets, nor is The Daily Hodl an investment advisor. Please note that The Daily Hodl participates in affiliate marketing.
Generated Image: Midjourney
Source link

Nasdaq Files To Launch a New Grayscale Avalanche (AVAX) Exchange-Traded Fund

How To Measure The Success Of A Bitcoin Treasury Company

Why ‘Tiger King’ Joe Exotic Launched a Solana Meme Coin From Behind Bars

Trump pardons BitMEX, is ‘Bitcoin Jesus’ Roger Ver next?

Terraform Labs to Open Claims Portal for Investors on March 31

BitGo CEO Calls For Regulation Amid Galaxy Digital’s Settlement

Ethereum Bulls Disappointed As Recovery Attempt Fails At $2,160 Resistance

US recession 40% likely in 2025, what it means for crypto — Analyst

Crypto Investment Firm Galaxy Digital Settles With New York AG for $200,000,000 Over Luna Allegations

Bitcoin Covenants: CHECKTEMPLATEVERIFY (BIP 119)

This Week in Bitcoin: GameStop Reveals Reserve, But Inflation Fears Rear Their Head

Solana price prepares a wild ride as risks rise

FTX to Begin $11.4B Creditor Payouts in May After Years-Long Bankruptcy Battle

Here’s Why Crypto Market Is Bleeding Today

Support Or Resistance? Chainlink (LINK) Investor Data Suggests Key Price Zones


 24/7 Cryptocurrency News5 months ago
Arthur Hayes, Murad’s Prediction For Meme Coins, AI & DeFi Coins For 2025

 Bitcoin2 months ago
Expert Sees Bitcoin Dipping To $50K While Bullish Signs Persist

 24/7 Cryptocurrency News3 months ago
Aptos Leverages Chainlink To Enhance Scalability and Data Access

 Bitcoin5 months ago
Bitcoin Could Rally to $80,000 on the Eve of US Elections

 Altcoins2 months ago
Sonic Now ‘Golden Standard’ of Layer-2s After Scaling Transactions to 16,000+ per Second, Says Andre Cronje

 Bitcoin5 months ago
Institutional Investors Go All In on Crypto as 57% Plan to Boost Allocations as Bull Run Heats Up, Sygnum Survey Reveals

 Opinion5 months ago
Crypto’s Big Trump Gamble Is Risky

 Price analysis5 months ago
Ripple-SEC Case Ends, But These 3 Rivals Could Jump 500x
