Price analysis
Shiba Inu Price Eyes 76% Rally As 6.8m SHIB Tokens Burned
Published
5 months agoon
By
admin
Shiba Inu price has underperformed other popular meme coins in the past few days. SHIB trades at $0.000026 on Monday, where it has been stuck since November 10, as investors anticipate more upside as the burn rate rebounds.
Shiba Inu Price Likely to Rally 76% As 6.8m SHIB Burnt
One potential catalyst for the SHIB price is that the number of coins in circulation continues to drop, helped by the robust token burn. Data by Shiburn shows that the amount of these burns rose by 40% in the past 24 hours to 4.85 million.
Therefore, the number of Shiba Inu tokens has continued to drop from the original 999 trillion to 410 trillion, a figure that will continue falling in the future. The token burn is when SHIB coins are moved to an inaccessible wallet either voluntarily or from ecosystem fees to be removed from the circulating supply forever.
These token burns help to create value for existing tokens by reducing the number of coins in circulation. It is often compared to when a company executes a share buyback, which in turn increases the earnings per share.
Some of the top players in this ecosystem are ShibaSwap and Shibarium. ShibaSwap is a decentralized DEX network where people swap tokens, while Shibarium is a layer-2 network that has completed over 500 million transactions. Data on its website shows that ShibaSwap’s volume has jumped to $75 million this month, the highest level since March.


SHIB Price Analysis: Shiba Inu Bulls Prepares For Uptrend
In an X post, Shib Knight, a popular crypto analyst predicted that the SHIB was preparing for its next leg and that it looked “sendy”.
The most bullish case for the Shiba Inu price rally is a cup-and-handle pattern on the daily chart. This techncial formation contains a rounded bottom that looks like a cup, which is often followed by a minor retracement that forms the handle. Hence, the namesake.
The target of $0.000045 for this setup is obtained by measuring the depth of the cup and adding it to the neckline, connecting the cup and handle’s swing highs.
The upper side of this pattern is at $0.000030, where it has struggled to move above since May. According to this pattern, the ongoing consolidation is part of the formation of a handle section. In most periods, this pattern is one of the most bullish patterns in the market.
Additionally, Shiba Inu price has formed a golden cross pattern as the 50-day and 200-day Exponential Moving Averages (EMA) have formed a bullish crossover. Therefore, the confirmation for the next leg up will come if the SHIB rises above the upper side of the cup at $0.000030. If this happens, SHIB could jump to $0.000045, its highest level this year, which is about 76% above the current level.


On the flip side, this Shiba Inu price prediction will become invalid if the coin drops below the key psychological point at $0.000023. A drop below that level will point to more downside, potentially to $0.0000158, its lowest point on October 25.
Frequently Asked Questions (FAQs)
It has strong technicals after forming a golden cross pattern and a cup and handle. A cross above the cup will point to more gains, potentially to the year-to-date high of $0.000045.
Odds are that the SHIB price will stage a strong rally soon. However, a drop below the support at $0.000022 will invalidate the bullish view and raise the odds of it falling to $0.00001.
Shiba Inu’s burn rate is continuing, while analysts expect the ongoing crypto bull run will continue in the near term.
crispus
Disclaimer: The presented content may include the personal opinion of the author and is subject to market condition. Do your market research before investing in cryptocurrencies. The author or the publication does not hold any responsibility for your personal financial loss.
Source link
You may like


Solana Eyes $200 Target As It Gains Momentum – Recovery Could Mirror 3-Month Downtrend


BTC-denominated insurance firm meanwhile secures $40m in VC funding


‘You Want To Own the Most Hated Thing’ – Arthur Hayes Says Ethereum Set To Outrun Solana As Memecoin Craze Fades


Crypto Braces for a Hidden $4.5 Trillion Catalyst for Bitcoin, Ethereum, Cardano, XRP Price


Block Agrees to $40M NYDFS Penalty Over Lackluster Compliance Program


Top Bitcoin miners produced nearly $800M of BTC in Q1 2025
BTC price
Crypto Braces for a Hidden $4.5 Trillion Catalyst for Bitcoin, Ethereum, Cardano, XRP Price
Published
3 hours agoon
April 10, 2025By
admin
Crypto prices stabilized on Thursday, helped by the falling US inflation, Donald Trump’s flexibility on tariffs, and Paul Atkins confirmation as SEC chair. Still, Bitcoin, Ethereum, Cardano, and XRP prices have a hidden $4.5 trillion catalyst that may propel them higher this quarter.
Crypto Prices Awaits for a $4.5 Trillion Catalyst
Most crypto investors are ignoring a $4.5 trillion catalyst hidden in plain sight. This catalyst is Donald Trump’s Big, Beautiful Bill that will may be passed into law soon. In an X post, Trump called it the biggest tax cuts in USA history, saying:
“Great News! “The Big, Beautiful Bill” is coming along really well. Republicans are working together nicely. Biggest Tax Cuts in USA History!!! Getting close.”
The bill will be bullish for crypto coins like Bitcoin, Ethereum, Cardano, and XRP because of the amount it seeks to cut. The estimate is that it will extend the 2017 cuts in the Tax Cuts and Jobs Act. On top of this, it will have more incentives like eliminating taxes on tips and overtime pay.
This means that taxpayers will have more money in their bank accounts, which some may divert to investing in the crypto market. Historically, many young people use their savings to speculate in assets like Bitcoin, Cardano, Ethereum, and XRP.
Interest Rate Cuts to Boost Bitcoin, Cardano, Ethereum, and XRP Price


On top of this, the Federal Reserve may deliver another bazooka by cutting interest rates now that US inflation is falling. Data released on Thursday showed that US inflation dropped to 2.4%, and is slowly nearing the Fed target of 2.0%.
The odds of a rate cut have risen after Donald Trump declared tariffs on most countries. While he has paused tariffs on over 70 countries, he maintained the base 10%. He also maintained hefty taxes on cars, steel, and aluminum. Additionally, he boosted China tariffs to 125%.
Therefore, in a note, Mark Zandi, the respected economist at Moody’s, boosted his recession odds to 60%. He also warned that global investors may start losing faith in the US, making its bonds less of a safe haven.


Therefore, a combination of falling inflation and slow economic growth means that the Fed may deliver more cuts than expected. Polymarket traders have placed a 52% chance of the Fed cutting by June this year. Another poll shows that more participants see the Fed cutting rates three times this year.
On top of this, the Senate voted for Paul Atkins as the SEC Chair, which will lead to more deregulation and ETF approvals.
The Bottomline
Bitcoin, Cardano, Ethereum, and XRP price remain in a deep bear market this year and are in search of a catalyst. The top catalysts to watch will be the potential interest rate cuts, US tax cuts, and the recent confirmation of Atkins as the SEC chair.
Frequently Asked Questions (FAQs)
Tax cuts are seen as stimulus packages, which help to boost risky assets like cryptocurrencies like BTC, ETH, ADA, and XRP.
The most likely catalyst for these cryptocurrencies is the upcoming Federal Reserve interest rate cuts and the recent Paul Atkins confirmation.
Analysts expect the Federal Reserve will cut interest rates three times, which is a bullish sign for crypto coins.
crispus
Crispus is a seasoned Financial Analyst at CoinGape with over 12 years of experience. He focuses on Bitcoin and other altcoins, covering the intersection of news and analysis. His insights have been featured on renowned platforms such as BanklessTimes, CoinJournal, HypeIndex, SeekingAlpha, Forbes, InvestingCube, Investing.com, and MoneyTransfers.com.
Disclaimer: The presented content may include the personal opinion of the author and is subject to market condition. Do your market research before investing in cryptocurrencies. The author or the publication does not hold any responsibility for your personal financial loss.
Source link
Ethereum
4 charts that explain the ongoing Ethereum price crash
Published
2 days agoon
April 8, 2025By
admin
Ethereum price has been on a freefall this year, making it one of the worst-performing major cryptocurrencies.
Ethereum (ETH) has dropped for three consecutive weeks, falling to its lowest level since March 2023. It has lost over half of its value from its November peak, costing investors billions. This article breaks down the ongoing Ethereum price crash using key charts.
Spot Ethereum ETFs have had substantial outflows
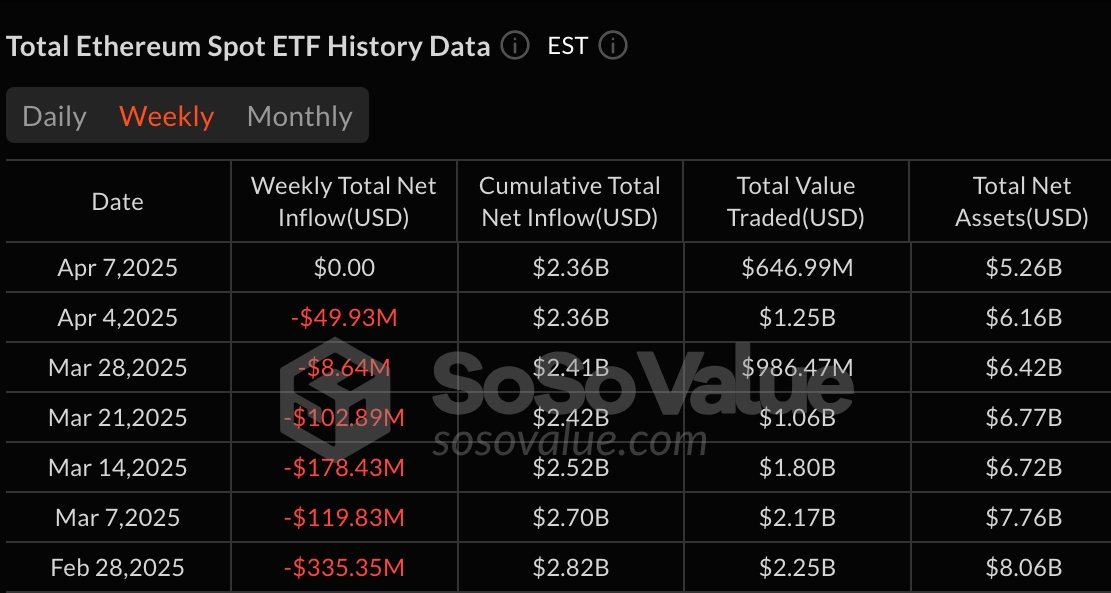
One reason why the ETH price has plunged is that spot ETFs have had substantial outflows this year, pointing to weak demand in the United States. The chart below shows that these funds have had net outflows in the last six consecutive weeks. These funds now have just $2.3 billion in net inflows compared to Bitcoin’s $35 billion. That is a sign that investors prefer Bitcoin to ETH by a wide margin.
Ethereum no longer leads in fees
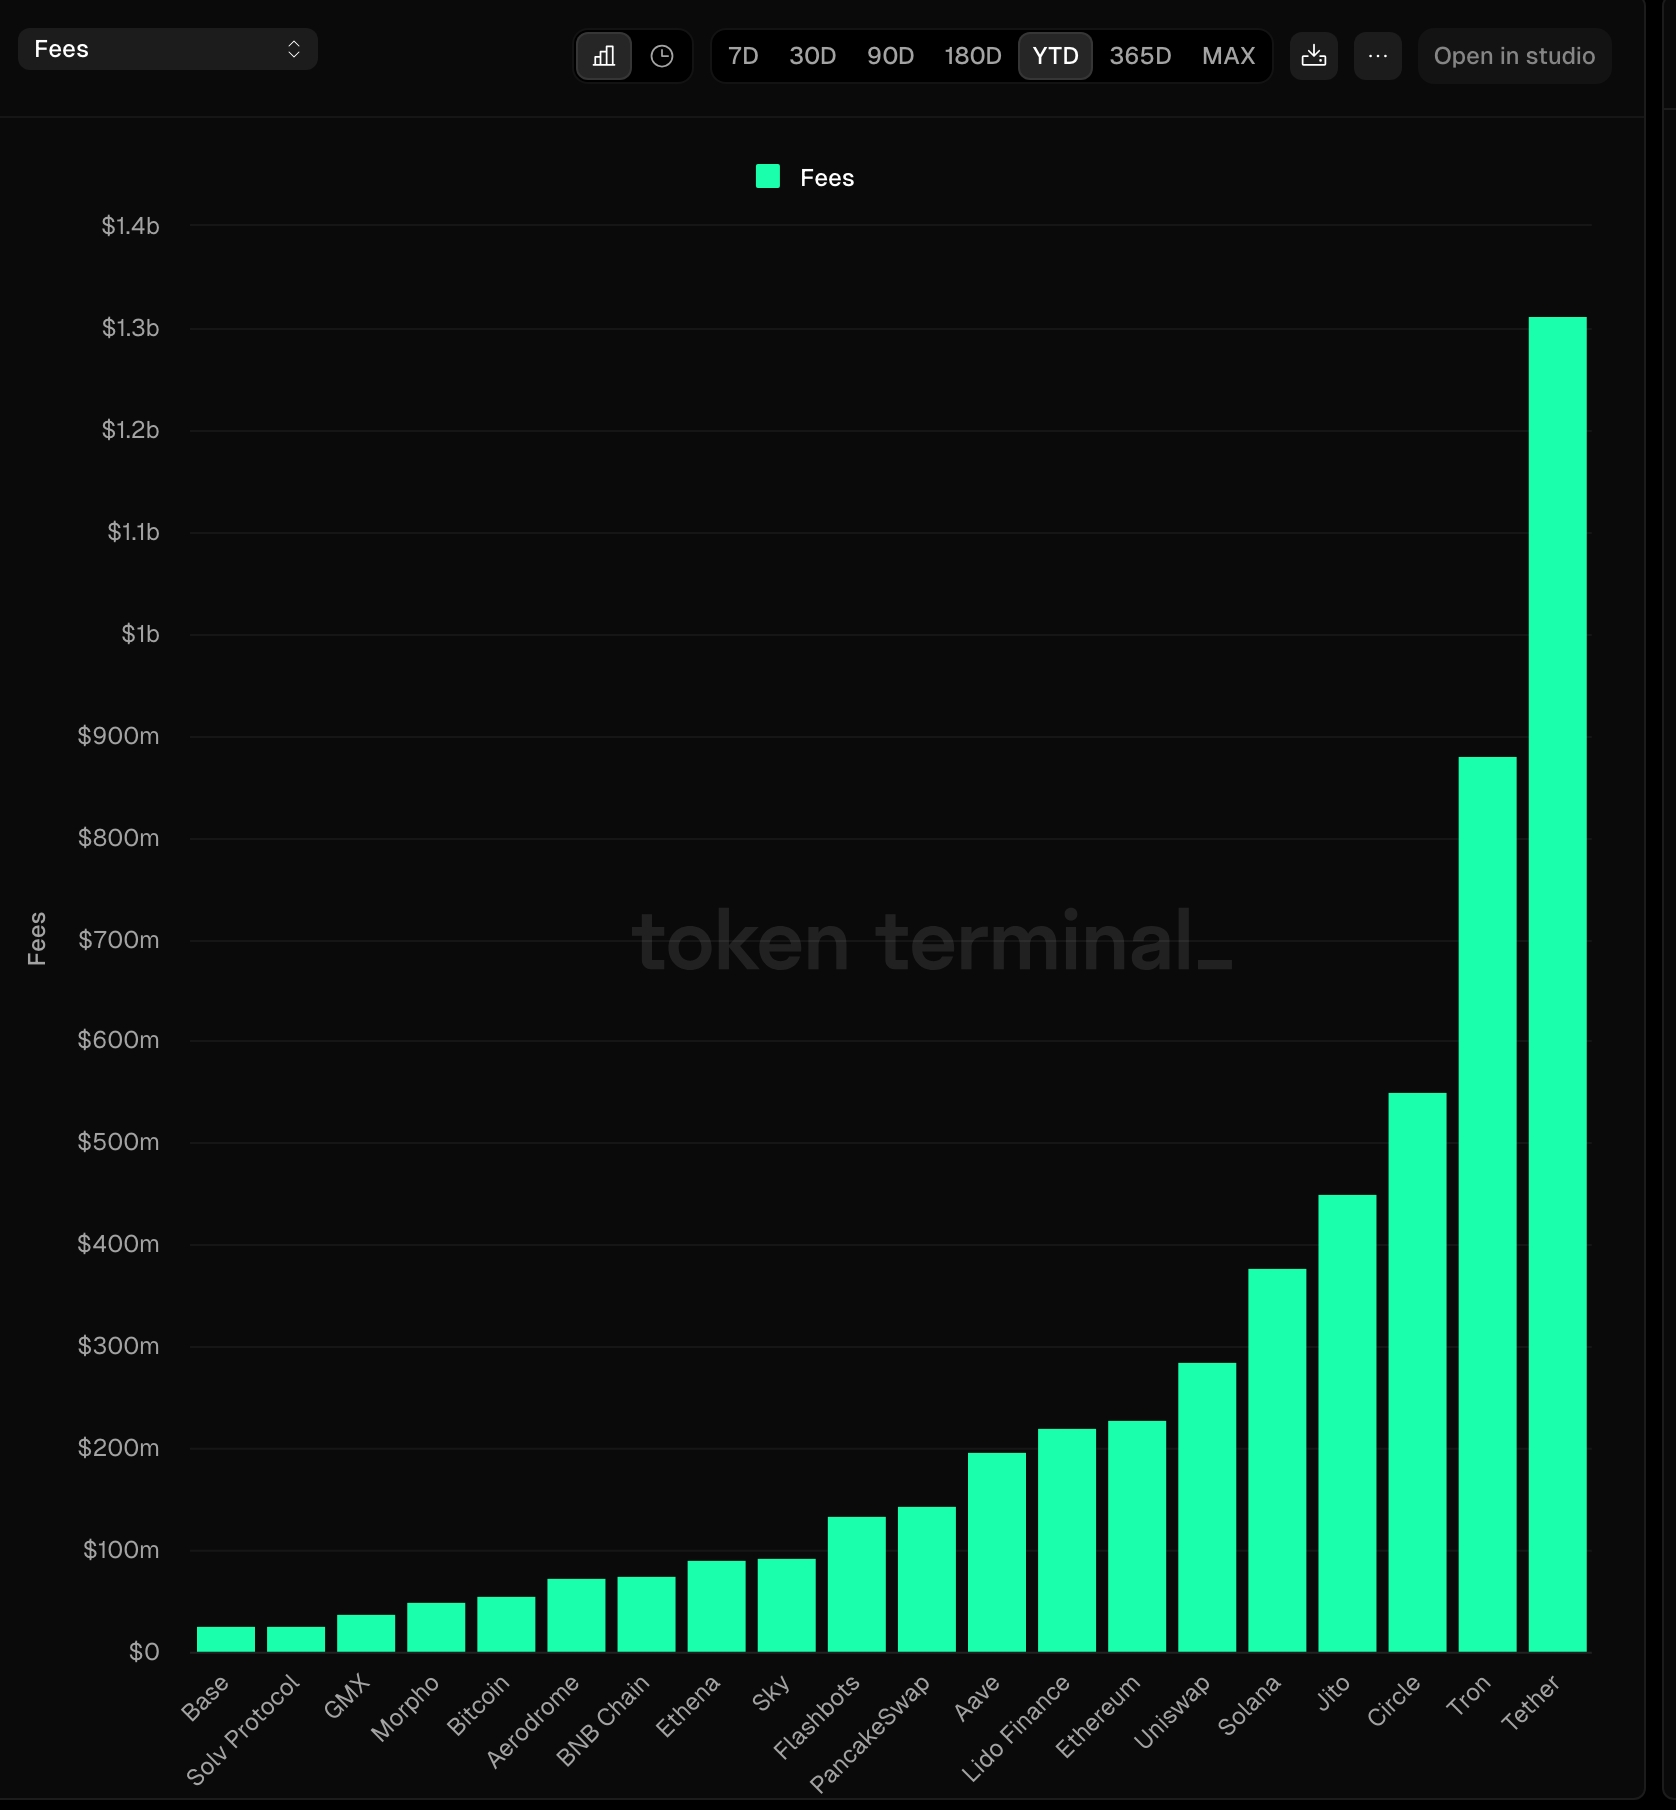
For a long time, Ethereum was the most profitable chains in the crypto industry as it dominated industries like DeFi, gaming, non-fungible tokens, stablecoins, and Real world Asset tokenization. This performance has changed this year, and the network has been overtaken by other popular chains.
The chart below shows that Ethereum has generated $227 million in fees this year. In comparison, Tether has raked in $1.3 billion, Solana $376 million, and Tron $880 million, largely due to their stablecoin-related activity. Platforms like Jito and Uniswap have also surpassed Ethereum in total fees.
Development activity has dropped
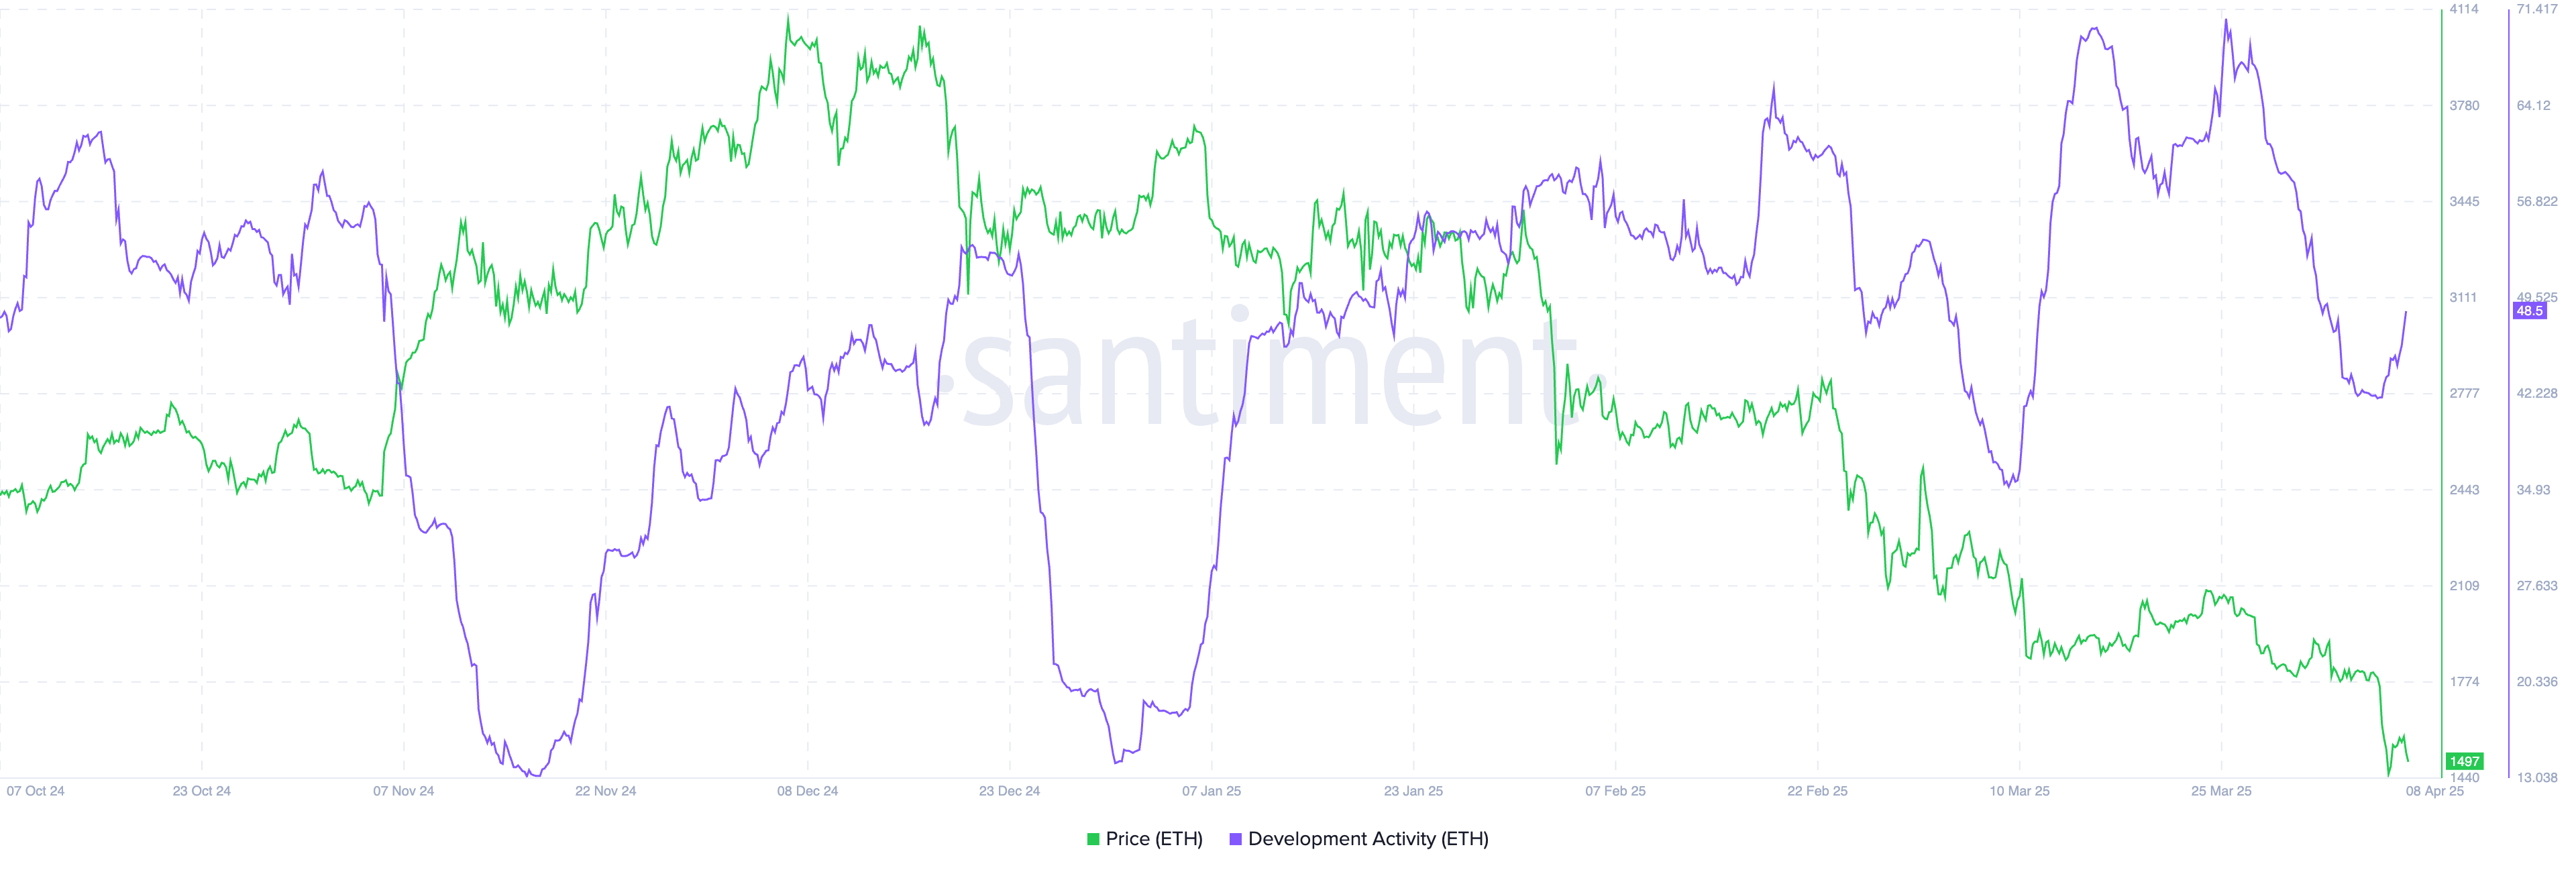
On-chain data also indicates that Ethereum’s developer activity has declined in recent months. This drop is likely due to developers migrating to other fast-growing chains such as Solana, Sonic, and Berachain. Many have also shifted focus to Ethereum’s layer-2 solutions like Base, Arbitrum, and Optimism, which offer faster speeds and lower transaction costs.
Ethereum price formed a triple-top pattern
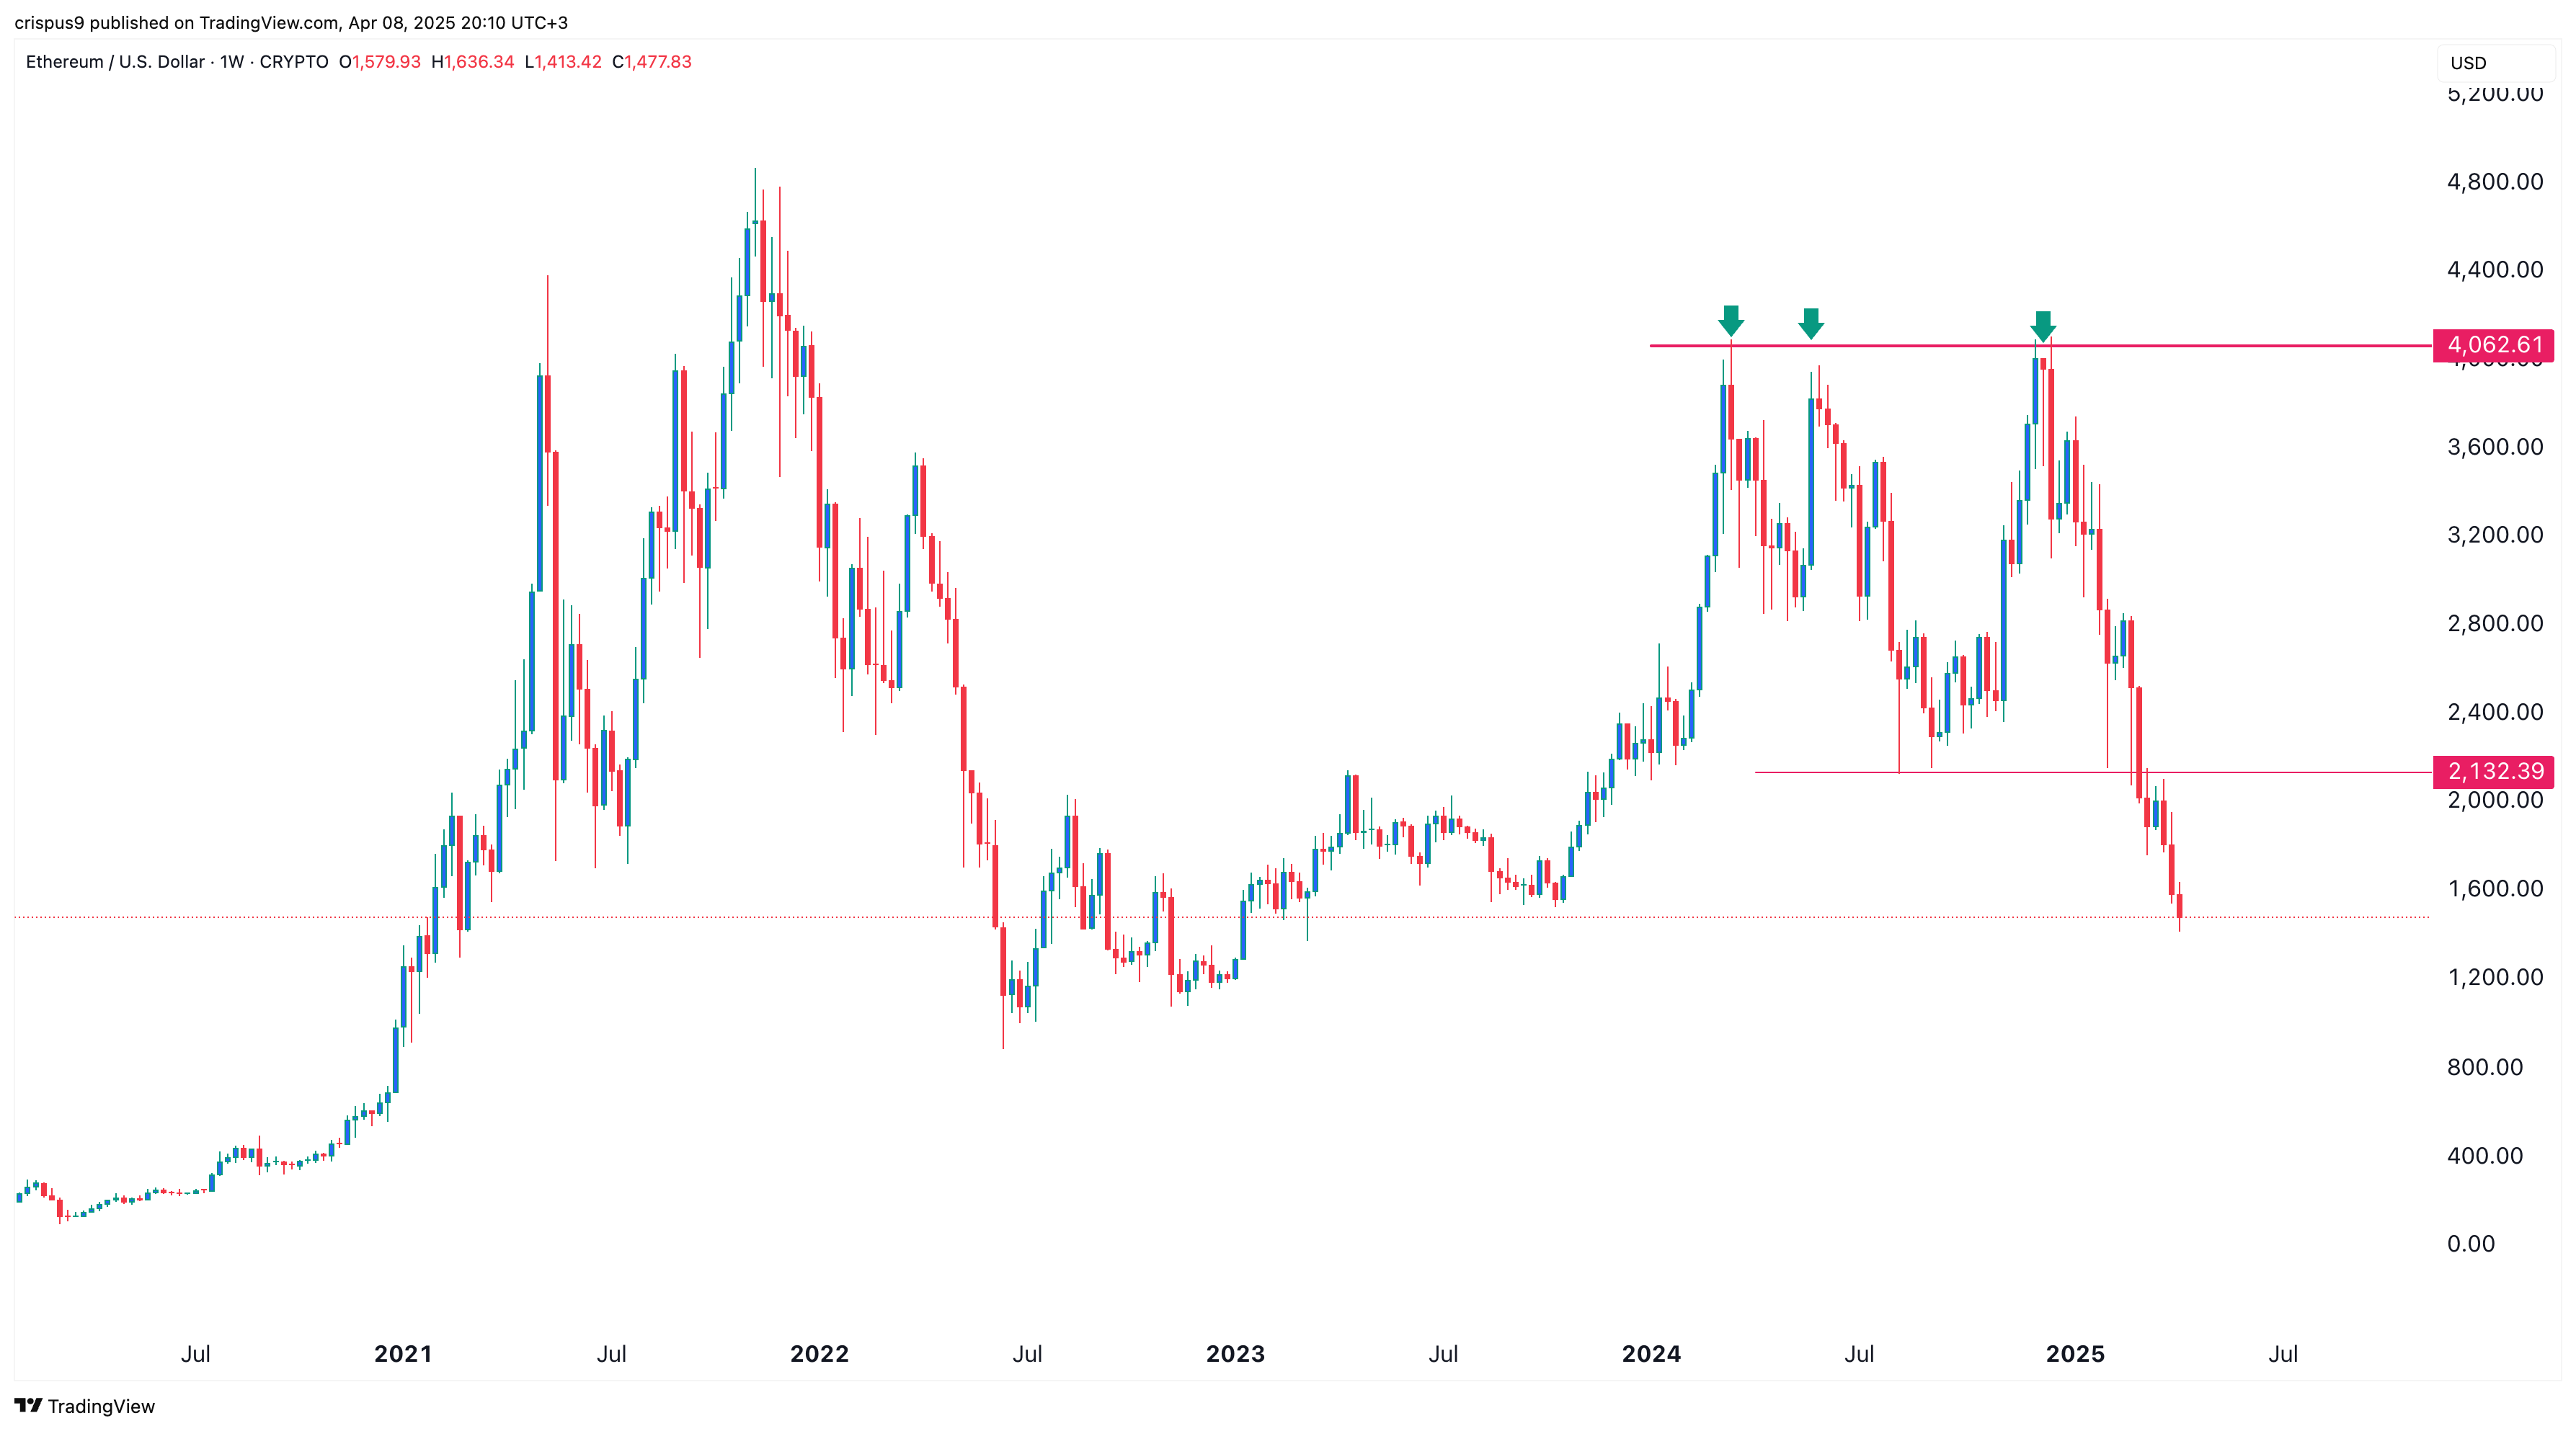
From a technical perspective, Ethereum has fallen sharply after forming a bearish triple-top pattern on the weekly chart. This formation consists of three peaks at around $4,062 and a neckline at $2,132 — a key support level last tested on August 5.
ETH has now broken below this neckline, confirming the bearish signal. It has also fallen beneath both the 50-week and 100-week moving averages. As a result, the next downside target could be $1,000.
Summary
Ethereum has experienced a sharp decline in 2025, turning a $10,000 investment in November into just $3,650. Weak fundamentals and negative technical indicators suggest that further downside may be likely in the coming months.
Source link
Pepe Coin
“Perfect Time to Buy” – Patterns Point to a Pepe Coin Price Resurgence
Published
2 days agoon
April 8, 2025By
admin
Crypto analysts are hailing now as the perfect time to buy Pepe after its price crashed by over 77% from its highest point in December. Most experts cite its strong fundamentals, like the Mean Dollar Invested Age (MDIA), and its strong technicals, including the formation of a double-bottom pattern. This report explains why the Pepe coin price may be ripe for resurgence.
Fundamentals Support the Pepe Coin Price Surge
Pepe coin price could stage a strong rally as some fundamental metrics point to a strong rally this month. One of these metrics is known as the Mean Dollar Invested Age (MDIA), a figure that looks at the average age all coins weighted by their purchase price. The 365-day MDIA metric has surged to the highest point this year, signaling that holders are holding onto their tokens.


Another metric by CoinGlass shows that the futures open interest of the Pepe coin may have bottomed, which is a positive sign. This OI peaked at $335 million on March 28 and then bottomed at $195 million as crypto prices crashed. The trend suggests that the figure is bottoming, which may lead to more gains in the next few days.
These metrics helps to explain why some analysts expect the Pepe coin price to recover in the coming days or weeks. In a note, a pundit known as Rodney said that this was the “perfect time to buy the greatest meme coin of all time.” He also added that the next Pepe price pump would be biblical.
Another pundit with over 40k users used the weekly chart below that signaled that the Pepe price was showing bottoming signs. He added that he was still adding to his Pepe position.


Pepe Price Technical Analysis: Two Key Patterns Converge
Technicals show that the Pepe token may be on the cusp of a major bullish breakout as two patterns converge.
The first crucial pattern is the falling wedge, which formed for the most part of this year. This pattern, which is shown in green below, has two descending and converging trendlines. In most case, this pattern usually leads to a major upside.
The two lines of this wedge converged at the key support at $0.0000060, which was also the lowest level in August last year. As such, it formed a giant double-bottom pattern, another highly bullish sign. Most recently, it has formed another small double-bottom pattern whose neckline is at $0.0000092.


Pepe Token Price Targets
Therefore, the odds are high that the Pepe coin price will stage a strong comeback. The initial target being the neckline of the double bottom at $0.0000092. It will be followed by the 50% retracement point at $0.00001715, up by 173% above the current level.
The bullish Pepe price forecast will be canceled if it loses the double-bottom point at $0.00000595.
Frequently Asked Questions (FAQs)
Crypto analysts are highly bullish on the price of Pepe because of its strong fundamentals and technicals, including the falling wedge and double-bottom patterns.
The top Pepe coin fundamentals are its rising futures open interest and the soaring Mean Dollar Invested Age metric.
Pepe has proven to be one of the best meme coins in the crypto industry. It is a viral coin that has done well over the years.
crispus
Crispus is a seasoned Financial Analyst at CoinGape with over 12 years of experience. He focuses on Bitcoin and other altcoins, covering the intersection of news and analysis. His insights have been featured on renowned platforms such as BanklessTimes, CoinJournal, HypeIndex, SeekingAlpha, Forbes, InvestingCube, Investing.com, and MoneyTransfers.com.
Disclaimer: The presented content may include the personal opinion of the author and is subject to market condition. Do your market research before investing in cryptocurrencies. The author or the publication does not hold any responsibility for your personal financial loss.
Source link

Solana Eyes $200 Target As It Gains Momentum – Recovery Could Mirror 3-Month Downtrend

BTC-denominated insurance firm meanwhile secures $40m in VC funding

‘You Want To Own the Most Hated Thing’ – Arthur Hayes Says Ethereum Set To Outrun Solana As Memecoin Craze Fades

Crypto Braces for a Hidden $4.5 Trillion Catalyst for Bitcoin, Ethereum, Cardano, XRP Price

Block Agrees to $40M NYDFS Penalty Over Lackluster Compliance Program

Top Bitcoin miners produced nearly $800M of BTC in Q1 2025

Tariffs, Trade Tensions May Be Positive for Bitcoin (BTC) Adoption in Medium Term: Grayscale

The U.S. Tariff War With China Is Good For Bitcoin Mining

Dogecoin Bull Div Plays Out, Analyst Maps Next Price Targets

Web3 search engine can reshape the internet’s future

Billionaire Ray Dalio Says He’s ‘Very Concerned’ About Trump Tariffs, Predicts Worldwide Economic Slowdown

Top 4 Altcoins to Sell Before US-China Trade War Extends Beyond 125% Tariffs

OpenAI Countersues Elon Musk, Accuses Billionaire of ‘Bad-Faith Tactics’

81.6% of XRP supply is in profit, but traders in Korea are turning bearish — Here is why

Stablecoins Are ‘WhatsApp Moment’ for Money Transfers, a16z Says

Arthur Hayes, Murad’s Prediction For Meme Coins, AI & DeFi Coins For 2025

Expert Sees Bitcoin Dipping To $50K While Bullish Signs Persist

Aptos Leverages Chainlink To Enhance Scalability and Data Access

Bitcoin Could Rally to $80,000 on the Eve of US Elections

Crypto’s Big Trump Gamble Is Risky

Sonic Now ‘Golden Standard’ of Layer-2s After Scaling Transactions to 16,000+ per Second, Says Andre Cronje

Institutional Investors Go All In on Crypto as 57% Plan to Boost Allocations as Bull Run Heats Up, Sygnum Survey Reveals

Ripple-SEC Case Ends, But These 3 Rivals Could Jump 500x

Has The Bitcoin Price Already Peaked?

A16z-backed Espresso announces mainnet launch of core product

Xmas Altcoin Rally Insights by BNM Agent I

The Future of Bitcoin: Scaling, Institutional Adoption, and Strategic Reserves with Rich Rines

Blockchain groups challenge new broker reporting rule

I’m Grateful for Trump’s Embrace of Bitcoin

Trump’s Coin Is About As Revolutionary As OneCoin
Trending

 24/7 Cryptocurrency News5 months ago
Arthur Hayes, Murad’s Prediction For Meme Coins, AI & DeFi Coins For 2025

 Bitcoin3 months ago
Expert Sees Bitcoin Dipping To $50K While Bullish Signs Persist

 24/7 Cryptocurrency News3 months ago
Aptos Leverages Chainlink To Enhance Scalability and Data Access

 Bitcoin5 months ago
Bitcoin Could Rally to $80,000 on the Eve of US Elections

 Opinion5 months ago
Crypto’s Big Trump Gamble Is Risky

 Altcoins2 months ago
Sonic Now ‘Golden Standard’ of Layer-2s After Scaling Transactions to 16,000+ per Second, Says Andre Cronje

 Bitcoin5 months ago
Institutional Investors Go All In on Crypto as 57% Plan to Boost Allocations as Bull Run Heats Up, Sygnum Survey Reveals

 Price analysis5 months ago
Ripple-SEC Case Ends, But These 3 Rivals Could Jump 500x


✓ Share: