
Analyst
Similarities Between October 2023 And 2024 Suggests The Bitcoin Price May Still Experience ‘Uptober’
Bitcoin has yet to rally in October, with many bullish proponents awaiting the resumption of an uptrend. Among those closely monitoring the price action in anticipation of an uptrend is a well-known analyst on the social media platform X. This analyst, who goes by the name Ash Crypto, recently highlighted a striking similarity between Bitcoin’s current price behavior and a notable pattern observed earlier in 2023. Ash Crypto pointed to Bitcoin’s decline in early October 2023, which ultimately reversed into a multi-month rally to its current all-time high.
Explaining The Similar Price Action
October 2023 was the turning point for the price of Bitcoin and many cryptocurrencies. It was during this month that the crypto industry finally broke out of a lengthy bear cycle, with Bitcoin heralding the charge toward renewed optimism and significant price gains.
Related Reading
For the first time since January, Bitcoin’s market capitalization surged by an impressive 28.52%, sparking a shift in market dynamics that rippled throughout the industry. Although altcoins followed a similar upward trajectory, their gains were modest compared to Bitcoin. However, their collective impact was able to push the entire cryptocurrency market capitalization past the $1.25 trillion mark for the first time since May 2022.
However, while October 2023 was the start of the new bull cycle, what most investors don’t know or have forgotten is that the month started on a negative note. As Ash Crypto pointed out, the price of Bitcoin dropped by 7.5% in the first week of October 2023. According to the BTC/USD price chart, this decline saw the price of Bitcoin fall below $26,500. However, it soon rebounded from this point. By the end of October 2023, Bitcoin had rallied to close the month at over $35,000, representing a remarkable 33% increase from the month’s low.
Fast forward to October 2024, and it appears that Bitcoin is once again repeating its pattern from the previous year. At the start of the month, Bitcoin was trading just below $64,000, a strong position given its recent bullish trends. However, in a movement similar to October 2023, the cryptocurrency experienced another sharp decline, this time dropping by 6.5% within the first three days. Notably, the price briefly touched $60,750 during this period.
Related Reading
What Does This Mean For Bitcoin?
If history were to repeat itself in full, Bitcoin could maybe or maybe not drop a little bit more before rebounding to the upside. According to Ash Crypto’s projection, a similar 33% surge would see Bitcoin shooting above its current all-time high, with a monthly close right in the middle of $75,000 and $76,000.
At the time of writing, Bitcoin has recovered a bit and is now trading at $61,580. Despite this early setback, many bullish investors are keeping a close eye on Bitcoin in anticipation of Uptober coming to fruition.
Featured image created with Dall.E, chart from Tradingview.com
Source link


A crypto analyst has set an ambitious target between $7 and $13 for the XRP price, basing his predictions on the Elliott Wave theory and Fibonacci levels. According to the analyst’s price chart, Wave 2 and 5 could push XRP to these key targets, marking new all-time highs for the cryptocurrency.
XRP Price Roadmap To New ATHs
The XRP price has been on a rather lengthy consolidation trend, halting its previous price momentum after hitting the $2.5 mark. Despite facing bearish trends and a drop to $2.2, a crypto analyst on TradingView, ‘Zerpcrypto,’ has shared a bullish forecast for the popular altcoin.
Related Reading
According to the analyst, XRP could experience a significant price increase between $7.4 to $13.5. The analyst based his bullish projections on XRP’s recent price action and the Elliott Wave theory, a technical analysis tool that identifies predictable patterns in crypto prices and helps forecast market trends.
Zerpcrypto shared a 2-year XRP price chart from 2014 to the present; labeling wave counts from one to five for the larger cycles and sub-waves within these cycles. The analyst’s chart indicates that XRP is currently in the middle of Wave 3, signaling a potential upward move.
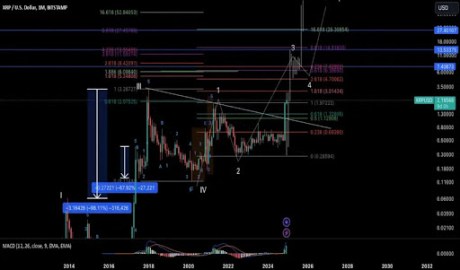
With Wave 2 already complete, Zerpcrypto anticipates that Wave 3 could trigger a strong price rally, potentially propelling XRP to $7.4. After reaching the Wave 3 target, a minor pullback is expected in Wave 4, allowing the market to consolidate before XRP’s final big push upward into Wave 5. In this last wave, XRP could rise to $13.5 and potentially even surge as high as $27.4.
In addition to the Elliott Wave theory, Zerpcrypto‘s predictions are grounded in Fibonacci levels. The projected $7.4 and $13.5 XRP price targets align with the 4.236 and 8.618 Fibonacci extension levels respectively, reinforcing the analyst’s bullish outlook.
Zerpcrypto has also spotlighted a positive Moving Average Convergence Divergence (MACD) for XRP, further strengthening his confidence in the cryptocurrency’s projected $7.4 to $13.5 price target.
Crypto Whales Buy 40 Million XRP
Despite XRP’s price drop to $2.25, a 13% decline over the past week, whales continue accumulating large amounts of tokens, viewing the price dips as a potential buying opportunity. Crypto analyst Ali Martinez revealed in a recent X (former Twitter) post that whales have bought another 40 million XRP in the last 24 hours.
Related Reading
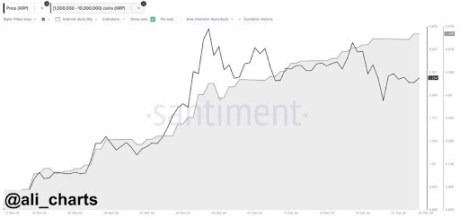
A crypto community member has speculated that this large-scale purchase could signal that whales may be positioning themselves for significant change in XRP. Typically, a surge in whale buying activity often suggests increased confidence in the bullish outlook of a cryptocurrency.
With XRP’s price surging over 4X from its previous low of $0.5 to surpass $2.2 in just two months, analysts are forecasting continued gains as the bull market gains momentum.
Featured image created with Dall.E, chart from Tradingview.com
Source link
The Bitcoin price has dropped below the $100,000 psychological level and is now holding between the $96,000 and $98,000 range. Crypto analyst Ali Martinez provided insights into why Bitcoin could be holding well within this range.
Why The Bitcoin Price Is Holding Steady Between $96,000 And $98,000
In an X post, Ali Martinez noted that one of the most important support levels for the Bitcoin price is between $98,830 and $95,830, where 1.09 wallets bought over 1.16 million BTC. This explains why Bitcoin is holding steady between $96,000 and $98,000 as investors who bought between this level continue to provide huge support for the flagship crypto.
Related Reading
As Martinez suggested, it is important for these holders to continue to hold steady as a wave of sell-offs could send the Bitcoin price tumbling even below $90,000. The flagship crypto dropped below $100,000 following the Federal Reserve Jerome Powell’s recent speech, in which he hinted at a hawkish stance from the US Central Bank.
This sparked a massive wave of sell-offs, as a Hawkish Fed paints a bearish picture for risk assets like Bitcoin. However, despite the Bitcoin price drop below, most Bitcoin holders remain in profit, which is a positive for the flagship crypto. IntoTheBlock data shows that 86% of Bitcoin holders are in the money, 4% are out of the money, and 9% are at the money.
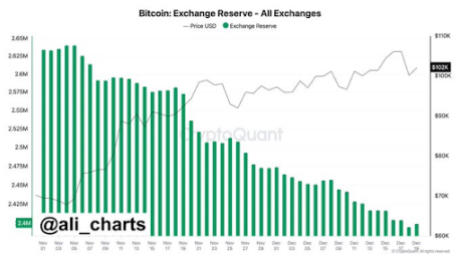
These Bitcoin holders still seem bullish on the leading crypto as they continue to accumulate more BTC. In an X post, Ali Martinez stated that so far in December, 74,052 BTC have been withdrawn from exchanges, and this trend doesn’t seem to be slowing down.
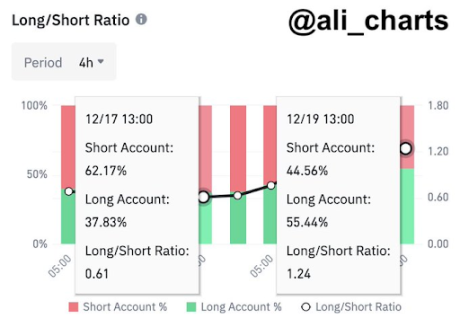
Traders Anticipate A Bullish Reversal
Ali Martinez suggested that crypto traders anticipate a bullish reversal for the Bitcoin price from its current level. This came as he revealed that traders on Binance nailed the top, with 62.17% shorting Bitcoin while it was trading at $108,000. Now, Martinez stated that sentiment has flipped, with 55.44% of these trading now longing dips below $96,000.
Related Reading
Meanwhile, it is crucial for the Bitcoin price to hold this $96,000, as Martinez warned that if BTC loses this support, it could drop below $90,000. The analyst stated that based on the Fibonacci level, if Bitcoin loses $96,000, the next point of focus becomes $90,000 and $85,000. Meanwhile, from a bullish perspective, crypto analyst Justin Bennett suggested that the $110,000 target is still in focus for the Bitcoin price.
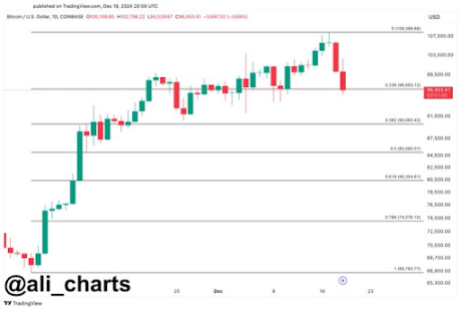
At the time of writing, the Bitcoin price is trading at around $97,000, down over 3% in the last 24 hours, according to data from CoinMarketCap.
Featured image created with Dall.E, chart from Tradingview.com
Source link

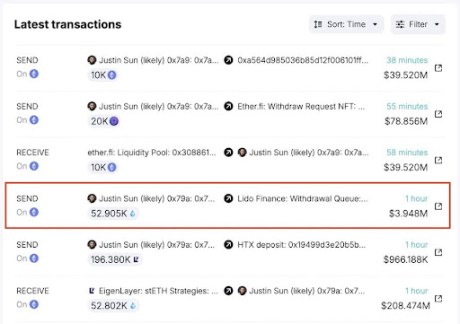
The Ethereum price could face some turbulence, as Justin Sun, the founder of Tron (TRX), has unstaked a whopping $209 million from Lido Finance, a liquid decentralized staking platform for Ethereum. Compared to top cryptocurrencies like Bitcoin (BTC) and Dogecoin (DOGE), the Ethereum price has had a relatively muted performance, skyrocketing to $4,000 before consolidating and struggling to move higher. With the possibility of more sell-offs, Ethereum could see its price crashing down if Sun decides to dump more coins.
Justin Sun Dumps ETH
New reports from Spot On Chain, an AI-driven crypto platform, revealed that Sun recently applied to withdraw a staggering 52,905 ETH tokens worth about $209 million from Lido Finance. According to the on-chain data, this massive withdrawal was part of the ETH stash Sun allegedly accumulated between February and August 2024.
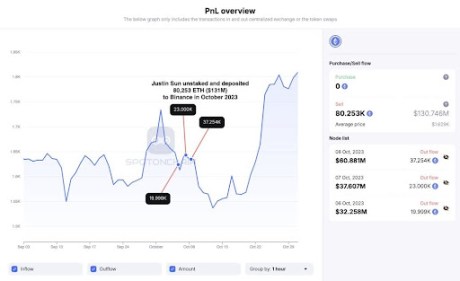
Spot On Chain has revealed that the total amount of Ethereum Sun bought within this period amounted to 392,474 ETH tokens, valued at $1.19 billion. All of these tokens were purchased via three wallet addresses at an average price of $3,027. Presently, the total profit the Tron founder has acquired since his purchase is up to $349 million, representing a 29% increase from its purchasing price.
Interestingly, on October 24, Sun had unstaked a massive 80,251 ETH tokens, worth over $131 million, from Lido Finance. Four days later, he transferred the entire amount to Binance, the world’s largest crypto exchange. This notable move took place just before the price of Ethereum had dropped sharply by 5% in mid-October, which could have resulted in a loss for Sun.
Unsurprisingly, this is not the first time Sun has dumped Ethereum. Spot On Chain revealed earlier this month that the Tron Founder had been cashing in his Ethereum holdings during the market rally.
In November, Sun deposited 19,000 ETH worth $60.83 million to HTX, a crypto exchange. Additionally, he transferred 29,920 ETH valued at $119.7 million to HTX again after its price surpassed $4,000 over the past week. These are just a few transactions the Tron founder has made with ETH over the past month.
Given Sun’s history of large-scale asset movements, further sell-offs could impact the already fragile Ethereum market. Nevertheless, the lingering question remains whether the Tron founder will continue his Ethereum dumping spree.
Ethereum Price Crash Ahead?
While Sun has not publicly commented on his recent large-scale Ethereum withdrawals, the size and timing of these transactions could pose a problem for the altcoin’s future trajectory. Historically, large ETH liquidations have triggered a price crash due to increasing selling pressures.
Related Reading
With the price of Ethereum still unstable and aiming for a stronger upward rally, further large-scale ETH dumps could exacerbate market volatility, especially if other investors or whales follow suit. For now, the price of Ethereum seems to be performing well, recording a more than 7% increase in the last seven days and a 28% surge over the past month, according to CoinMarketCap.
Featured image created with Dall.E, chart from Tradingview.com
Source link

Will XRP Price Break All-Time Highs In 2025?

Why it’s a better investment than Solana or Ripple in 2024

Six Bitcoin (BTC) Mutual Funds to Launch in Israel Next Week: Report

What Happens If Paul Atkins Dismisses the XRP Lawsuit?

Malicious Google ad campaign redirects crypto users to fake Pudgy Penguins website

BlackRock Bitcoin ETF (IBIT) Records Largest-Ever Outflow of $188M

Solana (SOL) Gearing Up: Is a New Surge on the Horizon?

XRP, SOL, NEAR, DOGEN, and DOT poised to explode

Crypto Trader Turned $90 Into $3.25M As Token Skyrockets 5,500%

Here’s a Potential Downside Price Target for Cardano If ADA Sees New Correction, According to Benjamin Cowen

Which crypto will explode in 2025? Expert insights and predictions

XRP Price Pumps 7% On Christmas Eve, Will It Reach Yearly Highs?

XRP firmly above $1, ADA and LCAI to steal the spotlight

The 69 Dumbest Moments of the Year: 2024 Crypto Edition

Here’s What To Expect After Pectra Upgrade
182267361726451435
Why Did Trump Change His Mind on Bitcoin?

Top Crypto News Headlines of The Week

New U.S. president must bring clarity to crypto regulation, analyst says

Will XRP Price Defend $0.5 Support If SEC Decides to Appeal?

Bitcoin Open-Source Development Takes The Stage In Nashville

Ethereum, Solana touch key levels as Bitcoin spikes

Bitcoin 20% Surge In 3 Weeks Teases Record-Breaking Potential

Ethereum Crash A Buying Opportunity? This Whale Thinks So

Shiba Inu Price Slips 4% as 3500% Burn Rate Surge Fails to Halt Correction

Washington financial watchdog warns of scam involving fake crypto ‘professors’

‘Hamster Kombat’ Airdrop Delayed as Pre-Market Trading for Telegram Game Expands

Citigroup Executive Steps Down To Explore Crypto
Mostbet Güvenilir Mi – Casino Bonus 2024

NoOnes Bitcoin Philosophy: Everyone Eats

 3 months ago
182267361726451435

 Donald Trump5 months ago
Why Did Trump Change His Mind on Bitcoin?
 24/7 Cryptocurrency News4 months ago
Top Crypto News Headlines of The Week
 News4 months ago
New U.S. president must bring clarity to crypto regulation, analyst says
 Price analysis5 months ago
Will XRP Price Defend $0.5 Support If SEC Decides to Appeal?
 Opinion5 months ago
Bitcoin Open-Source Development Takes The Stage In Nashville
 Bitcoin5 months ago
Ethereum, Solana touch key levels as Bitcoin spikes
 Bitcoin5 months ago
Bitcoin 20% Surge In 3 Weeks Teases Record-Breaking Potential
