
Altcoin
Solana Jumps 9% As Whales Quietly Accumulate Millions—Details

Whale behavior in the Solana market is causing yet another ruckus, but in a good way. The token’s value climbed 9%, reaching roughly $137. A large numbers of moneyed people, “whales” they are called, is gobbling up huge amounts of the Solana crypto. Technical signals suggest a strong momentum and growing open interest, keeping traders upbeat and glued on their celphone or PC screens.
Whale Invests Millions Of Dollars In SOL
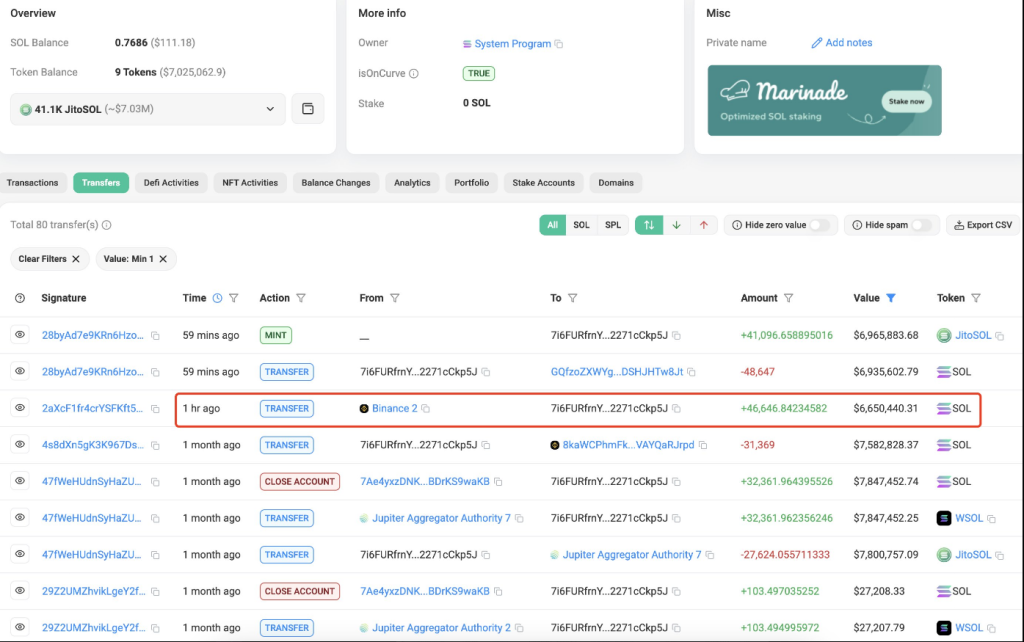
One major investor purchased 50,000 SOL, worth nearly $7 million, data from Lookonchain shows. There were other whales that staked 41,096 SOL, or $6.90 million. By reducing the amount of supply that is currently in use, these buying activity could help stabilize prices.
This type of whale appetite isn’t new for Solana. Historically, significant acquisitions have resulted in price spikes, and traders are anticipating that this trend will continue.
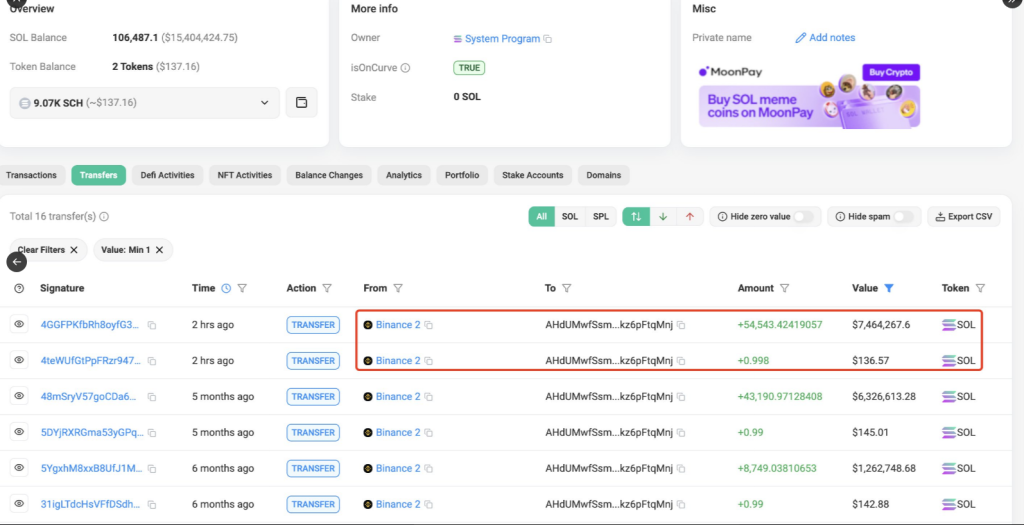
Whales are accumulating $SOL!
AHdUMw…qMnj withdrew 54,544 $SOL($7.46M) from #Binance 2 hours ago.
7i6FUR…kp5J withdrew 41,096 $SOL($6.96M) from #Binance 1 hour ago and staked it.https://t.co/CvCPgVEkARhttps://t.co/KsY2f5UzBahttps://t.co/UEwsxSnVlR pic.twitter.com/pCa0MGEdjU
— Lookonchain (@lookonchain) February 28, 2025
Open interest in Solana futures has increased from $2.2 billion to $2.7 billion, indicating that players with leveraged holdings remain interested. The Relative Strength Index is approaching the overbought zone, as the Moving Average Convergence Divergence flashes a strong signal.
There are technical signs that support the upward trend. After going up to 68, the RSI is now close to the zone where prices are too high. Some traders may think it will go down if it breaks above the 70 mark.
The MACD indicates that the buying momentum remains robust. Traders frequently employ this to determine whether an asset has potential for further growth or if a reversal is imminent.
Historical Whale Accumulations And SOL Price Increases
Whale activity has historically been a significant factor in the price movement of Solana. SOL reached an all-time peak of $262 in November 2024 as a result of a $35 million purchase of the token by whales in a mere two days.
Since late October 2024, a single whale has amassed over 257k SOL, to the tune of almost $54 million. This contributed to Solana’s market capitalization surpassing $100 billion, making it as one of the most prominent altcoins in the market.
The Road Ahead For SOL
Solana’s short-term outlook is favorable, as whales continue to increase their holdings and open interest is increasing. Traders should keep a watchful eye out on indications of a potential correction as the RSI approaches overbought territory.
Currently, the bullish momentum is unabated, and as past trends indicate, whale accumulation could be pointing to more upside movement. Solana’s ability to sustain this trend is contingent upon the duration of the purchasing pressure and the influx of new investors.
Featured image from Asa-Leb, chart from TradingView
Source link


Altcoin
Solana Price Eyes Breakout Toward $143 As Inverse Head & Shoulders Pattern Takes Shape On 4-hour Chart
Reason to trust
![]()
Strict editorial policy that focuses on accuracy, relevance, and impartiality
Created by industry experts and meticulously reviewed
The highest standards in reporting and publishing
Strict editorial policy that focuses on accuracy, relevance, and impartiality
Morbi pretium leo et nisl aliquam mollis. Quisque arcu lorem, ultricies quis pellentesque nec, ullamcorper eu odio.
Solana appears to be gearing up for a major technical breakout, with recent price action building up an interesting chart formation. A familiar bullish pattern has formed, and if validated, it could drive the price to a level not seen in recent weeks. This new development was highlighted by popular analyst Titan of Crypto on social media platform X.
Pattern Breakout Sets $143 In Sight
Like every other large market-cap cryptocurrency, Solana has experienced an extended period of price crashes since late February. In the case of Solana, this price crash has been drawing out since January, when it reached an all-time high of $293 during the euphoria surrounding the Official Trump meme coin. Since then, Solana has corrected massively, even reaching a low of $97 on April 7.
Related Reading
The price action before and after this $97 low has created an interesting formation on the 4-hour candlestick timeframe chart. As crypto analyst Titan of Crypto noted, this formation is enough to send Solana back up to $143.
At the heart of the latest bullish outlook is a clearly defined inverse head and shoulders structure, which is known for its reliability in signaling a reversal from a downtrend to a bullish breakout. The left shoulder of the pattern began forming in early April as Solana attempted to rebound from sub-$110 levels. The subsequent drop to the $96 bottom on April 7 formed the head of the structure. From there, a recovery started as buyers cautiously stepped back in, giving rise to the right shoulder.
The breakout of the neckline resistance has taken place in the past 24 hours. With this in mind, Titan of Crypto predicted that $143 becomes the next logical destination based on the measured move from the head to the neckline.
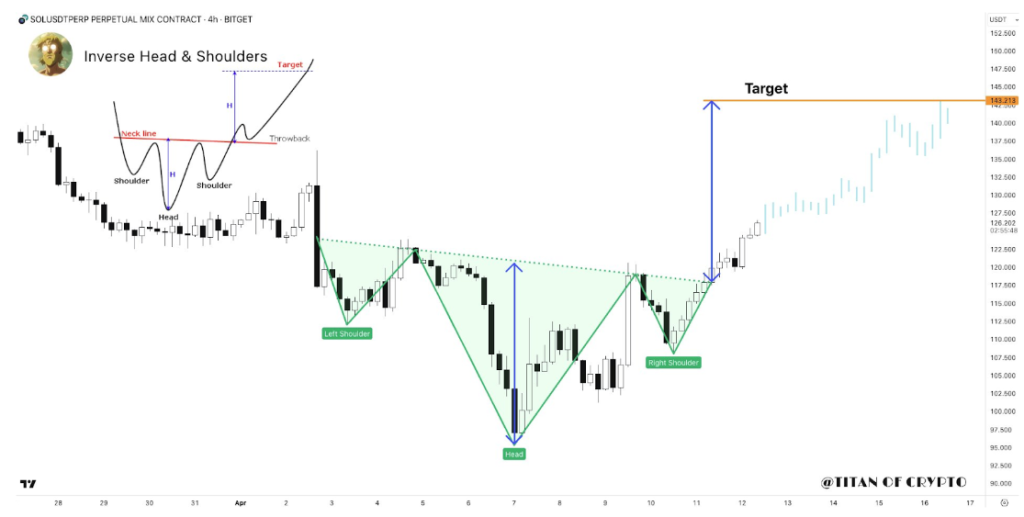
Image From X: Titan of Crypto
Momentum Strengthens With Structure Confirmation
Looking at the chart shared by the analyst, the momentum behind Solana’s price movement appears to be gaining strength. Trading volume is an important metric in evaluating the strength of a breakout, and the volume accompanying the recent breakout above the neckline seemingly confirms it.
Particularly, Solana has seen a 5.3% increase in its price during the past 24 hours, with trading volume surging by 3.76% within this timeframe to $4.21 billion.
Although it is common to see a throwback or minor consolidation just above the neckline, the projected path suggests continued upside as long as price action holds above that key breakout zone.
Related Reading
At the time of writing, Solana is trading at $129, 10% away from reaching this inverse head-and-shoulder target. A move to $143 would not only represent a meaningful recovery from April’s lows but could also improve the confidence in Solana’s price trajectory moving into Q2. The next outlook is what happens after it reaches this target of $143, which will depend on the general market sentiment.
Featured image from The Information, chart from TradingView
Source link
Reason to trust
![]()
Strict editorial policy that focuses on accuracy, relevance, and impartiality
Created by industry experts and meticulously reviewed
The highest standards in reporting and publishing
Strict editorial policy that focuses on accuracy, relevance, and impartiality
Morbi pretium leo et nisl aliquam mollis. Quisque arcu lorem, ultricies quis pellentesque nec, ullamcorper eu odio.
Crypto analyst El Crypto has raised the possibility of an altcoin season happening soon. The analyst alluded to Bitcoin’s dominance rising to a major rejection zone, which could be bullish for altcoins.
Altcoin Season May Be Imminent As Dominance Hits Major Rejection Zone
In an X post, El Crypto suggested that the altcoin season may be imminent as Bitcoin’s dominance hits a major resistance zone. He revealed that BTC’s dominance again touched a zone that has led to rejection every time in the last one and a half years. He added that the Stochastic Relative Strength Index (RSI) is also in the overbought area, while a bearish cross has now happened again.
Related Reading
Based on this, the analyst remarked that the market looks to be in for some fun, hinting at an altcoin season. Crypto analyst CryptoElites also affirmed that Bitcoin’s dominance has reached its peak. He further affirmed that next up is a massive altcoin rally, which will usher in the alt season.
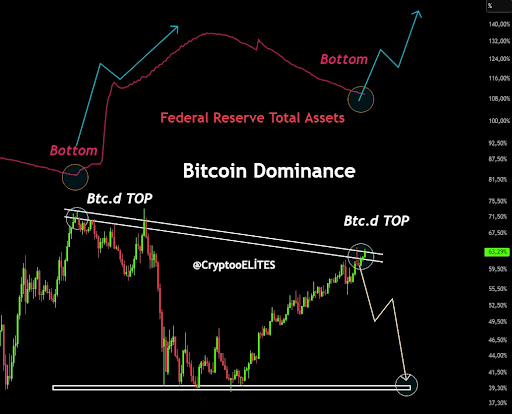
In another X post, the crypto analyst alluded to the USDT and USDC dominance ratio. He claimed that the market was at a critical trend reaction point right now. CryptoElites then mentioned that if the stablecoins’ dominance breaks down, then the altcoin season will officially begin.
Crypto analyst Kevin Capital also looked to provide a bullish outlook towards the altcoin season. In an X post, he highlighted the global liquidity index overlaid with the Dogecoin price. In line with this, he remarked that it might be time for market participants to start paying attention to this.
So far, altcoins have been mirroring Bitcoin’s price action, suffering a similar downtrend amid the trade war. However, if the altcoin season were to kick into full gear, these altcoins could easily decouple from the flagship crypto and outperform. Ethereum is known to lead this altcoin season, but that may not be the case this time, as ETH has underperformed throughout this cycle.
Still Bitcoin Season For Now
Blockchain Center data shows that it is still Bitcoin season for now, as the flagship crypto continues to outperform most altcoins. In the past 90 days, only seven out of the top 50 coins have outperformed the flagship crypto. These coins include Mantra, GateToken, Monero, LEO, Tron, and FastToken.
Related Reading
For it to be altcoin season, 75% of the top 50 coins would need to outperform Bitcoin over the last 90 days. Although almost all coins have witnessed declines within this timeframe, BTC has suffered a 22% drop, which is less than what these altcoins have seen during this period.
At the time of writing, the Bitcoin price is trading at around $80,900, down over 1% in the last 24 hours, according to data from CoinMarketCap.
Featured image from iStock, chart from Tradingview.com
Source link

Sonic token has caught the eye of traders after a powerful bullish move from support. With price now consolidating under key resistance, the next breakout could be just around the corner—here’s what the chart is telling us.
Sonic (S) token has shown some serious momentum lately, catching the attention of traders with a powerful bullish engulfing candle. With price now grinding against key technical levels, the next few moves could be crucial in determining whether we see continuation—or signs of a reversal.
Key points:
- Strong bullish engulfing candle from the value area low and daily support at $0.39
- Price consolidating just under point of control, hinting at vertical accumulation
- $0.52 liquidity target aligns with 0.618 Fibonacci and VWAP resistance

The recent price action on Sonic Token has been notably impulsive, starting with a strong bullish engulfing candle that formed right at the value area low. This region also aligned perfectly with daily support around $0.39, giving the move significant technical weight.
The surge was accompanied by a rising volume profile, confirming buyer interest and demand at that level. Following the push, price now finds itself consolidating near the point of control—typically a sign that the market is building a base, not reversing.
Potential vertical accumulation
If Sonic continues to trade above the point of control, this could signal the presence of vertical accumulation. This kind of price action, characterized by higher lows on the lower time frame within a compact trading range, often leads to further bullish continuation.
One critical area to watch is the resting liquidity around $0.52. This level stands out as an untapped high and a magnet for price, especially with the 0.618 Fibonacci level and VWAP resistance stacked just above it.
Reaching that $0.52 region makes both technical and psychological sense. The theory of liquidity suggests that markets seek out areas of uncollected orders. Once price had taken the lower-side liquidity and bounced hard, the next logical move is to target the highs.
That target also lines up with the value area high of the current range, meaning a tap of that level would complete a full range rotation from low to high. If Sonic starts distributing around that resistance area, that could mark the start of a longer consolidation phase.
Right now, the chart is still showing signs of strength. There are no clear signals of weakness, and vertical accumulation patterns tend to continue until exhaustion. While it’s smart to be cautious near resistance, prematurely shorting Sonic without a clear rejection could be risky. For now, the bulls are in control—and the $0.52 target remains in play until proven otherwise.
Source link

This Week in Crypto Games: Gaming Tokens Crash Out, Eve Frontier Opens Up

Commerce Secretary Lutnick walks back tariff relief on electronics

Gold ETF Inflows Hit Three-Year High as PAXG, XAUT Outperform Wider Crypto Market

Israel’s New Study Shows 51% Of Public Is Interested In Adopting CBDC (Digital Shekel) – Is That So?

Solana Price Eyes Breakout Toward $143 As Inverse Head & Shoulders Pattern Takes Shape On 4-hour Chart

Crypto malware silently steals ETH, XRP, SOL from wallets

Binance Executives Met With US Government Officials To Discuss Easing of Regulatory Supervision: Report

Michael Saylor Hints At Another MicroStrategy Bitcoin Purchase, BTC Price To Rally?

From the Crypto Trenches to the Hill: Why Solana Is Making a Big Push in Washington

Bitcoin price tags $86K as Trump tariff relief boosts breakout odds

Where Top VCs Think Crypto x AI Is Headed Next

India’s Leading Bitcoin And Crypto Exchange Unocoin Integrates Lightning

Solana Triggers Long Thesis After Pushing Above $125 – Start Of A Bigger Rally?

Popcat price surges as exchange reserves fall, profit leaders hold

Crypto Analyst Says Bitcoin Back in Business, Calls for BTC Uptrend if One Support Level Holds


 24/7 Cryptocurrency News5 months ago
Arthur Hayes, Murad’s Prediction For Meme Coins, AI & DeFi Coins For 2025

 Bitcoin3 months ago
Expert Sees Bitcoin Dipping To $50K While Bullish Signs Persist

 24/7 Cryptocurrency News3 months ago
Aptos Leverages Chainlink To Enhance Scalability and Data Access

 Bitcoin5 months ago
Bitcoin Could Rally to $80,000 on the Eve of US Elections

 Opinion5 months ago
Crypto’s Big Trump Gamble Is Risky

 Altcoins2 months ago
Sonic Now ‘Golden Standard’ of Layer-2s After Scaling Transactions to 16,000+ per Second, Says Andre Cronje

 Bitcoin5 months ago
Institutional Investors Go All In on Crypto as 57% Plan to Boost Allocations as Bull Run Heats Up, Sygnum Survey Reveals

 Price analysis5 months ago
Ripple-SEC Case Ends, But These 3 Rivals Could Jump 500x
