
Price analysis
Sui Price Surges 10% Is ATH in Sight as Bulls Dominate Market?

Sui (SUI) price, a prominent layer-1 blockchain, is experiencing a significant uptrend. The SUI tokens have recently risen sharply, showcasing a strong bullish momentum. Starting from a pivotal support level of around $1 in mid-September, the asset has reached crucial resistance levels. This remarkable price performance has boosted Sui’s market presence and made it a hot topic among traders and investors.
Sui Price Surge Signals Potential Market Gains
Sui price movements are capturing significant attention from traders and investors alike, with many anticipating further advances in the coming months. This optimistic outlook is fueled by a robust 15% increase over the past week, alongside an impressive 125% jump in the last month.
These gains are propelling Sui toward its all-time high. Enthusiasm for Sui is rising with the broader crypto market. Bitcoin’s stabilization at the $65,000 mark also bolstered other digital currencies, suggesting potential for more substantial gains across the sector. This positive sentiment is indicative of a bullish trend for Sui.
Sui Price Eyes 17% Rise: Is Rally Sustainable?
Sui price experienced a significant rally today, rising 11.40% to close at $1.83. This increase follows a period of fluctuation where the price dropped as low as $1.62. The currency saw its peak at $1.84, slightly below its all-time high of $2.18 reached six months ago.
Since last year, Sui has grown remarkably, climbing over 400% from its record low of $0.3643. This recent upward trend highlights the volatile nature of cryptocurrency markets and investor interest in Sui.
The layer 1 blockchain is encountering notable resistance at the $2 level. With a favorable shift in market dynamics, this asset could ascend to $2.1. Achieving $2.18 would align it with its historical peak, nearly a 17% rise from its current stance.
The daily technical indicators for the Sui price show a robust upward trend. The Relative Strength Index (RSI) underscores this growth, with a current value of 79, indicating that Sui is potentially overbought. The Moving Average Convergence Divergence (MACD) reinforces the bullish narrative, showing a solid divergence above the signal line.

According to Coinglass data, the SUI Futures market has experienced a significant surge in open interest, reflecting heightened trading activity and interest in the asset. The data highlights a rapid increase in SUI’s price and open interest from early August to late September. This uptick in trading volume suggests growing investor confidence and increased speculation in the futures market.

The bullish price trend of Sui is supported by strong technical indicators and increased trading activity. This positive momentum could lead it to reach its all-time high soon. The overall market sentiment is optimistic, suggesting further growth in Sui’s value.
Frequently Asked Questions (FAQs)
Yes, Sui is approaching its all-time high of $2.18, with only a 17% rise needed to match that level.
Sui’s rise is supported by broader cryptocurrency market stability, particularly Bitcoin’s price consolidation, which boosts confidence across the sector.
A 20% rise in open interest suggests growing confidence among traders and increased speculation in the SUI Futures market.
Coingape Staff
CoinGape comprises an experienced team of native content writers and editors working round the clock to cover news globally and present news as a fact rather than an opinion. CoinGape writers and reporters contributed to this article.
Disclaimer: The presented content may include the personal opinion of the author and is subject to market condition. Do your market research before investing in cryptocurrencies. The author or the publication does not hold any responsibility for your personal financial loss.
Source link


The XRP price has staged a strong recovery this month, making it one of the best-performing top ten cryptocurrencies.
Ripple (XRP) peaked at $1.6305 last week, rising 324% from its lowest point this year and pushing its market cap to over $81 billion. This valuation surpasses major global firms like Deutsche Bank, Marriott International, and BP.
With XRP’s bullish trajectory, analysts have shared optimistic forecasts. Edo Farina, a long-term Ripple supporter, predicted in an X post that the coin could surge to $10 during this bull run.
He cited fundamental catalysts, including expectations that Donald Trump’s victory could resolve Ripple’s ongoing conflict with the Securities and Exchange Commission will be over next year.
Meanwhile, Ripple and Archax have partnered to launch a tokenized fund on the XRP Ledger, signaling renewed activity on the network
Additionally, Ripple is developing RLUSD, a stablecoin intended to compete with Tether (USDT) PayPal USD, and USD Coin (USDC).
There are also rumors of Ripple launching an Initial Public Offering (IPO) in the coming years. A January CNBC report suggested the company postponed its IPO plans due to SEC challenges, a situation that could shift next year.
Can the XRP price jump to $10?

The price of Ripple traded at $1.4381 on Nov. 25, requiring a 600% increase to reach $10. Such a move would exceed its recent performance but aligns with past trends, like its 1,800% jump from 2020 lows to its all-time high in 2021.
The weekly chart shows that Ripple broke the significant resistance level of $0.9350, the neckline of a slanted triple-bottom pattern. The coin has moved above the 50-week and 200-week Exponential Moving Averages, suggesting positive momentum. There are also indications of a bullish pennant pattern forming.
While XRP may continue climbing, potentially reaching its all-time high of $1.96 and further to $5, a leap to $10 in 2024 remains unlikely.
Source link

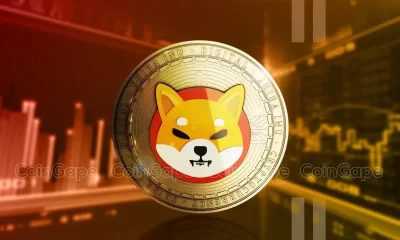
Shiba Inu price has underperformed other popular meme coins in the past few days. SHIB trades at $0.000026 on Monday, where it has been stuck since November 10, as investors anticipate more upside as the burn rate rebounds.
Shiba Inu Price Likely to Rally 76% As 6.8m SHIB Burnt
One potential catalyst for the SHIB price is that the number of coins in circulation continues to drop, helped by the robust token burn. Data by Shiburn shows that the amount of these burns rose by 40% in the past 24 hours to 4.85 million.
Therefore, the number of Shiba Inu tokens has continued to drop from the original 999 trillion to 410 trillion, a figure that will continue falling in the future. The token burn is when SHIB coins are moved to an inaccessible wallet either voluntarily or from ecosystem fees to be removed from the circulating supply forever.
These token burns help to create value for existing tokens by reducing the number of coins in circulation. It is often compared to when a company executes a share buyback, which in turn increases the earnings per share.
Some of the top players in this ecosystem are ShibaSwap and Shibarium. ShibaSwap is a decentralized DEX network where people swap tokens, while Shibarium is a layer-2 network that has completed over 500 million transactions. Data on its website shows that ShibaSwap’s volume has jumped to $75 million this month, the highest level since March.

SHIB Price Analysis: Shiba Inu Bulls Prepares For Uptrend
In an X post, Shib Knight, a popular crypto analyst predicted that the SHIB was preparing for its next leg and that it looked “sendy”.
The most bullish case for the Shiba Inu price rally is a cup-and-handle pattern on the daily chart. This techncial formation contains a rounded bottom that looks like a cup, which is often followed by a minor retracement that forms the handle. Hence, the namesake.
The target of $0.000045 for this setup is obtained by measuring the depth of the cup and adding it to the neckline, connecting the cup and handle’s swing highs.
The upper side of this pattern is at $0.000030, where it has struggled to move above since May. According to this pattern, the ongoing consolidation is part of the formation of a handle section. In most periods, this pattern is one of the most bullish patterns in the market.
Additionally, Shiba Inu price has formed a golden cross pattern as the 50-day and 200-day Exponential Moving Averages (EMA) have formed a bullish crossover. Therefore, the confirmation for the next leg up will come if the SHIB rises above the upper side of the cup at $0.000030. If this happens, SHIB could jump to $0.000045, its highest level this year, which is about 76% above the current level.

On the flip side, this Shiba Inu price prediction will become invalid if the coin drops below the key psychological point at $0.000023. A drop below that level will point to more downside, potentially to $0.0000158, its lowest point on October 25.
Frequently Asked Questions (FAQs)
It has strong technicals after forming a golden cross pattern and a cup and handle. A cross above the cup will point to more gains, potentially to the year-to-date high of $0.000045.
Odds are that the SHIB price will stage a strong rally soon. However, a drop below the support at $0.000022 will invalidate the bullish view and raise the odds of it falling to $0.00001.
Shiba Inu’s burn rate is continuing, while analysts expect the ongoing crypto bull run will continue in the near term.
crispus
Disclaimer: The presented content may include the personal opinion of the author and is subject to market condition. Do your market research before investing in cryptocurrencies. The author or the publication does not hold any responsibility for your personal financial loss.
Source link

Pi Network has erased some of the gains made last week as the recent rally in the crypto industry took a breather. Still, there are chances that the Pi coin will resume its rebound, and potentially hit $100 ahead of the mainnet launch.
Pi Network Price Prepares For the Mainnet Launch
The Pi Network IoU price will be on the spotlight after the recent successful PiFest event and the upcoming ending of the KYC verification of pioneers.
In a recent statement, Pi’s developers said that over 27,000 sellers registered in the Map of Pi during the recent PiFest event. Map of Pi is a dApp in its ecosystem that enables sellers accepting the Pi coin to register themselves.

These numbers mean that the coin is getting popular among sellers, a move that could make it a better cryptocurrency compared to Bitcoin in terms of shopping. It also means that the developers have achieved one of the three conditions that needs to happen ahead of the mainnet launch. This condition calls for the network to have an ecosystem that will give the Pi coin utility.
The other condition is that the developer needs to complete the KYC verification of all miners, a process that has accelerated in the past few months. The grace period of this process will complete on November 30.
Additionally, with cryptocurrencies being in a strong bull run, the third condition of a friendly environment has been met. Therefore, there is a likelihood that the Pi mainnet launch will happen as soon as in December.
Pi Coin Analysis: Will It Hit $100?
The Pi Coin IoU, which is not associated with the Pi project, jumped to $100 in October as anticipation of the mainnet launch. It then suffered a harsh reversal and bottomed at $44.95 on November 12. This decline was notable because its lower side was slightly above the 100-day moving average, which explains why the coin has bounced back.
Pi Network’s rebound also happened a few weeks after it formed a golden cross as the 200-day and 50-day moving averages crossed each other.

The current retreat happened after the coin rose to the extreme overshoot of the Murrey Math Lines. Therefore, with the rising expectation of an upcoming mainnet launch, there are chances that the Pi coin price will bounce back, and potentially retest the important resistance at $100. A break above that level will raise the odds of the coin rising to the year-to-date high of $122.05.
On the flip side, a drop below the top of the trading range at $56.25 will invalidate the bullish view, and raise the odds of it falling to $45, its lowest level this month.
Frequently Asked Questions (FAQs)
There are chances that the coin will bounce back ahead of the mainnet launch, which is expected to happen in December this year. If this happens, the coin may retest the key resistance at $100, its highest point last month.
No. Pi coin is not associated with the real project and is not an indicator of what will happen when the mainnet launch happens.
It is unlikely that the Pi Coin will do well after the mainnet launch as evidenced by the recent crashes of Hamster Kombat and Notcoin.
crispus
Disclaimer: The presented content may include the personal opinion of the author and is subject to market condition. Do your market research before investing in cryptocurrencies. The author or the publication does not hold any responsibility for your personal financial loss.
Source link

Robinhood Lists Dogwifhat, WIF Price To $5?

MicroStrategy Adds 55,500 More BTC To Its Portfolio For $5.4 Billion

Newmarket Capital Launches Battery Finance, Bitcoin-Collateralized Loan Strategy

Can the XRP price realistically jump to $10 in 2024?

Shiba Inu Price Eyes 76% Rally As 6.8m SHIB Tokens Burned

VanEck Doubles Down on Big Bitcoin Price Target, Says Key Indicators Continue To ‘Signal Green’

Multichain AI token poised to dethrone SOL, TON: 5,000% gains expected

Will Pi Network Price Reach $100 in This Bull Market?

Axie Infinity developer cuts 21% workforce: report

Chill Guy Meme Coin Pumps Another 50% as Creator Fights Back

Super Pepe Coin Whale Sells 130B PEPE, Shifts Focus To EIGEN

AI predicts one altcoin set to outperform XRP and Solana in 2025

BTC and Major Altcoins Pullback, SAND Soars 60%

Трамп обирає менеджера прокрипто-хедж-фонду Скотта Бессента на посаду міністра фінансів

Trump calls up crypto pals, Senator says sell gold for Bitcoin | Weekly Recap
182267361726451435
Why Did Trump Change His Mind on Bitcoin?

Top Crypto News Headlines of The Week

New U.S. president must bring clarity to crypto regulation, analyst says

Ethereum, Solana touch key levels as Bitcoin spikes

Bitcoin Open-Source Development Takes The Stage In Nashville

Will XRP Price Defend $0.5 Support If SEC Decides to Appeal?

Bitcoin 20% Surge In 3 Weeks Teases Record-Breaking Potential

Ethereum Crash A Buying Opportunity? This Whale Thinks So

Shiba Inu Price Slips 4% as 3500% Burn Rate Surge Fails to Halt Correction

‘Hamster Kombat’ Airdrop Delayed as Pre-Market Trading for Telegram Game Expands

Washington financial watchdog warns of scam involving fake crypto ‘professors’

Citigroup Executive Steps Down To Explore Crypto
Mostbet Güvenilir Mi – Casino Bonus 2024

Bitcoin flashes indicator that often precedes higher prices: CryptoQuant

 2 months ago
182267361726451435

 Donald Trump4 months ago
Why Did Trump Change His Mind on Bitcoin?
 24/7 Cryptocurrency News3 months ago
Top Crypto News Headlines of The Week
 News3 months ago
New U.S. president must bring clarity to crypto regulation, analyst says
 Bitcoin4 months ago
Ethereum, Solana touch key levels as Bitcoin spikes
 Opinion4 months ago
Bitcoin Open-Source Development Takes The Stage In Nashville
 Price analysis4 months ago
Will XRP Price Defend $0.5 Support If SEC Decides to Appeal?
 Bitcoin4 months ago
Bitcoin 20% Surge In 3 Weeks Teases Record-Breaking Potential

✓ Share: