24/7 Cryptocurrency News
THETA Price Jumps 29%, Rally To Continue?
Published
4 months agoon
By
admin
Theta Network (THETA) price soared to a 12-month high of $3.08 in the last 24 hours after establishing support at an intraday low of $2.28. This rally drove THETA’s market capitalization up by 25% to $3.10 billion, while its 24-hour trading volume spiked by 351% to $548.37 million.
The strong upward momentum has sparked interest among traders and analysts, with many speculating on whether the rally will continue.
THETA Price Jumps Over $29
The THETA price has demonstrated a remarkable upward trend throughout the day, surging nearly 29% within 24 hours. The rally began after the price broke above its consolidation zone near $2.40 during the early afternoon, signalling increased buying interest.
By the end of the day, THETA had reached a daily high of $3.08, reflecting heightened bullish sentiment in the market. On the weekly basis, THETA price has exhibited steady growth, climbing from $2.10 to over $3.00, representing a 59% rise in seven days. The consistent upward movement was accompanied by a series of higher highs and higher lows, which analysts interpret as a strong indicator of continued bullish momentum.


The price has now broken past multiple resistance levels, indicating that traders are optimistic about the asset’s short-term prospects. According to on-chain data, the breakout occurred as derivatives trading volume surged by over 420% to $983.06M, reflecting renewed interest from market participants.
Additionally, open interest in THETA derivatives rose by 75.35% to $108.91 million, indicating that more traders are taking positions in the asset. This spike in activity coincided with THETA’s price moving past critical resistance levels at $2.40 and $2.50, confirming the start of a strong uptrend.
Analysts Predict Further 348% Upside
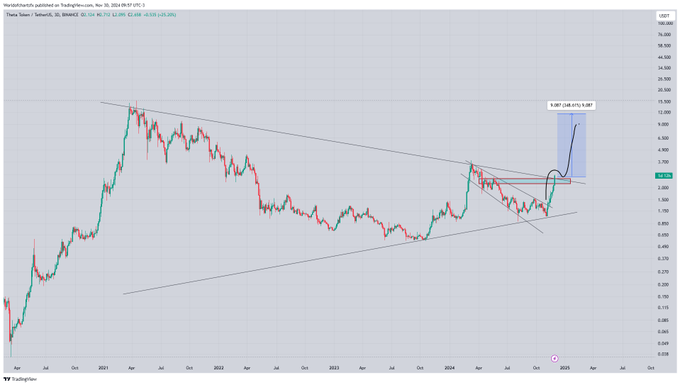
Concurrently, technical analysts are optimistic about the potential for further gains in THETA’s price. The chart provided by “World of Charts” indicates that the breakout from the descending triangle could lead to a rally targeting $9.00, a projected 348% surge from current levels. The measured move from the triangle’s base supports this bullish outlook.
Javon Marks, a market analyst, pointed out that THETA’s ability to break its long-term trendline suggests a reversal of bearish momentum. Marks noted, “The steep upward trajectory and higher highs confirm that the bulls are in control, and the rally could extend to $8.00 in the near term.”
He also highlighted that the price has yet to encounter significant resistance, which could enable continued growth in the short term.
THETA Price Technical Analysis
THETA’s technical indicators further support the bullish outlook. The MACD (Moving Average Convergence Divergence) is significantly above its signal line, confirming strong upward momentum. The widening gap between the MACD and the signal line suggests that the uptrend remains intact.
Additionally, the Money Flow Index (MFI) is at 93.69, which places THETA in the overbought zone. While this indicates strong buying pressure, analysts caution that a minor pullback or consolidation could occur before the next leg up.


Concurrently, the 50-day moving average is also approaching a bullish crossover with the 200-day moving average, signalling the potential for a “golden cross.” This technical pattern is often a precursor to sustained price increases hence backing the potential THETA price breakout.
Kelvin Munene Murithi
Kelvin is a distinguished writer with expertise in crypto and finance, holding a Bachelor’s degree in Actuarial Science. Known for his incisive analysis and insightful content, he possesses a strong command of English and excels in conducting thorough research and delivering timely cryptocurrency market updates.
Disclaimer: The presented content may include the personal opinion of the author and is subject to market condition. Do your market research before investing in cryptocurrencies. The author or the publication does not hold any responsibility for your personal financial loss.
Source link
You may like


Crypto Trader Unveils Massive Bitcoin Price Target Amid Extended BTC Bull Market – Here’s His Outlook


Is it possible to make $1m with crypto?


Japan’s Metaplanet Buys Another $26M in Bitcoin Amid Tariff Market Uncertainty


Has Ethereum Price Bottomed? 3 Reason Why ETH Could Crash More


Crypto markets ‘relatively orderly’ despite Trump tariff chaos: NYDIG


Fartcoin ‘Hot Air Rises’ — $1.50 Just A Whiff Away
24/7 Cryptocurrency News
Mantra Team Responds As The OM Token Price Crashes Over 80% In 24 Hours
Published
9 hours agoon
April 14, 2025By
admin
The Mantra team has addressed the crypto community following the Mantra (OM) token price crash of over 80% in the last 24 hours. Despite the statement, the community is still concerned that this might have been a rug pull by the team, which controls a huge amount of the token’s total supply.
Mantra Team Responds Following Token Crash
In an X post, the Mantra team assured the community that the token is “fundamentally strong” despite the crash that occurred in the last 24 hours. The team blamed the crash on “reckless liquidations” and denied it had anything to do with the project.
They further assured that this had nothing to do with the team and revealed that they were looking into the Mantra price crash and would share more details about what happened as soon as possible.
In an X post, the project’s co-founder, John Patrick Mullin, further revealed that there was a massive forced liquidation from a large OM investor on a Centralized Exchange (CEX). However, he didn’t reveal whether it was one of the top crypto exchanges.
In another X post, Mullin tried to set the record straight. He stated that they didn’t delete the Telegram channel. He further remarked that the team’s tokens all remain in custody and provided a wallet address (mantra…..quam) for community members to verify this claim.
The Mantra co-founder added that they are actively figuring out why these massive forced liquidations occurred and will provide more information as soon as possible. He assured that they are still here and not going anywhere.
Mantra Price Crashes By Over 80% In 24 Hours
CoinMarketCap data shows that the Mantra price has crashed by over 80% in the last 24 hours. The token sharply dropped from an intra-day high of $6.3 to as low as $0.4. However, it has reclaimed the $1 price level following the team’s statement.
However, amid this statement, some community members still seem convinced that this was a rug pull, as the team controls a huge amount of the token’s supply. Crypto commentator Sjuul described the OM token as the LUNA of this cycle.
He further explained why the community believes the crash was a rug pull, stating that the crash began when a wallet believed to be connected to the team suddenly deposited 3.9 million OM tokens to the OKX crypto exchange. This deposit led to significant selling pressure, which caused the Mantra price to crash.
Besides the token’s crash, the broader crypto market is witnessing a downtrend following US President Donald Trump’s statement in which he debunked reports of an exemption. This comes just a day after the crypto market rebounded following reports that the US president had exempted computers, phones, and chips from his tariffs on China and other countries.
Boluwatife Adeyemi
Boluwatife Adeyemi is a well-experienced crypto news writer and editor who has covered topics that cut across several topics and niches. Boluwatife has a knack for simplifying the most technical concepts and making it easy for crypto newbies to understand. Away from writing, He is an avid basketball lover, a traveler and a part-time degen.
Disclaimer: The presented content may include the personal opinion of the author and is subject to market condition. Do your market research before investing in cryptocurrencies. The author or the publication does not hold any responsibility for your personal financial loss.
Source link
24/7 Cryptocurrency News
Michael Saylor Hints At Another MicroStrategy Bitcoin Purchase, BTC Price To Rally?
Published
17 hours agoon
April 13, 2025By
admin
MicroStrategy is lacing up for a potential Bitcoin purchase after Michael Saylor flashed the tell-tale buy signal. The incoming purchase will be the company’s first in Q2 after pausing Bitcoin purchases at the start of April in an eyebrow-raising move.
Michael Saylor Flashes Bitcoin Buy Signal
MicroStrategy CEO Michael Saylor has dropped clues that the software company will continue its Bitcoin accumulation spree. In an X post, Saylor shared MicroStrategy’s portfolio tracker revealing the company’s Bitcoin holdings and valuations.
Michael Saylor’s previous posts sharing Microstrategy’s portfolio tracker over the weekend have resulted in purchases at the start of the week. Investors are lapping up Saylor’s portfolio tracker post and the accompanying caption as cues for a BTC purchase on Monday.
“No tariffs on Orange Dots,” said Saylor, taking a jibe at brewing tariff wars between the US and China.
MicroStrategy had previously halted its Bitcoin purchase spree at the start of April leading to a slump in MSTR price. At the time, there was significant chatter that MicroStrategy may be forced to offload its Bitcoin holdings to cover obligations following a dip in prices.
Per the portfolio tracker, MicroStrategy holds 528,185 BTC on its balance sheet valued at $44.7 billion. Michael Saylor hinting at a potential Bitcoin purchase follows a small dip in prices with BTC holding the $83K mark.
Will Bitcoin Price Rally?
Saylor’s hint at buying Bitcoin has triggered a small bump in prices as the top cryptocurrency surpassed $83K. However, an actual purchase will trigger a significant price action for BTC in line with previous accumulations.
MicroStrategy’s last Bitcoin purchase of 22,048 BTC jolted the markets in line with investors’ expectations. However, there are fears that macroeconomic events like the US-China tariff war may affect a potential BTC rally following MicroStrategy’s incoming purchase.
Bitcoin price has rebounded after a previous bloodbath, sparking fresh optimism in the markets. Crypto Joao Wedson predicts that Bitcoin is not out of the woods yet and a grim drop to $65K is still a possibility for the top cryptocurrency.
“We’re not ruling out the possibility of the price dipping below $65K, as several metrics point to that region as strong support – such as the True Market Mean Price and Alpha Price, both sitting exactly around $64,700,” said Wedson.
Crypto analyst Doctor Profit warns that a BTC price drop to these levels may force MicroStrategy to sell MSTR to avoid liquidation.
Aliyu Pokima
Aliyu Pokima is a seasoned cryptocurrency and emerging technologies journalist with a knack for covering needle-moving stories in the space. Aliyu delivers breaking news stories, regulatory updates, and insightful analysis with depth and precision. When he’s not poring over charts or following leads, Aliyu enjoys playing the bass guitar, lifting weights and running marathons.
Disclaimer: The presented content may include the personal opinion of the author and is subject to market condition. Do your market research before investing in cryptocurrencies. The author or the publication does not hold any responsibility for your personal financial loss.
Source link
24/7 Cryptocurrency News
Shiba Inu Price on The Verge of Breaking $0.00002
Published
1 day agoon
April 13, 2025By
admin
The memecoin ecosystem has joined the latest revival in the broader market, with the Shiba Inu price now in the spotlight. The memecoin has reset its bearish outlook and will break crucial price milestones in the coming days.
For Shiba Inu, the death cross formation was confirmed on April 6 when the price dropped from $0.00001232 to a low of $0.00001030.
Shiba Inu Price Golden Cross Confirmed
Market data shows that the SHIB price is gradually disappearing from its earlier consolidation trend. At the time of writing, the coin’s price was changing hands for $0.00001249, up by 2.14% in 24 hours.
SHIB recovered after trading at a low price of $0.00001205 to a daily high of $0.00001265 before settling at the current level. This price boost comes as the SHIB burn rate jumped 1000% in early trading, setting the memecoin on a possible revival path.


The SHIB/USDT 4h chart confirms a golden cross pattern for the memecoin. This pattern is formed when the short-term Moving Average switches above the longer-term moving average.
Although this pattern is fully formed on the 4-hour chart, it is yet to form on the daily chart. However, with the current momentum, a confirmed breakout is possible. Already, the token has displaced Hedera and now ranks as the 17th largest cryptocurrency.
Shibarium Catalyst for Price Rebound
Different ecosystem factors can boost the price of Shiba Inu in the long term. One of these factors is closely tied to the outlook of Shibarium and its associated Layer-2 scaling solution.
As reported earlier by CoinGape, the Shibarium 200 million addresses milestone is near. If the network attains this landmark, it will show a clear sign of growing adoption, a move that might boost its token valuation.
Already, Shibarium has broken the 1 billion total transaction milestone. Should the Shiba Inu network continue to record organic growth, its chances of outranking Dogecoin is higher.
Amid the ongoing boost, the question remains how high the memecoin could soar. Drawing on this, a potential SHIB retest of its ATH of $0.00008844 is possible moving forward. While it will require as much as a 710% growth from current levels, SHIB can print this uptick, drawing on its historical trend.
Godfrey Benjamin
Benjamin Godfrey is a blockchain enthusiast and journalists who relish writing about the real life applications of blockchain technology and innovations to drive general acceptance and worldwide integration of the emerging technology. His desires to educate people about cryptocurrencies inspires his contributions to renowned blockchain based media and sites. Benjamin Godfrey is a lover of sports and agriculture.
Disclaimer: The presented content may include the personal opinion of the author and is subject to market condition. Do your market research before investing in cryptocurrencies. The author or the publication does not hold any responsibility for your personal financial loss.
Source link

Crypto Trader Unveils Massive Bitcoin Price Target Amid Extended BTC Bull Market – Here’s His Outlook

Is it possible to make $1m with crypto?

Japan’s Metaplanet Buys Another $26M in Bitcoin Amid Tariff Market Uncertainty

Has Ethereum Price Bottomed? 3 Reason Why ETH Could Crash More
Michael Saylor Teases New Bitcoin Buy After Strategy’s $7.69 Billion Q1 BTC Buying Spree

Crypto markets ‘relatively orderly’ despite Trump tariff chaos: NYDIG

Fartcoin ‘Hot Air Rises’ — $1.50 Just A Whiff Away

What happened to the RWA token?

Crypto Strategist Sees Solana-Based Memecoin Surging Higher, Says One AI Altcoin Flashing Strong Chart

Mantra Team Responds As The OM Token Price Crashes Over 80% In 24 Hours

This Week in Crypto Games: Gaming Tokens Crash Out, Eve Frontier Opens Up

Commerce Secretary Lutnick walks back tariff relief on electronics

Gold ETF Inflows Hit Three-Year High as PAXG, XAUT Outperform Wider Crypto Market

Israel’s New Study Shows 51% Of Public Is Interested In Adopting CBDC (Digital Shekel) – Is That So?

Solana Price Eyes Breakout Toward $143 As Inverse Head & Shoulders Pattern Takes Shape On 4-hour Chart

Arthur Hayes, Murad’s Prediction For Meme Coins, AI & DeFi Coins For 2025

Expert Sees Bitcoin Dipping To $50K While Bullish Signs Persist

Aptos Leverages Chainlink To Enhance Scalability and Data Access

Bitcoin Could Rally to $80,000 on the Eve of US Elections

Crypto’s Big Trump Gamble Is Risky

Institutional Investors Go All In on Crypto as 57% Plan to Boost Allocations as Bull Run Heats Up, Sygnum Survey Reveals

Sonic Now ‘Golden Standard’ of Layer-2s After Scaling Transactions to 16,000+ per Second, Says Andre Cronje

Ripple-SEC Case Ends, But These 3 Rivals Could Jump 500x

Has The Bitcoin Price Already Peaked?

A16z-backed Espresso announces mainnet launch of core product

The Future of Bitcoin: Scaling, Institutional Adoption, and Strategic Reserves with Rich Rines

3 Voting Polls Show Why Ripple’s XRP Price Could Hit $10 Soon

Xmas Altcoin Rally Insights by BNM Agent I

Blockchain groups challenge new broker reporting rule

I’m Grateful for Trump’s Embrace of Bitcoin
Trending

 24/7 Cryptocurrency News5 months ago
Arthur Hayes, Murad’s Prediction For Meme Coins, AI & DeFi Coins For 2025

 Bitcoin3 months ago
Expert Sees Bitcoin Dipping To $50K While Bullish Signs Persist

 24/7 Cryptocurrency News3 months ago
Aptos Leverages Chainlink To Enhance Scalability and Data Access

 Bitcoin5 months ago
Bitcoin Could Rally to $80,000 on the Eve of US Elections

 Opinion5 months ago
Crypto’s Big Trump Gamble Is Risky

 Bitcoin5 months ago
Institutional Investors Go All In on Crypto as 57% Plan to Boost Allocations as Bull Run Heats Up, Sygnum Survey Reveals

 Altcoins2 months ago
Sonic Now ‘Golden Standard’ of Layer-2s After Scaling Transactions to 16,000+ per Second, Says Andre Cronje

 Price analysis5 months ago
Ripple-SEC Case Ends, But These 3 Rivals Could Jump 500x


✓ Share: