
Ethereum price
Will Solana Price Reach $160 This Week?

As the cryptocurrency market experiences a resurgence, Solana price finds itself at a pivotal moment. With Bitcoin leading the charge in recovery and the launch of the Solana Seeker mobile fueling optimism, SOL has shown significant upward momentum. However, the SOL/ETH trading pair presents a more complex picture, with Solana facing resistance in its bid to outpace Ethereum (ETH), which is currently hovering around $2,662 and showing strength against Solana. Can SOL price capitalize on green markets and a new phone to reach $200?
Solana Price Seeks 35% Gains Amid Struggle With Ethereum
The SOL/ETH price shows a downtrend as it has broken below the recent support level of around 0.05600 ETH. There is a clear rejection from the previous resistance near 0.05900 ETH, suggesting sellers are in control. The overall trend for SOL/ETH seems to have shifted to bearish after consolidating for several sessions and failing to push higher.
Economist Alex Kruger has warned that going into the 2024 bull run, Solana investors should stop focusing on ETH, as doing so caused the Solana price to record dismal gains in the 2021 bull run.
Ironically $SOLETH is barely up in 2024, and SOL’s performance has been lackluster on a risk adjusted basis (Sharpe ratio ~ 0.7 since Jan 1st).
Sol Maxis would do well in focusing on Solana and stop comparing with Ethereum. Eth Maxis did just that in 2021, and it did not end… pic.twitter.com/mrsbr2nr6w
— Alex Krüger (@krugermacro) September 23, 2024
The chart shows a bearish engulfing candle pattern near the top of the range at 0.05900 ETH, which is a strong indication of a reversal after the prior bullish movement. This adds weight to the downside momentum.
Key Support and Resistance Levels:
- 0.05900 ETH: Strong resistance after the rejection. Price spiked to this level but failed to hold, triggering a selloff.
- 0.05800 ETH: Immediate resistance zone, acting as the top of the recent range before the breakdown.
- 0.05200 ETH: Immediate support, highlighted by the downside projection and previous lows. This marks a possible target zone for the bearish move.

Despite the dismal performance against Ethereum, SOL price prediction shows the asset is gaining against USDT, forming a double-bottom bullish reversal pattern with a measure move target around $165. Further bullish pressure could increase SOL price by 35% to hit the $200 mark, where the next major resistance is located.
Derivative Traders Preparing to Launch SOL Price to $160
While Solana price struggles against the Ethereum price, their Futures traders’ activity suggests a potential rally is coming. According to the Coinglass Liquidation Map data, there are more Solana Longs than Shorts as the cumulative long liquidation leverage is $144 million, compared to $100 million for shorts on the daily time frame. This discrepancy is larger on the weekly timeframe, with $584 million long versus $338 million short.

This imbalance suggests bullish sentiment dominates the market since traders anticipate Solana price will trend higher.
A deeper analysis of the SOL liquidation map shows a huge amount of buy orders have been placed between $140 and $145, meaning that the price may not easily break below this support level.
Frequently Asked Questions (FAQs)
Solana has been underperforming against Ethereum in recent trading sessions, with the SOL/ETH pair showing a downtrend. The pair has broken below key support levels, indicating that sellers are currently in control.
While Solana has shown bullish momentum, hitting $200 depends on continued market support and the ability to maintain gains against both USD and Ethereum (ETH). The price target of $200 represents a significant 35% increase from current levels, and reaching it will require sustained buying pressure.
A double-bottom bullish reversal pattern has formed on the SOL/USDT chart, with a measured move target of $165. If bullish pressure continues, this pattern could support a rally towards the $200 mark, where the next major resistance is located.
Related Articles
Evans Karanja
Evans Karanja is a crypto analyst and journalist with a deep focus on blockchain technology, cryptocurrency, and the video gaming industry. His extensive experience includes collaborating with various startups to deliver insightful and high-quality analyses that resonate with their target audiences. As an avid crypto trader and investor, Evans is passionate about the transformative potential of blockchain across diverse sectors. Outside of his professional pursuits, he enjoys playing video games and exploring scenic waterfalls.
Disclaimer: The presented content may include the personal opinion of the author and is subject to market condition. Do your market research before investing in cryptocurrencies. The author or the publication does not hold any responsibility for your personal financial loss.
Source link


In a recent analysis, crypto analyst Justin Bennett provided insights into how low the Ethereum price could drop by the end of December. This came as the analyst revealed that buyers need to step or ETH could enter next week with a bearish outlook.
How Low Ethereum Price Can Go By Year-End
In an X post, Justin Bennett suggested that the Ethereum price could drop to as low as $3,027 by year-end. While analyzing ETH’s daily chart, the analyst stated that ETH needs to flip $3,541 as support to turn bullish next week. If that doesn’t happen, he remarked there is a decent chance that Ethereum drops lower. The analyst’s accompanying chart showed that ETH could even drop to as low as $2,560 if it loses the $3,027 support level.
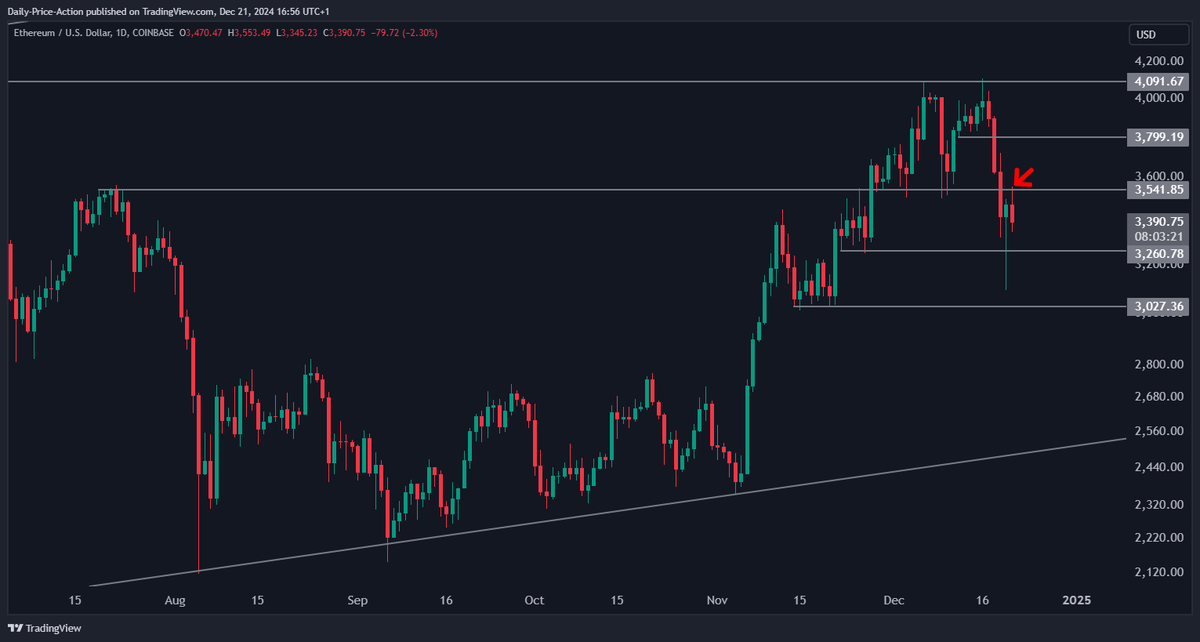
In an earlier X post, the crypto analyst stated that he is bullish on the Ethereum price based on the overall setup going into 2025. however, he believes that buyers still have work to do. He gave an example of how ETH needs to recover $3,540 on the weekly time frame to look bullish next week.
These buyers already look to be stepping in, as there has been an accumulation trend among ETH whales. Coingape reported that Ethereum whales are buying the dip as ETH eyes a quick rally to $4,000.
These whales have withdrawn 17,698 ETH worth $61.66 million from the crypto exchange Binance. Donald Trump’s World Liberty Financial has also gotten in on the act as the DeFi project accumulated more ETH on this dip.
Correction Might Be Over
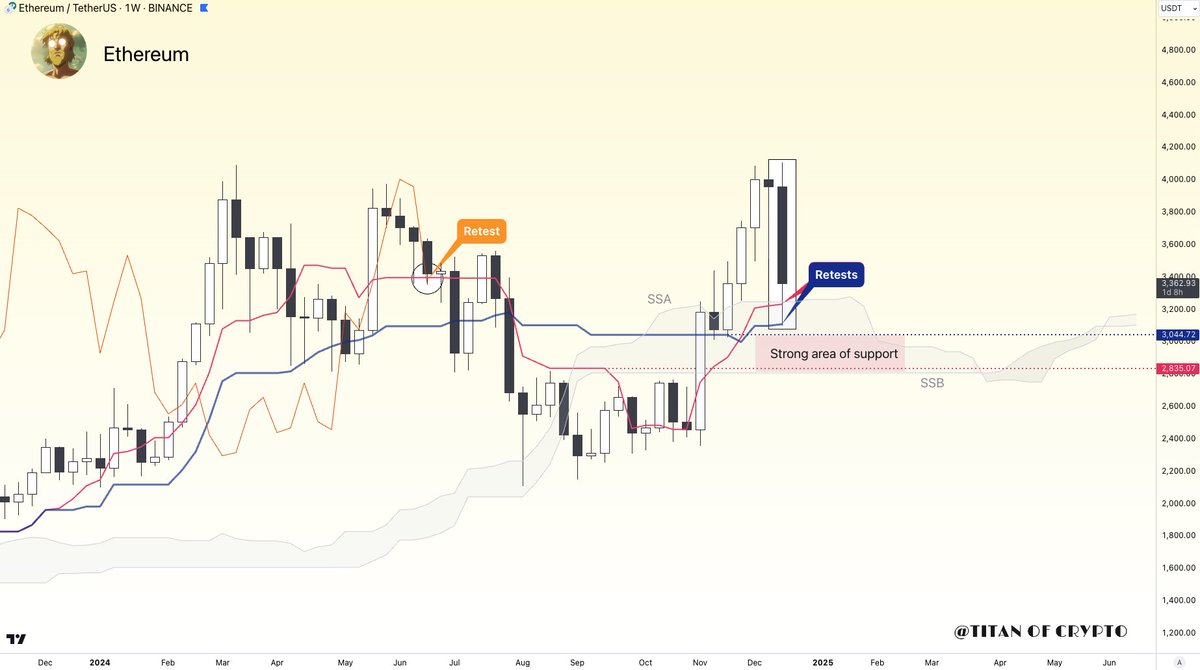
In an X post, crypto analyst Titan of Crypto provided a more bullish outlook for the Ethereum price, stating that the correction might be over. The analyst made this statement based on his Ichimoku cloud analysis.
Titan of Crypto stated that Ethereum has retested both Tenkan and Kijun. He added that the worst-case scenario would be a retest of the Kumo Cloud SSB, Ichimoku’s strongest line.
According to a CoinGape market analysis, this might indeed be the last dip before ETH hits five digits. There are predictions that the Ethereum price could hit $15,937 by May 2025.
Boluwatife Adeyemi
Boluwatife Adeyemi is a well-experienced crypto news writer and editor who has covered topics that cut across DeFi, NFTs, smart contracts, and blockchain interoperability, among others. Boluwatife has a knack for simplifying the most technical concepts and making it easy for crypto newbies to understand. Away from writing, He is an avid basketball lover and a part-time degen.
Disclaimer: The presented content may include the personal opinion of the author and is subject to market condition. Do your market research before investing in cryptocurrencies. The author or the publication does not hold any responsibility for your personal financial loss.
Source link

The Ethereum price could face some turbulence, as Justin Sun, the founder of Tron (TRX), has unstaked a whopping $209 million from Lido Finance, a liquid decentralized staking platform for Ethereum. Compared to top cryptocurrencies like Bitcoin (BTC) and Dogecoin (DOGE), the Ethereum price has had a relatively muted performance, skyrocketing to $4,000 before consolidating and struggling to move higher. With the possibility of more sell-offs, Ethereum could see its price crashing down if Sun decides to dump more coins.
Justin Sun Dumps ETH
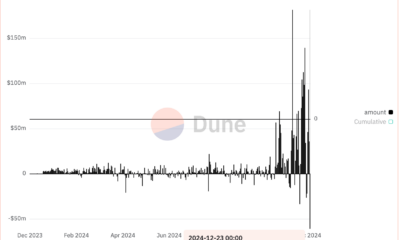
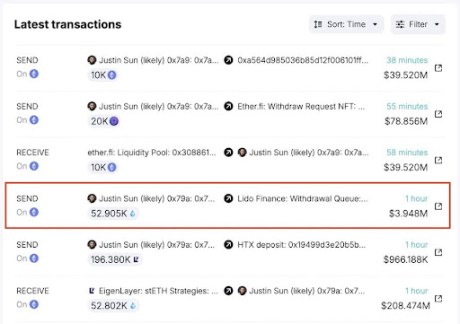
New reports from Spot On Chain, an AI-driven crypto platform, revealed that Sun recently applied to withdraw a staggering 52,905 ETH tokens worth about $209 million from Lido Finance. According to the on-chain data, this massive withdrawal was part of the ETH stash Sun allegedly accumulated between February and August 2024.
Spot On Chain has revealed that the total amount of Ethereum Sun bought within this period amounted to 392,474 ETH tokens, valued at $1.19 billion. All of these tokens were purchased via three wallet addresses at an average price of $3,027. Presently, the total profit the Tron founder has acquired since his purchase is up to $349 million, representing a 29% increase from its purchasing price.
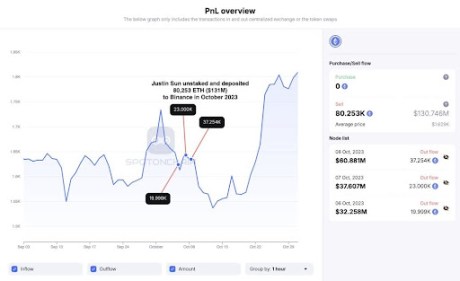
Interestingly, on October 24, Sun had unstaked a massive 80,251 ETH tokens, worth over $131 million, from Lido Finance. Four days later, he transferred the entire amount to Binance, the world’s largest crypto exchange. This notable move took place just before the price of Ethereum had dropped sharply by 5% in mid-October, which could have resulted in a loss for Sun.
Unsurprisingly, this is not the first time Sun has dumped Ethereum. Spot On Chain revealed earlier this month that the Tron Founder had been cashing in his Ethereum holdings during the market rally.
In November, Sun deposited 19,000 ETH worth $60.83 million to HTX, a crypto exchange. Additionally, he transferred 29,920 ETH valued at $119.7 million to HTX again after its price surpassed $4,000 over the past week. These are just a few transactions the Tron founder has made with ETH over the past month.
Given Sun’s history of large-scale asset movements, further sell-offs could impact the already fragile Ethereum market. Nevertheless, the lingering question remains whether the Tron founder will continue his Ethereum dumping spree.
Ethereum Price Crash Ahead?
While Sun has not publicly commented on his recent large-scale Ethereum withdrawals, the size and timing of these transactions could pose a problem for the altcoin’s future trajectory. Historically, large ETH liquidations have triggered a price crash due to increasing selling pressures.
Related Reading
With the price of Ethereum still unstable and aiming for a stronger upward rally, further large-scale ETH dumps could exacerbate market volatility, especially if other investors or whales follow suit. For now, the price of Ethereum seems to be performing well, recording a more than 7% increase in the last seven days and a 28% surge over the past month, according to CoinMarketCap.
Featured image created with Dall.E, chart from Tradingview.com
Source link
Ethereum price today trades at $3,871.7 as of 11 PM. The drop comes after ETH hit a daily high of $3,944.4 after -0.79% move on December 15.
Ethereum Price Today: Why is ETH down?
Ethereum price faces rejection from the parallel channel’s midpoint. This weakness can be attributed to Bitcoin’s recent slump, which has affected altcoins, include ETH. Additionally, the end of the week is often leads to a drop in volume and liquidity.
Will Ether bounce or drop lower? Let’s explore.
Ethereum Price Chart Today

*Ethereum price updated as of 11 PM.
Ethereum’s innovative smart contract technology has made it a standout altcoin since its inception in 2015. Continuous major network upgrades ensure Ethereum stays ahead in smart contract innovation. The latest upgrade, Cancun, launched on March 13, 2024.
Ethereum Price Forecast & Outlook
ETH’s year-to-date (YTD) performance continues to increase and currently sits at 75.29%. This recent slump in Bitcoin price has affected the YTD gains, which have dropped from 50% since November 11.
Ethereum: The Second-Largest Crypto By Market Cap

Ethereum ranks second in market capitalization, valued at $466.8 billion, after Bitcoin’s $1.95 trillion. Together, BTC & ETH’s market capitalization constitutes 83% of the total crypto market cap.
Since its all-time high of $571 billion in November 2021, Ethereum’s value decreased by half in October, but has spiked recently due to Bitcoin’s new ATH. Still, Ethereum maintains a strong lead over other popular cryptocurrencies:
- Solana (SOL): $109 billion
- Ripple (XRP): $138 billion
- BNB (BNB): $104 billion
In addition to a massive market cap, Ethereum’s 24-hour trading volume sits at $28.6 billion.
Ethereum’s Crypto Trading Volume Soars
The 24-hour trading volume of Ethereum is $28.6 billion. Binance is the largest contributor to this trading volume – about 11% is contributed by spot trading and nearly 40% from futures trading. Exchanges like OKX, Bitget, and ByBit follow Binance.
Ethereum’s Proof-of-Stake Technology
The London hard fork is a significant Ethereum blockchain upgrade. It changed the network from Proof-of-Work (PoW) to Proof-of-Stake (PoS). Ethereum co-founder Vitalik Buterin recently shared his thoughts on X (formerly Twitter). He explained how Proof-of-Stake (PoS) is more decentralized than Proof-of-Work (PoW).
Important Upgrades to Ethereum Blockchain
Here are some key upgrades in the past five years that shaped Ethereum as the second-largest crypto by market capitalization.
Cancun-Deneb (“Dencun”): This upgrade aimed to improve Ethereum’s scalability, security, and usability, setting the stage for further enhancements.
2023:
2022:
2021:
London: Implemented the highly anticipated EIP-1559, which reformed the transaction fee market, making it more efficient and user-friendly.
2020:
ETH Gas’ Effect on Ether Prices
The blockchain upgrades Ethereum receives aim to solve the trilemma of blockchain, i.e., balancing decentralization, security, and scalability. The switch to Proof-of-Stake (PoS) enhanced these aspects. Ethereum’s transaction fees (gas fees) plummeted post-upgrade, drawing more investors. Gas fees are like taxes, measured in Gwei, required for secure transactions.
As of December 15, the gas fee for a transaction on the ETH network as of 11 PM is 14 Gwei.
When Ethereum’s on-chain value grows, presenting opportunities, investors flock, driving gas fees up. This typically occurs during market upswings, peaking at all-time highs.
Ethereum Price Forecast For The Next 7 Days
| Date | Price | Change |
|---|---|---|
| December 14, 2024 | 3873.35 | -1.43% |
| December 15, 2024 | 3876.29 | -1.35% |
| December 16, 2024 | 3878.41 | -1.3% |
| December 17, 2024 | 3890.85 | -0.98% |
| December 18, 2024 | 3928.84 | -0.01% |
| December 19, 2024 | 3925.03 | -0.11% |
| December 20, 2024 | 3932.95 | 0.09% |
| December 21, 2024 | 3926.91 | -0.06% |
| December 22, 2024 | 3907.58 | -0.56% |
| December 23, 2024 | 3899.74 | -0.75% |
| December 24, 2024 | 3897.59 | -0.81% |
| December 25, 2024 | 3878.41 | -1.3% |
| December 26, 2024 | 3901.36 | -0.71% |
| December 27, 2024 | 3912.61 | -0.43% |
| December 28, 2024 | 3937.11 | 0.2% |
| December 29, 2024 | 3986.24 | 1.45% |
| December 30, 2024 | 3982.79 | 1.36% |
| December 31, 2024 | 3995.28 | 1.68% |
| January 01, 2025 | 4002.47 | 1.86% |
| January 02, 2025 | 3998.53 | 1.76% |
| January 03, 2025 | 4007.53 | 1.99% |
| January 04, 2025 | 4093.78 | 4.18% |
| January 05, 2025 | 4214.33 | 7.25% |
| January 06, 2025 | 4249.69 | 8.15% |
| January 07, 2025 | 4313.27 | 9.77% |
| January 08, 2025 | 4377.11 | 11.39% |
| January 09, 2025 | 4363.26 | 11.04% |
| January 10, 2025 | 4382.38 | 11.53% |
| January 11, 2025 | 4439.84 | 12.99% |
| January 12, 2025 | 4261.57 | 8.45% |
Based on CoinGagpe’s Ethereum price predictions, investors can expect ETH to trade at around $3,373 in the next week. This is a considerate prediction and is in line with the lackluster performance seen since the start of 2024.
Ethereum Price Forecast Between 2025 & 2029
| January | $3,685.34 | $4,024.04 | $3,854.70 | 59.9% |
| February | $3,497.33 | $4,061.84 | $3,779.59 | 56.8% |
| March | $3,309.32 | $4,099.64 | $3,704.49 | 53.6% |
| April | $3,121.31 | $4,137.44 | $3,629.38 | 50.5% |
| May | $2,933.30 | $4,175.24 | $3,554.28 | 47.4% |
| June | $2,745.29 | $4,213.04 | $3,479.17 | 44.3% |
| July | $2,557.28 | $4,250.84 | $3,404.07 | 41.2% |
| August | $2,369.27 | $4,288.64 | $3,328.96 | 38.1% |
| September | $2,181.26 | $4,326.44 | $3,253.86 | 35% |
| October | $1,993.25 | $4,364.24 | $3,178.75 | 31.8% |
| November | $1,805.24 | $4,402.04 | $3,103.65 | 28.7% |
| December | $1,617.23 | $4,439.84 | $3,028.54 | 25.6% |
| All Time | $2,651.29 | $4,231.94 | $3,441.62 | 42.7% |
| January | $1,917.96 | $4,517.77 | $3,299.08 | 36.8% |
| February | $2,218.69 | $4,595.70 | $3,569.62 | 48.1% |
| March | $2,519.42 | $4,673.63 | $3,840.16 | 59.3% |
| April | $2,820.15 | $4,751.56 | $4,110.69 | 70.5% |
| May | $3,120.88 | $4,829.49 | $4,381.23 | 81.7% |
| June | $3,421.62 | $4,907.42 | $4,651.77 | 92.9% |
| July | $3,722.35 | $4,985.35 | $4,922.31 | 104.2% |
| August | $4,023.08 | $5,063.28 | $5,192.85 | 115.4% |
| September | $4,323.81 | $5,141.21 | $5,463.39 | 126.6% |
| October | $4,624.54 | $5,219.14 | $5,733.92 | 137.8% |
| November | $4,925.27 | $5,297.07 | $6,004.46 | 149% |
| December | $5,226 | $5,375 | $6,275 | 160.3% |
| All Time | $3,571.98 | $4,946.39 | $4,787.04 | 98.5% |
| January | $5,417.25 | $5,571.75 | $6,513.75 | 170.2% |
| February | $5,608.50 | $5,768.50 | $6,752.50 | 180.1% |
| March | $5,799.75 | $5,965.25 | $6,991.25 | 190% |
| April | $5,991 | $6,162 | $7,230 | 199.9% |
| May | $6,182.25 | $6,358.75 | $7,468.75 | 209.8% |
| June | $6,373.50 | $6,555.50 | $7,707.50 | 219.7% |
| July | $6,564.75 | $6,752.25 | $7,946.25 | 229.6% |
| August | $6,756 | $6,949 | $8,185 | 239.5% |
| September | $6,947.25 | $7,145.75 | $8,423.75 | 249.4% |
| October | $7,138.50 | $7,342.50 | $8,662.50 | 259.3% |
| November | $7,329.75 | $7,539.25 | $8,901.25 | 269.2% |
| December | $7,521 | $7,736 | $9,140 | 279.1% |
| All Time | $6,469.13 | $6,653.88 | $7,826.88 | 224.6% |
| January | $7,771.92 | $8,001.25 | $9,467.83 | 292.7% |
| February | $8,022.83 | $8,266.50 | $9,795.67 | 306.3% |
| March | $8,273.75 | $8,531.75 | $10,123.50 | 319.9% |
| April | $8,524.67 | $8,797 | $10,451.33 | 333.5% |
| May | $8,775.58 | $9,062.25 | $10,779.17 | 347.1% |
| June | $9,026.50 | $9,327.50 | $11,107 | 360.7% |
| July | $9,277.42 | $9,592.75 | $11,434.83 | 374.3% |
| August | $9,528.33 | $9,858 | $11,762.67 | 387.9% |
| September | $9,779.25 | $10,123.25 | $12,090.50 | 401.5% |
| October | $10,030.17 | $10,388.50 | $12,418.33 | 415.1% |
| November | $10,281.08 | $10,653.75 | $12,746.17 | 428.7% |
| December | $10,532 | $10,919 | $13,074 | 442.3% |
| All Time | $9,151.96 | $9,460.13 | $11,270.92 | 367.5% |
| January | $10,940 | $11,331.17 | $13,534.75 | 461.4% |
| February | $11,348 | $11,743.33 | $13,995.50 | 480.5% |
| March | $11,756 | $12,155.50 | $14,456.25 | 499.6% |
| April | $12,164 | $12,567.67 | $14,917 | 518.7% |
| May | $12,572 | $12,979.83 | $15,377.75 | 537.8% |
| June | $12,980 | $13,392 | $15,838.50 | 556.9% |
| July | $13,388 | $13,804.17 | $16,299.25 | 576% |
| August | $13,796 | $14,216.33 | $16,760 | 595.1% |
| September | $14,204 | $14,628.50 | $17,220.75 | 614.3% |
| October | $14,612 | $15,040.67 | $17,681.50 | 633.4% |
| November | $15,020 | $15,452.83 | $18,142.25 | 652.5% |
| December | $15,428 | $15,865 | $18,603 | 671.6% |
| All Time | $13,184 | $13,598.08 | $16,068.88 | 566.5% |
In the next year, Ethereum price could still be hovering in the current range. Based on the prediction data, ETH’s trade range extends from $3,001.19 to $4,651.84. This outlook is based on the previous data. However, if ETH breaks the trend, it could go much higher.
The long-term outlook extending from 2025 to 2029, Ethereum price could hit a high of $18,603 with the lowest point being $3,000.
Ethereum Price Outlook Between 2030 & 2050
2030
2031
2032
2033
2040
2050
| January | $16,092.58 | $16,559.25 | $19,264.08 | 699% |
| February | $16,757.17 | $17,253.50 | $19,925.17 | 726.4% |
| March | $17,421.75 | $17,947.75 | $20,586.25 | 753.8% |
| April | $18,086.33 | $18,642 | $21,247.33 | 781.3% |
| May | $18,750.92 | $19,336.25 | $21,908.42 | 808.7% |
| June | $19,415.50 | $20,030.50 | $22,569.50 | 836.1% |
| July | $20,080.08 | $20,724.75 | $23,230.58 | 863.5% |
| August | $20,744.67 | $21,419 | $23,891.67 | 890.9% |
| September | $21,409.25 | $22,113.25 | $24,552.75 | 918.4% |
| October | $22,073.83 | $22,807.50 | $25,213.83 | 945.8% |
| November | $22,738.42 | $23,501.75 | $25,874.92 | 973.2% |
| December | $23,403 | $24,196 | $26,536 | 1000.6% |
| All Time | $19,747.79 | $20,377.63 | $22,900.04 | 849.8% |
| January | $24,169.83 | $24,997.58 | $27,711.08 | 1049.4% |
| February | $24,936.67 | $25,799.17 | $28,886.17 | 1098.1% |
| March | $25,703.50 | $26,600.75 | $30,061.25 | 1146.8% |
| April | $26,470.33 | $27,402.33 | $31,236.33 | 1195.6% |
| May | $27,237.17 | $28,203.92 | $32,411.42 | 1244.3% |
| June | $28,004 | $29,005.50 | $33,586.50 | 1293.1% |
| July | $28,770.83 | $29,807.08 | $34,761.58 | 1341.8% |
| August | $29,537.67 | $30,608.67 | $35,936.67 | 1390.5% |
| September | $30,304.50 | $31,410.25 | $37,111.75 | 1439.3% |
| October | $31,071.33 | $32,211.83 | $38,286.83 | 1488% |
| November | $31,838.17 | $33,013.42 | $39,461.92 | 1536.7% |
| December | $32,605 | $33,815 | $40,637 | 1585.5% |
| All Time | $28,387.42 | $29,406.29 | $34,174.04 | 1317.4% |
| January | $33,881.25 | $35,131.33 | $42,063 | 1644.6% |
| February | $35,157.50 | $36,447.67 | $43,489 | 1703.8% |
| March | $36,433.75 | $37,764 | $44,915 | 1762.9% |
| April | $37,710 | $39,080.33 | $46,341 | 1822.1% |
| May | $38,986.25 | $40,396.67 | $47,767 | 1881.2% |
| June | $40,262.50 | $41,713 | $49,193 | 1940.4% |
| July | $41,538.75 | $43,029.33 | $50,619 | 1999.5% |
| August | $42,815 | $44,345.67 | $52,045 | 2058.6% |
| September | $44,091.25 | $45,662 | $53,471 | 2117.8% |
| October | $45,367.50 | $46,978.33 | $54,897 | 2176.9% |
| November | $46,643.75 | $48,294.67 | $56,323 | 2236.1% |
| December | $47,920 | $49,611 | $57,749 | 2295.2% |
| All Time | $40,900.63 | $42,371.17 | $49,906 | 1969.9% |
| January | $49,768.50 | $51,484 | $59,820.33 | 2381.1% |
| February | $51,617 | $53,357 | $61,891.67 | 2467.1% |
| March | $53,465.50 | $55,230 | $63,963 | 2553% |
| April | $55,314 | $57,103 | $66,034.33 | 2638.9% |
| May | $57,162.50 | $58,976 | $68,105.67 | 2724.8% |
| June | $59,011 | $60,849 | $70,177 | 2810.7% |
| July | $60,859.50 | $62,722 | $72,248.33 | 2896.6% |
| August | $62,708 | $64,595 | $74,319.67 | 2982.5% |
| September | $64,556.50 | $66,468 | $76,391 | 3068.4% |
| October | $66,405 | $68,341 | $78,462.33 | 3154.3% |
| November | $68,253.50 | $70,214 | $80,533.67 | 3240.3% |
| December | $70,102 | $72,087 | $82,605 | 3326.2% |
| All Time | $59,935.25 | $61,785.50 | $71,212.67 | 2853.7% |
| January | $72,550.17 | $75,090.58 | $85,513 | 3446.8% |
| February | $74,998.33 | $78,094.17 | $88,421 | 3567.4% |
| March | $77,446.50 | $81,097.75 | $91,329 | 3688% |
| April | $79,894.67 | $84,101.33 | $94,237 | 3808.6% |
| May | $82,342.83 | $87,104.92 | $97,145 | 3929.2% |
| June | $84,791 | $90,108.50 | $100,053 | 4049.9% |
| July | $87,239.17 | $93,112.08 | $102,961 | 4170.5% |
| August | $89,687.33 | $96,115.67 | $105,869 | 4291.1% |
| September | $92,135.50 | $99,119.25 | $108,777 | 4411.7% |
| October | $94,583.67 | $102,122.83 | $111,685 | 4532.3% |
| November | $97,031.83 | $105,126.42 | $114,593 | 4652.9% |
| December | $99,480 | $108,130 | $117,501 | 4773.5% |
| All Time | $86,015.08 | $91,610.29 | $101,507 | 4110.2% |
| January | $102,603.75 | $110,953.42 | $120,084.17 | 4880.7% |
| February | $105,727.50 | $113,776.83 | $122,667.33 | 4987.8% |
| March | $108,851.25 | $116,600.25 | $125,250.50 | 5095% |
| April | $111,975 | $119,423.67 | $127,833.67 | 5202.1% |
| May | $115,098.75 | $122,247.08 | $130,416.83 | 5309.2% |
| June | $118,222.50 | $125,070.50 | $133,000 | 5416.4% |
| July | $121,346.25 | $127,893.92 | $135,583.17 | 5523.5% |
| August | $124,470 | $130,717.33 | $138,166.33 | 5630.7% |
| September | $127,593.75 | $133,540.75 | $140,749.50 | 5737.8% |
| October | $130,717.50 | $136,364.17 | $143,332.67 | 5844.9% |
| November | $133,841.25 | $139,187.58 | $145,915.83 | 5952.1% |
| December | $136,965 | $142,011 | $148,499 | 6059.2% |
| All Time | $119,784.38 | $126,482.21 | $134,291.58 | 5470% |
Between 2023 and 2050, Ethereum’s price will most likely follow the bullish outlook and aim for the six-digit territory. The lowest price point is $16,092.58, and the highest price of Ether is $145,915.83.
Ethereum Price Analysis: ETH Fundamentals Remain Strong
As explained in a previous article, Ethereum treads in a parallel channel. However, ETH is facing rejection at the channel’s midpoint unlike the expectation of a breakout to the upside. This development comes as BTC hovers around $100,000 without a directional bias. As BTC continues to tread lower, Ethereum and other altcoins are also likely to follow suit.
The rejection has pushed Ethereum closer to the $3,866 support level. A breakdown of this could send ETH down to the channel’s lower limit around $3,700, which is shaky at best. So investors should keep an eye on $3,371, a stable support level.

Interestingly, the network activity and daily active addresses are stable at six-month highs. This shows strength and investor interest.

Fruther supporting a strong fundamental development for ETH is the recent spot ETF inflow. Since Novmeber 22, Ethereum ETF inflows have been positive, indicating a strong demand from institutions.

All in all, the long-term outlook for Ethereum price continues to remain strong, but the short-term outlook remains bearish with price retracing due to volatility.
Source link

SCENE’s 2024 Person of the Year: Iggy Azalea

BTC Risks Falling To $20K If This Happens

Most Layer 2 solutions are still struggling with scalability

Here’s why Stellar Price Could Go Parabolic Soon

Perp-Focused HyperLiquid Experiences Record $60M in USDC Net Outflows

Experts say these 3 altcoins will rally 3,000% soon, and XRP isn’t one of them

Robert Kiyosaki Hints At Economic Depression Ahead, What It Means For BTC?

BNB Steadies Above Support: Will Bullish Momentum Return?

Metaplanet makes largest Bitcoin bet, acquires nearly 620 BTC

Tron’s Justin Sun Offloads 50% ETH Holdings, Ethereum Price Crash Imminent?

Investors bet on this $0.0013 token destined to leave Cardano and Shiba Inu behind

End of Altcoin Season? Glassnode Co-Founders Warn Alts in Danger of Lagging Behind After Last Week’s Correction

Can Pi Network Price Triple Before 2024 Ends?

XRP’s $5, $10 goals are trending, but this altcoin with 7,400% potential takes the spotlight

CryptoQuant Hails Binance Reserve Amid High Leverage Trading
182267361726451435
Why Did Trump Change His Mind on Bitcoin?

Top Crypto News Headlines of The Week

New U.S. president must bring clarity to crypto regulation, analyst says

Will XRP Price Defend $0.5 Support If SEC Decides to Appeal?

Bitcoin Open-Source Development Takes The Stage In Nashville

Ethereum, Solana touch key levels as Bitcoin spikes

Bitcoin 20% Surge In 3 Weeks Teases Record-Breaking Potential

Ethereum Crash A Buying Opportunity? This Whale Thinks So

Shiba Inu Price Slips 4% as 3500% Burn Rate Surge Fails to Halt Correction

Washington financial watchdog warns of scam involving fake crypto ‘professors’

‘Hamster Kombat’ Airdrop Delayed as Pre-Market Trading for Telegram Game Expands

Citigroup Executive Steps Down To Explore Crypto
Mostbet Güvenilir Mi – Casino Bonus 2024

NoOnes Bitcoin Philosophy: Everyone Eats

 3 months ago
182267361726451435

 Donald Trump5 months ago
Why Did Trump Change His Mind on Bitcoin?
 24/7 Cryptocurrency News4 months ago
Top Crypto News Headlines of The Week
 News4 months ago
New U.S. president must bring clarity to crypto regulation, analyst says
 Price analysis4 months ago
Will XRP Price Defend $0.5 Support If SEC Decides to Appeal?
 Opinion5 months ago
Bitcoin Open-Source Development Takes The Stage In Nashville
 Bitcoin5 months ago
Ethereum, Solana touch key levels as Bitcoin spikes
 Bitcoin5 months ago
Bitcoin 20% Surge In 3 Weeks Teases Record-Breaking Potential

✓ Share: