
Dogecoin Price
$1.4B at Risk If DOGE Falls Below This Level

Dogecoin price broke out of a falling wedge in the early hours of Monday Morning, signaling a bearish reversal. The 4-hour price chart shows DOGE has gotten some relief from the downtrend as the price has picked up over the last few hours. However, DOGE price is not out of the woods yet, as Futures data shows that there is increasing sell pressure on the asset, which puts over $1.4 billion worth of DOGE at risk of sinking into losses.
Dogecoin Price Facing Rejection at Resistance
The current trend for DOGE price is downward, indicated by the price trading below the 200-day (black line at $0.115) and hovering just above the 50-day exponential moving average (EMA) (green line at $0.105). The recent price action suggests continued bearish momentum.
The nearest resistance level for Dogecoin’s price is $0.105 (aligned with the 50-day EMA), while a more significant resistance exists at 0.11518 (200-day EMA).
The immediate support is around $0.093 (orange line), and stronger support lies in the $0.080 – $0.085 range (grey zone).
The rising wedge has broken downwards, which is a bearish sign. The most recent candles suggest increasing selling pressure as prices approach support levels.
The Relative Strength Index (RSI) is at 50.34, which is neutral but shows a slight bearish bias, as it’s trending down from overbought levels. The Chaikin Money Flow (CMF) is at -0.11, indicating mild selling pressure, which could increase if the Dogecoin price continues to drop.
There has been a consistent volume during the wedge formation, with a spike during the breakdown. This confirms the bearish breakout, with volume supporting the downward move.

Dogecoin price prediction shows that if it surges above the 200-day EMA, it may invalidate the falling wedge bearish reversal pattern and rise to $0.14 as the new price target.
On-Chain and Futures Support Correction
The Dogecoin open interest (OI) dropped by 1.95% in the last 24 hours, indicating that the DOGE market is losing funds. DOGE price also dropped 1% during the same period of time to trade at $0.105.
 Combining these two data points shows that DOGE traders who are Long on the asset are closing their positions.
Additionally, the 4-hour cumulative volume delta (CVD) from Coinalyze, which shows the difference between buy and sell volumes within the last 4 hours, is negative, indicating that more people are selling than buying.
 When both OI and CVD decrease, it indicates that traders are closing Long positions, signaling a bearish trend.
Data from IntoTheBlock revealed that over $1.4 billion worth of DOGE is at risk of losing value if the Dogecoin price slips below $0.09.
 Currently, 45.16% of all DOGE holders are in profit. If the price slides below this crucial support level, the percentage of profitable holders could drop by 19%.
On a positive note, data from Messari Research analytics shows that Dogecoin’s active addresses recently witnessed a spike, which suggests that investors may be taking an interest in the blockchain.
 Overall, the bearish Futures metrics outweigh the single on-chain metric from the Dogecoin blockchain. While active addresses suggest real users and activity on the network, the current selling pressure on DOGE may suppress the metric’s impact.
Frequently Asked Questions (FAQs)
Immediate support for Dogecoin is around $0.093. Stronger support is located in the $0.080 – $0.085 range. If the price approaches these support levels, it may determine whether Dogecoin can stabilize or continue to decline.
If Dogecoin surges above the 200-day EMA ($0.11518), it could invalidate the bearish falling wedge pattern and potentially rise to $0.14. However, if the price continues to decline, it may test lower support levels.
If Dogecoin’s price falls below $0.09, over $1.4 billion worth of DOGE could be at risk of losing value. This drop could also affect 45.16% of DOGE holders who are currently in profit, potentially reducing their gains by 19%.
Related Articles
Evans Karanja
Evans Karanja is a content writer and scriptwriter with a focus on crypto, blockchain, and video gaming. He has worked with various startups in the past, helping them create engaging and high-quality content that captures the essence of their brand. Evans is also an avid crypto trader and investor, and he believes that blockchain will revolutionize many industries in the years to come. When he is not writing, you can find him playing video games or chasing waterfalls.
Disclaimer: The presented content may include the personal opinion of the author and is subject to market condition. Do your market research before investing in cryptocurrencies. The author or the publication does not hold any responsibility for your personal financial loss.
Source link


The Dogecoin price is at risk of more decline following a recent whale movement, which indicates a potential sell-off. The foremost meme coin is already down over 18% in the last 24 hours amid this recent crypto market crash.
Dogecoin Price Could Drop Lower As Whale Moves $59 Million
The Dogecoin price is at risk of further drop as a whale recently moved $59 million. Whale Alert data shows this investor moved 200 million DOGE to the Binance exchange.
Such Whale movement always sparks a bearish outlook for a crypto’s price, as it suggests the investor in question is looking to offload their coins. Such sale could put significant selling pressure of the top meme coin, leading to more price declines.
As CoinGape reported, the DOGE price has plummeted and is at risk of dropping to as low as $0.20, which marks a crucial support level for the meme coin.
In an X post, crypto analyst Kevin Capital suggested that a Dogecoin price drop to this level would be worrisome. He stated that he would start to worry of DOGE loses $0.26 on a weekly close. However, for now, he believes that this price decline is a normal market pullback.
The analyst also noted that the correction had been brewing in the charts for weeks. However, he suggested that this price decline is worse than expected thanks to the Fed’s hawkish stance and an imminent US government shutdown.
What Next For DOGE?
The Dogecoin price is still expected to witness a bullish reversal at some point, as analysts predict that the bull run is far from over. Crypto analyst Master Kenobi suggested that this bullish reversal could happen in January 2025.
This came as the analyst alluded to the 2021 bull run when a similar crypto market crash occurred in December 2020. The analyst noted that the Bitcoin price suffered a 30% loss while DOGE also followed suit, dropping by 55%.
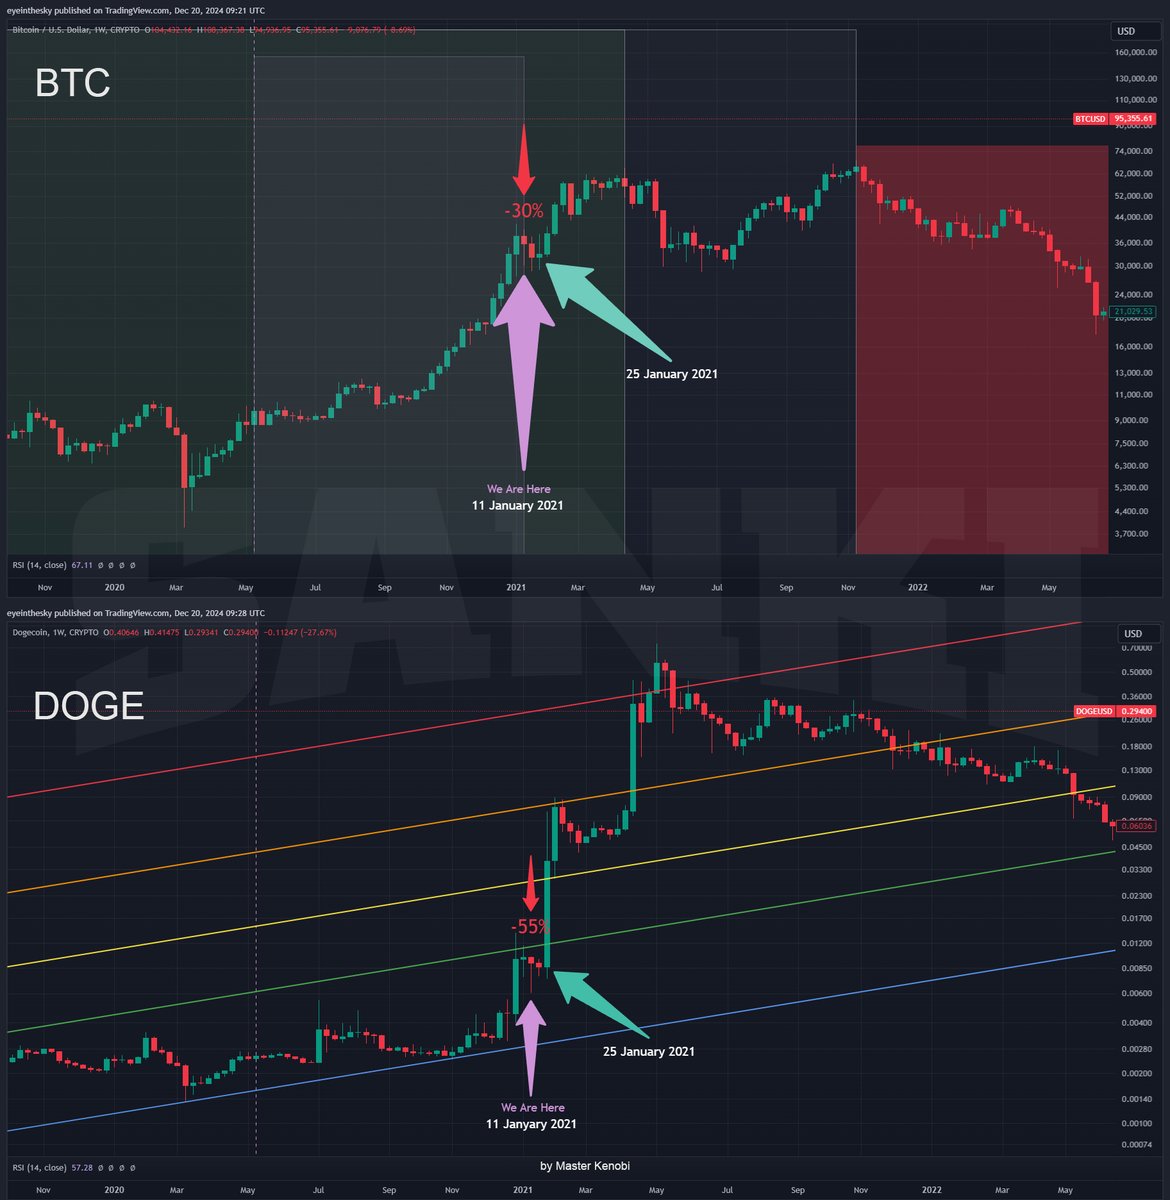
However, amid the panic, these coins witnessed a bullish reversal in January 2021 as they surged to new highs. This eventually paved the way for the Dogecoin price its current ATH of $0.73 in May 2021.
As such, if history repeats itself, Dogecoin could recover to new highs by January. Kevin had before now also predicted that the top meme coin could pull back to between $0.26 and $0.28 and then reload and come back to break its current ATH.
Boluwatife Adeyemi
Boluwatife Adeyemi is a well-experienced crypto news writer and editor who has covered topics that cut across DeFi, NFTs, smart contracts, and blockchain interoperability, among others. Boluwatife has a knack for simplifying the most technical concepts and making it easy for crypto newbies to understand. Away from writing, He is an avid basketball lover and a part-time degen.
Disclaimer: The presented content may include the personal opinion of the author and is subject to market condition. Do your market research before investing in cryptocurrencies. The author or the publication does not hold any responsibility for your personal financial loss.
Source link

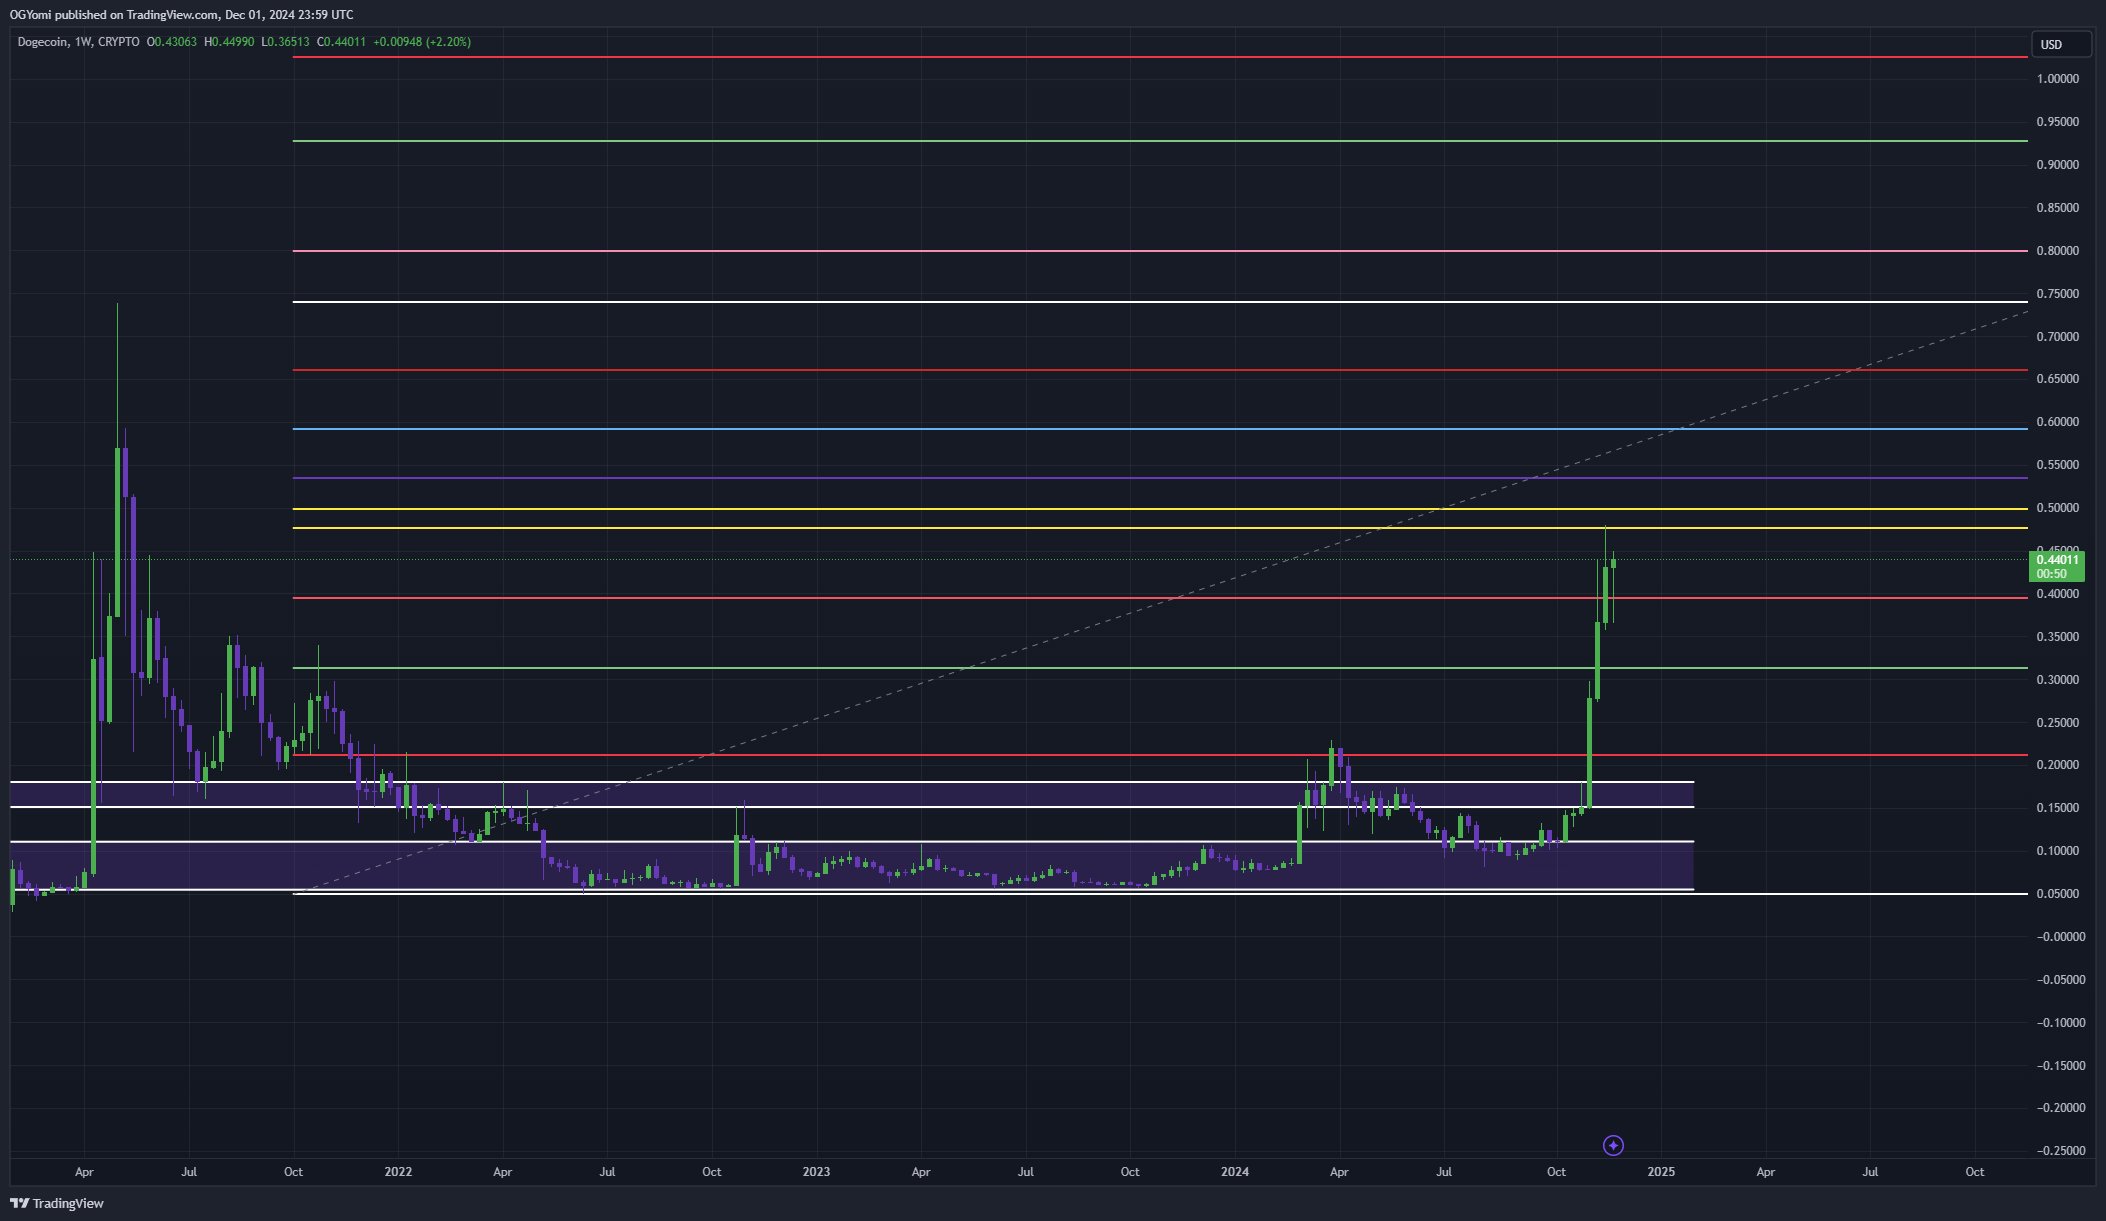
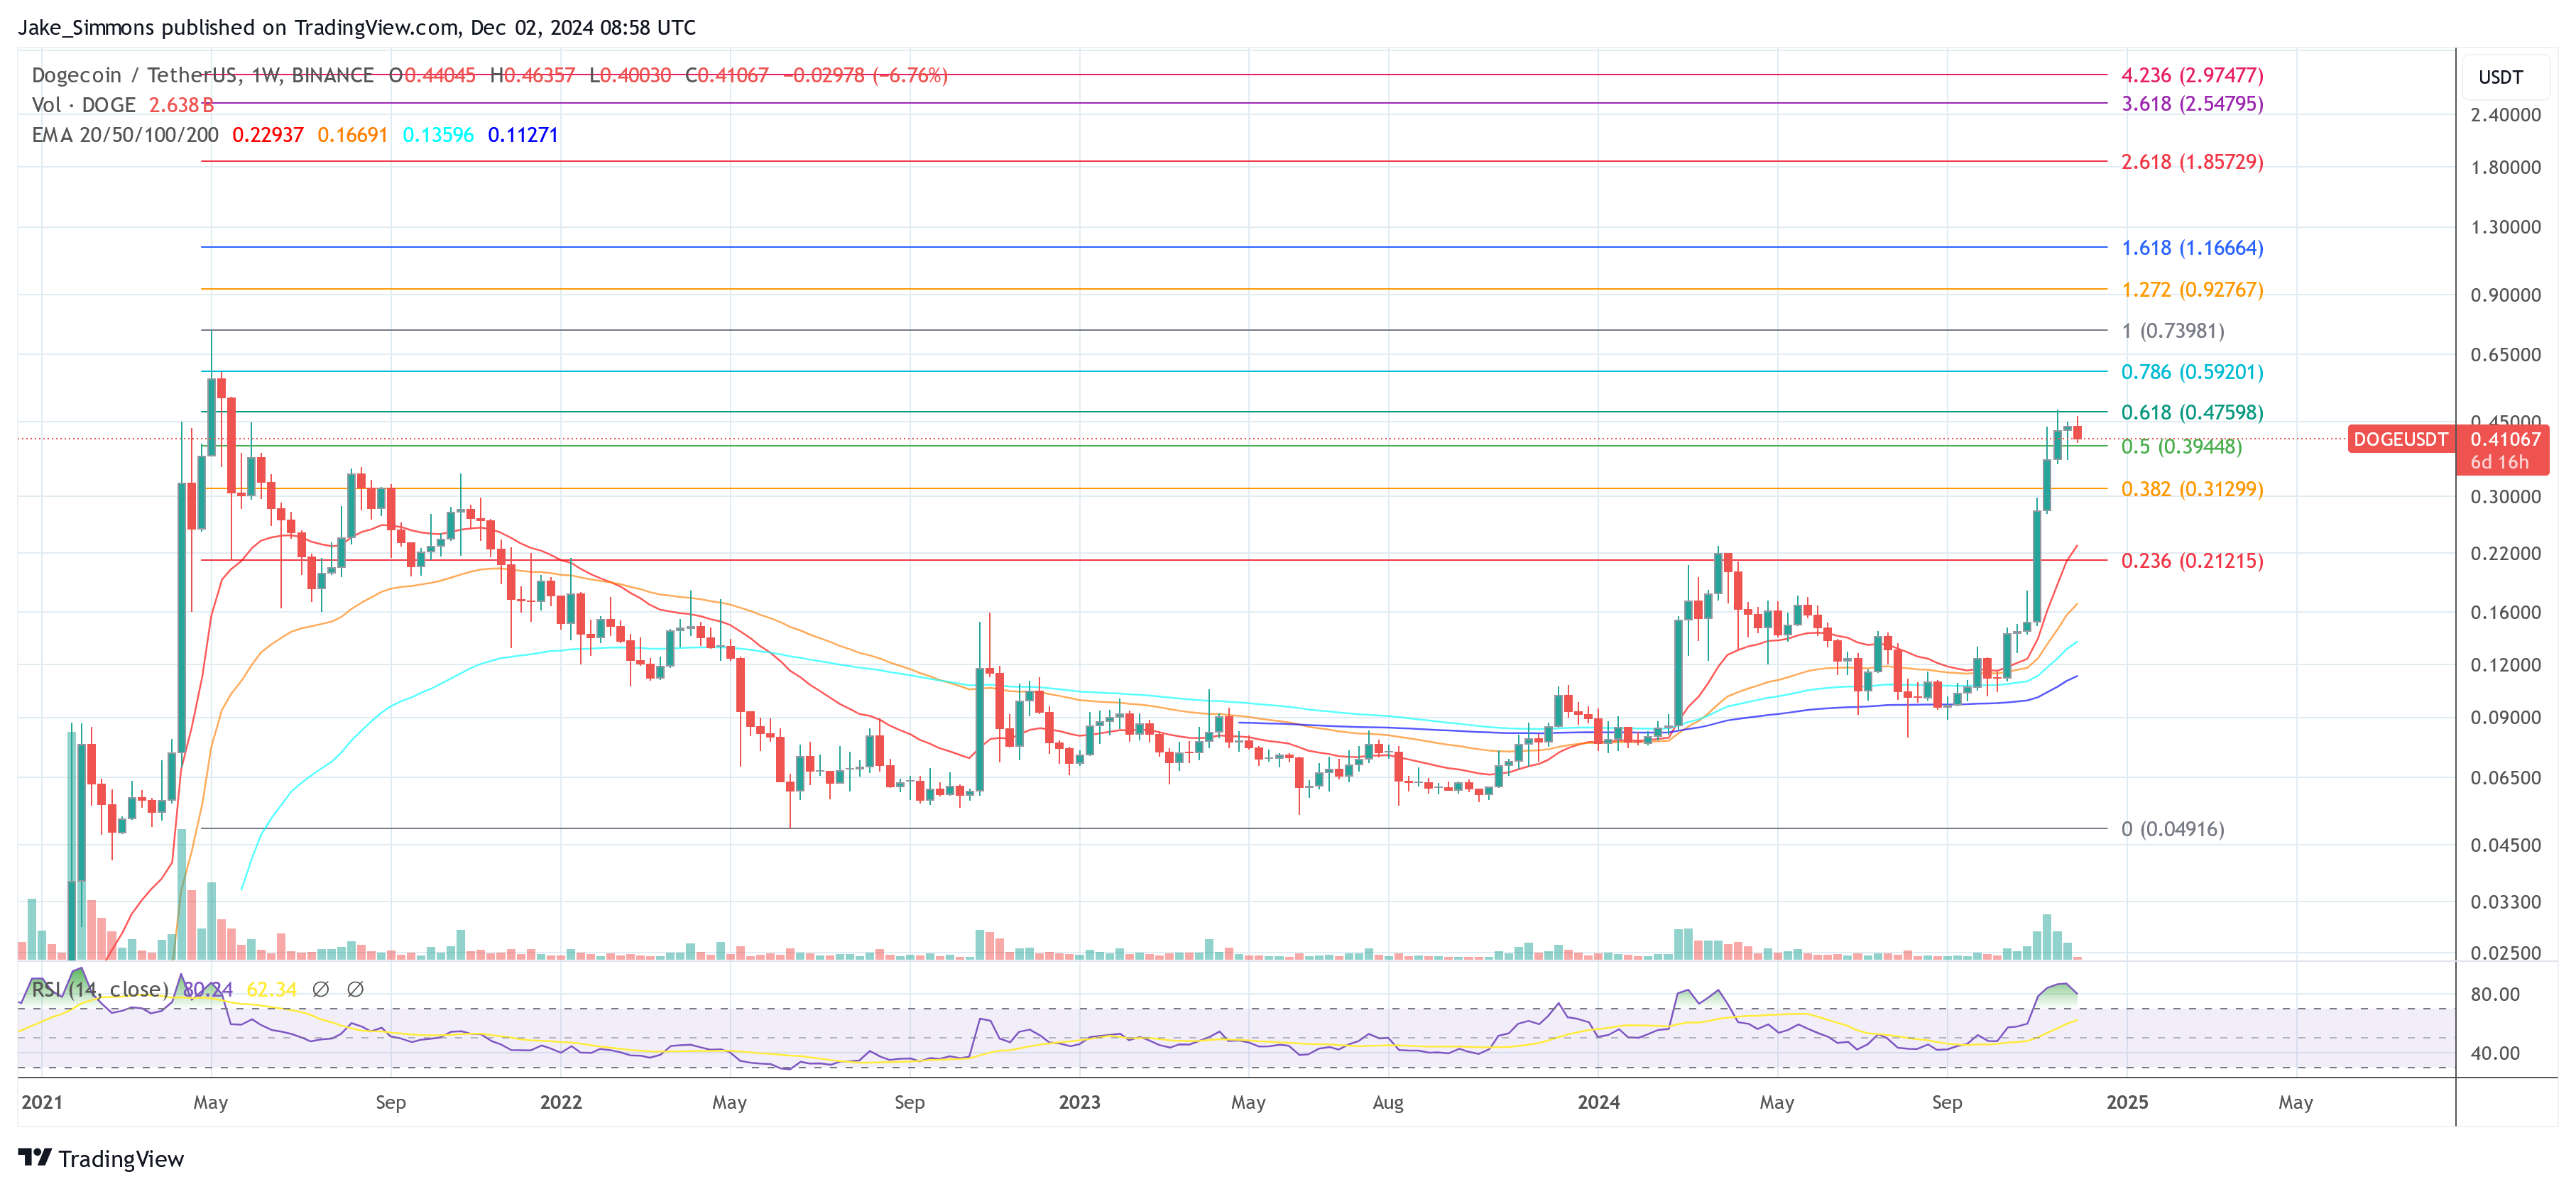
The Dogecoin price action in the past 48 hours has been highlighted by a consolidation below the $0.45 price level. Interestingly, technical analysis shows that this consolidation is part of a bullish pennant that has been in formation since early November. Particularly, Dogecoin is currently in the flag phase of the bullish pennant formation, which is known to be the consoldation phase before the next leg up.
According to Crypto analyst KrissPax, this Dogecoin price movement is creating a “great springboard for the next big Doge pump.”
Dogecoin’s Sideways Trading Forms The Foundation For Growth
The Dogecoin price has been trading within range since it reached the $0.47 mark on November 23. This range has been highlighted by a key support level around $0.37 that prevented further declines on November 26. Crypto analyst KrissPax noted that this consolidation has held above support, which he interprets as constructive rather than negative.
Related Reading
In terms of a Dogecoin price outlook, KrissPax highlighted that the consolidation has led to the formation of a bullish pennant, which is set to be broken at the upper trendline. For his price prediction, he highlighted the $1.3 level as the prime target after the breakout.
The bullish pennant typically forms after a strong upward rally followed by consolidation, with price movements resembling a triangle. A breakout from this pattern often signals the continuation of the prior trend, making $1.30 a plausible target if the pattern holds true.
The current Dogecoin sideways trading is holding support and making for a great springboard for the next big Doge pump. This bullish pennant targets a big move up to $1.30!
Chart: Trader Tardigrade pic.twitter.com/cho062TLNU
— KrissPax (@krisspax) December 3, 2024
What Could Drive The Dogecoin Price To $1.3?
At the time of writing, Dogecoin is trading at $0.419, according to CoinMarketCap, reflecting an impressive surge of about 178% over the past 30 days. Should Dogecoin manage to sustain its upward trajectory and achieve a breakout toward the $1.30 target, it would represent an additional 210% increase from its current price, as well as a decisive move beyond its all-time high of $0.7316.
Related Reading
However, the path to $1.30 depends on other market factors that extend beyond the bullish pennant pattern currently forming in Dogecoin’s price chart. Nonetheless, current market factors suggest that the meme coin’s price is still in a good position to keep growing. A key contributor to this outlook is the recent surge in activity on the Dogecoin blockchain, particularly among large holders.
According to data from blockchain analytics firm Santiment, there has been a significant whale accumulation over the past several days. According to Santiment’s data, Dogecoin whales collectively acquired an additional 160 million $DOGE tokens within just 48 hours. This increase in demand could help sustain Dogecoin’s price rally and support its bid to surpass previous highs.
Featured image created with Dall.E, chart from Tradingview.com
Source link

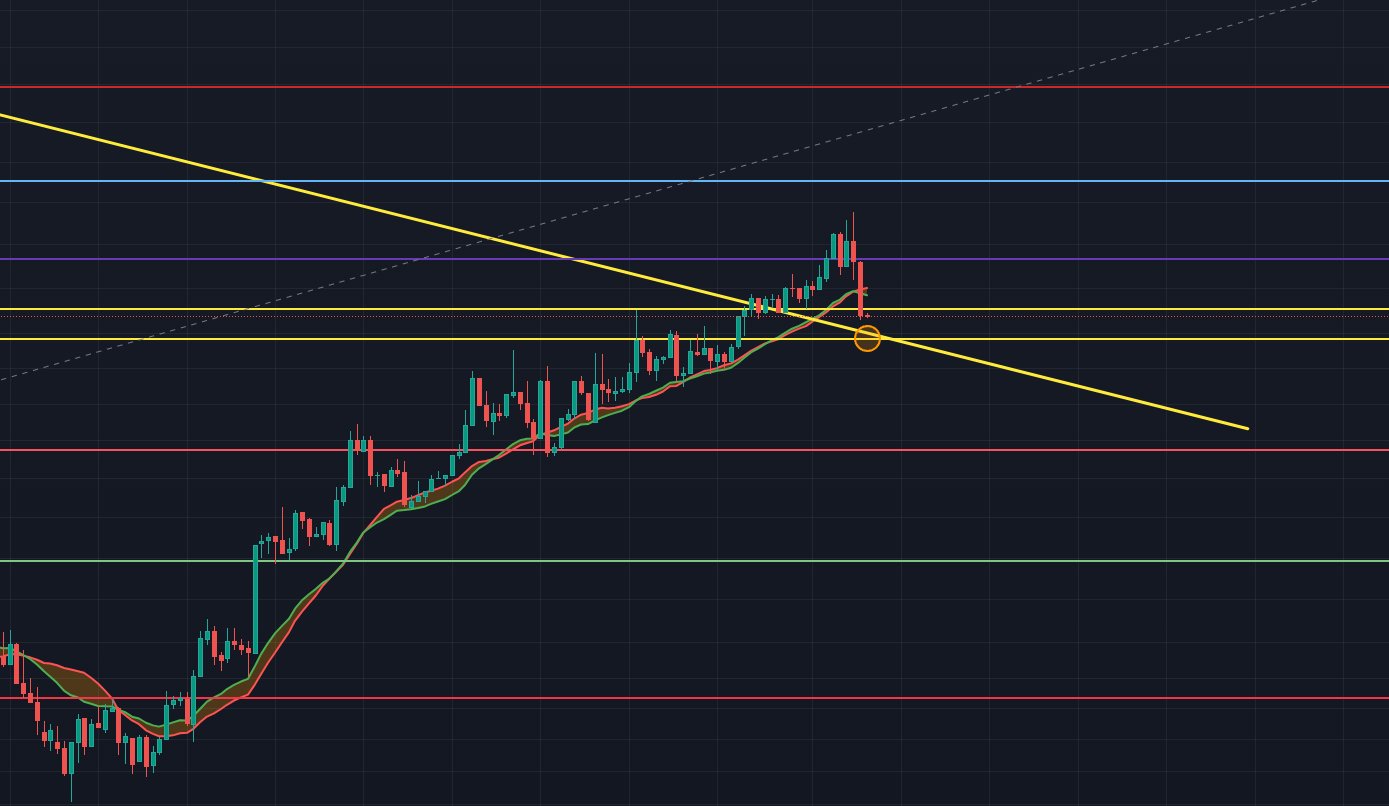
After staging a massive rally, the Dogecoin price is currently in a consolidation phase. And this is also reflected in the technical indicators. Crypto analyst Kevin (@Kev_Capital_TA) is warning of a potential sell indicator. In his latest update on X, Kevin shared a weekly DOGE/USDT chart and outlined technical signs that traders should monitor closely.
Dogecoin Price Analysis
Kevin highlighted that Dogecoin is “printing a sell signal on the weekly time frame with the red dot appearing,” cautioning that this signal requires confirmation over the next week to solidify its validity. He identified a convergence of three strong technical indicators, including a declining Moving Average Convergence Divergence (MACD) and a Stochastic Relative Strength Index (Stoch RSI) that has “topped out waiting for a bear cross.”
These indicators collectively suggest that a potential downside may be imminent. However, Kevin balanced this with the observation that “price action still looks bullish and money flow is also bullish,” indicating that these factors currently outweigh the bearish signals.
Despite the long-term sell signals, Kevin remains open to the possibility of continued bullish momentum in the short term. He noted that Dogecoin has “close[d] its highest monthly candle body close of all time,” marking a significant milestone while acknowledging that “downside is still a risk.”
Related Reading
Looking ahead, Kevin pointed to the importance of a key resistance level, stating, “Until we break $0.60 cents cleanly then there’s nothing to really be excited about,” in reference to his weekly chart that includes Fibonacci price levels extending to $1.
Moreover, Kevin is closely looking at macroeconomic factors that could influence Dogecoin’s performance. He indicated that an “altcoin season” could serve as a catalyst for DOGE’s continued strength, contingent upon Bitcoin’s dominance falling below the 55% level. “If BTC Dominance breaks the 55% level cleanly you will get your #ALTSEASON folks,” he explained.
Additionally, Kevin shared his strategy regarding long-term moving averages, stating, “When these two long term moving averages cross on Dogecoin I will be selling a large piece of my bag. They have called the top successfully on DOGE multiple times. They are moving up fast!”
Related Reading
Notably, the crypto analyst is referring to the Pi Cycle Top Indicator for Dogecoin, a tool traditionally used for Bitcoin (BTC). This indicator relies on the crossing of two moving averages—the 111-day and the 350-day multiplied by two—to signal potential market peaks.
Last week, Kevin revealed, “One of my secret indicators for Dogecoin that is traditionally only supposed to work for BTC is the Pi Cycle tops indicator. It has accurately called every DOGE cycle top and bottom over each of its cycles. When the two moving averages cross along with Monthly RSI being at a certain level that’s when I plan on taking significant portions out of the market.”
At press time, DOGE traded at $0.41.
Featured image created with DALL.E, chart from TradingView.com
Source link

Solana L2 Sonic includes TikTok users in airdrop

5 Tokens Ready For A 20X After Solana ETF Approval
Solana beats Ethereum in a key metric 3 months in a row

SCENE’s 2024 Person of the Year: Iggy Azalea

BTC Risks Falling To $20K If This Happens

Most Layer 2 solutions are still struggling with scalability

Here’s why Stellar Price Could Go Parabolic Soon

Perp-Focused HyperLiquid Experiences Record $60M in USDC Net Outflows

Experts say these 3 altcoins will rally 3,000% soon, and XRP isn’t one of them

Robert Kiyosaki Hints At Economic Depression Ahead, What It Means For BTC?

BNB Steadies Above Support: Will Bullish Momentum Return?

Metaplanet makes largest Bitcoin bet, acquires nearly 620 BTC

Tron’s Justin Sun Offloads 50% ETH Holdings, Ethereum Price Crash Imminent?

Investors bet on this $0.0013 token destined to leave Cardano and Shiba Inu behind

End of Altcoin Season? Glassnode Co-Founders Warn Alts in Danger of Lagging Behind After Last Week’s Correction
182267361726451435
Why Did Trump Change His Mind on Bitcoin?

Top Crypto News Headlines of The Week

New U.S. president must bring clarity to crypto regulation, analyst says

Will XRP Price Defend $0.5 Support If SEC Decides to Appeal?

Bitcoin Open-Source Development Takes The Stage In Nashville

Ethereum, Solana touch key levels as Bitcoin spikes

Bitcoin 20% Surge In 3 Weeks Teases Record-Breaking Potential

Ethereum Crash A Buying Opportunity? This Whale Thinks So

Shiba Inu Price Slips 4% as 3500% Burn Rate Surge Fails to Halt Correction

Washington financial watchdog warns of scam involving fake crypto ‘professors’

‘Hamster Kombat’ Airdrop Delayed as Pre-Market Trading for Telegram Game Expands

Citigroup Executive Steps Down To Explore Crypto
Mostbet Güvenilir Mi – Casino Bonus 2024

NoOnes Bitcoin Philosophy: Everyone Eats

 3 months ago
182267361726451435

 Donald Trump5 months ago
Why Did Trump Change His Mind on Bitcoin?
 24/7 Cryptocurrency News4 months ago
Top Crypto News Headlines of The Week
 News4 months ago
New U.S. president must bring clarity to crypto regulation, analyst says
 Price analysis4 months ago
Will XRP Price Defend $0.5 Support If SEC Decides to Appeal?
 Opinion5 months ago
Bitcoin Open-Source Development Takes The Stage In Nashville
 Bitcoin5 months ago
Ethereum, Solana touch key levels as Bitcoin spikes
 Bitcoin5 months ago
Bitcoin 20% Surge In 3 Weeks Teases Record-Breaking Potential

✓ Share: