
doge
How Low Can Dogecoin Go Before Rallying Again?

Dogecoin (DOGE) has recently experienced a staggering rally. Over the span of eight days, DOGE surged nearly 200%, reaching a local peak at $0.4385 on Tuesday. This explosive growth propelled the daily Relative Strength Index (RSI) to almost 93, signaling strongly overbought conditions.
Since then, the Dogecoin price corrected by 19%, trading at $0.37 as of press time. However, according to crypto analyst Kevin (@Kev_Capital_TA), who has gained significant attention on X for his Dogecoin price analyses, the correction phase may not be over yet. In a series of updates, Kevin addresses how low Dogecoin can go before resuming its upward trajectory.
How Low Can Dogecoin Go?
“My first price target and a level we will want to hold for Dogecoin is the $0.30-0.26 range, which is the golden pocket retrace levels,” Kevin stated. “That’s a 30-40% correction from the local top, which in a bull market is a perfect size correction.”
Related Reading
Kevin further explained the significance of RSI levels in predicting market movements. “A healthy 1-3 week correction/consolidation to cool off indicators would be the most beneficial thing that can happen to Dogecoin. Happened multiple times on the way up in 2020-2021,” he noted. “My opinion still remains this occurs soon based off the technical data I am looking at.”
Drawing parallels to the previous bull market, he added: “Back in the 2020-2021 bull market for Dogecoin, it hit a 90+ on daily RSI three times, each time marking a local top or consolidation period before the next leg up. We just hit 90+ on the daily RSI for the first time, signaling that we potentially have 1-2 more legs up remaining in this bull market before we find the macro top. PS: The second and third legs were both bigger than the first leg.”
On the lower time frames, the Dogecoin price action formed a symmetrical triangle, a chart pattern often associated with periods of consolidation that precede significant price movements. Kevin observed: “Tracking this weird Dogecoin symmetrical triangle. Honestly a 50/50 which way this breaks. I still favor the correction due to daily RSI being 90+.”
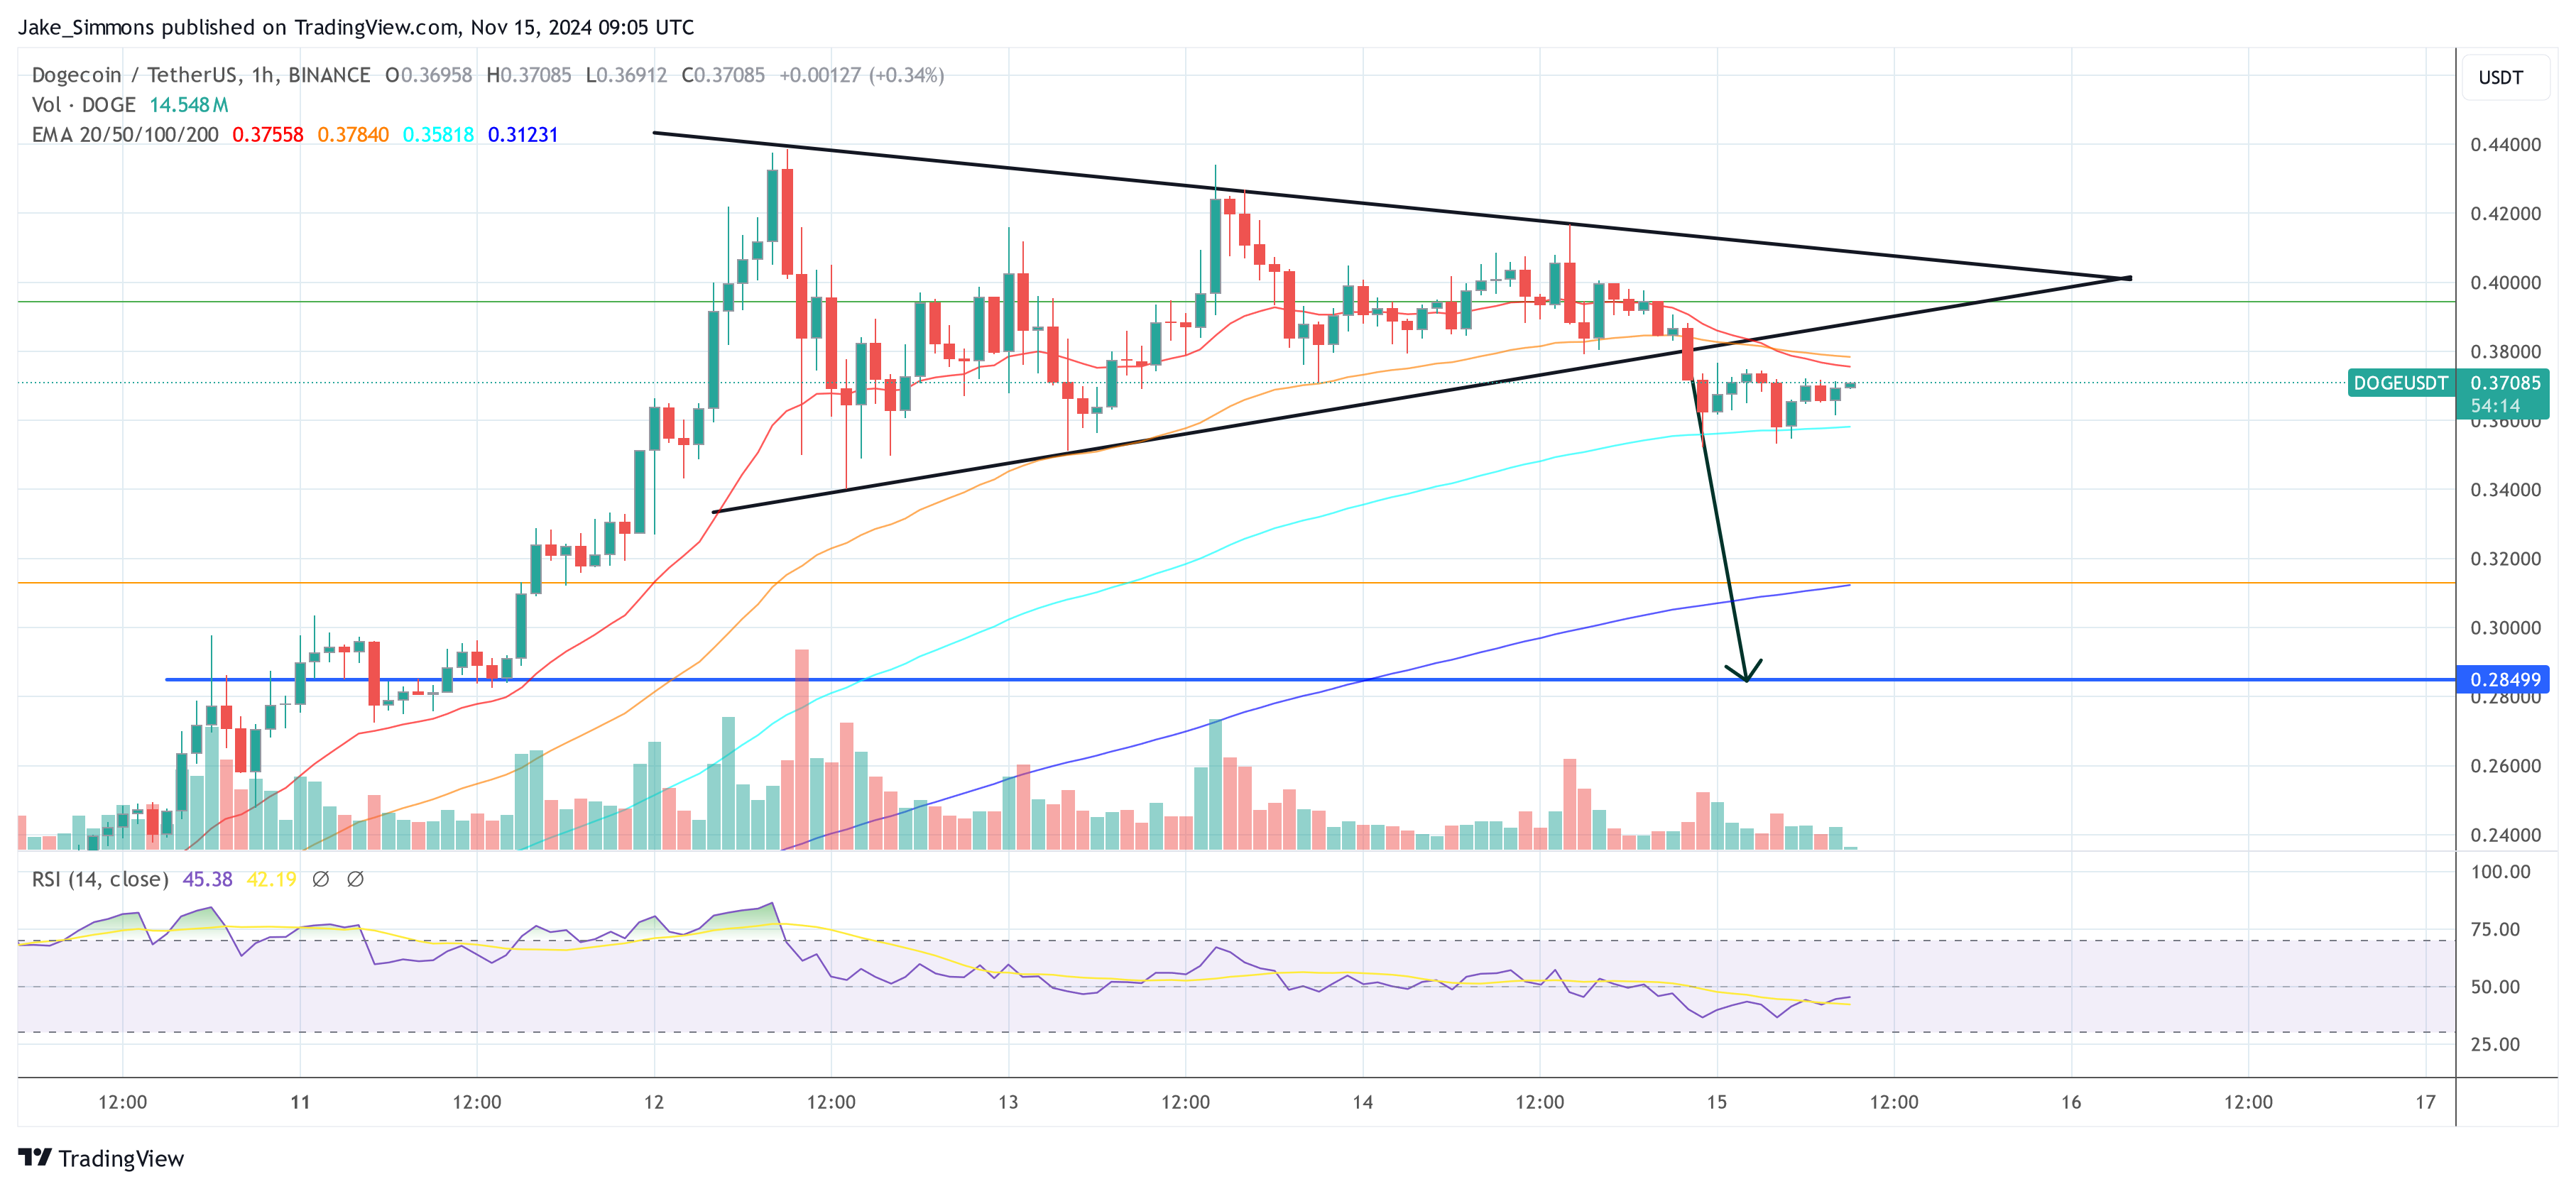
The symmetrical triangle can serve as either a continuation or a reversal pattern, depending on market conditions. For the Dogecoin price, the breakdown from the triangle aligns with Kevin’s expectation of a correction due to overbought RSI levels.
Related Reading
To estimate the potential magnitude of the price drop following the breakdown from the symmetrical triangle, traders measure the height of the triangle’s base—the widest part of the formation. This measurement is then projected downward from the point of breakdown, providing a target for the price movement.
Applying this method to Dogecoin suggests a correction towards the $0.28 price level, which aligns closely with Kevin’s analysis targeting the $0.30-$0.26 range. “Looks like the correction I have been calling for the last couple of days is beginning on Dogecoin,” Kevin confirmed after observing the market movement. “Can’t go straight up, folks. Dips are healthy and reset the indicators so we can go higher. Hopefully nobody gets mad at me anymore for delivering the truth.”
As of press time, Dogecoin is trading at approximately $0.37, having retraced about 19% from its local top. The price appears to have found temporary support at $0.35, but with the daily RSI only resetting to 80—still in overbought territory—a continuation of the correction cannot be ruled out.
“A healthy 1-3 week correction/consolidation to cool off indicators would be the most beneficial thing that can happen to Dogecoin,” Kevin reiterated. “Happened multiple times on the way up in 2020-2021. My opinion still remains this occurs soon based off the technical data I am looking at.”
Featured image created with DALL.E, chart from TradingView.com
Source link


Dogecoin started a fresh decline from the $0.1880 zone against the US Dollar. DOGE is declining and might test the $0.150 support zone.
- DOGE price started a fresh decline below the $0.1850 and $0.1750 levels.
- The price is trading below the $0.1750 level and the 100-hourly simple moving average.
- There is a key bearish trend line forming with resistance at $0.170 on the hourly chart of the DOGE/USD pair (data source from Kraken).
- The price could extend losses if it breaks the $0.1620 support zone.
Dogecoin Price Dips Further
Dogecoin price started a fresh decline after it failed to clear $0.200, like Bitcoin and Ethereum. DOGE dipped below the $0.1880 and $0.1820 support levels.
The bears were able to push the price below the $0.1750 support level. It even traded close to the $0.1620 support. A low was formed at $0.1628 and the price is now consolidating losses below the 23.6% Fib retracement level of the downward move from the $0.2057 swing high to the $0.1628 low.
Dogecoin price is now trading below the $0.1750 level and the 100-hourly simple moving average. Immediate resistance on the upside is near the $0.170 level. There is also a key bearish trend line forming with resistance at $0.170 on the hourly chart of the DOGE/USD pair.
The first major resistance for the bulls could be near the $0.1730 level. The next major resistance is near the $0.1770 level. A close above the $0.1770 resistance might send the price toward the $0.1850 resistance.

The 50% Fib retracement level of the downward move from the $0.2057 swing high to the $0.1628 low is also near the $0.1850 zone. Any more gains might send the price toward the $0.1880 level. The next major stop for the bulls might be $0.1950.
More Losses In DOGE?
If DOGE’s price fails to climb above the $0.1770 level, it could start another decline. Initial support on the downside is near the $0.1635 level. The next major support is near the $0.1620 level.
The main support sits at $0.1550. If there is a downside break below the $0.1550 support, the price could decline further. In the stated case, the price might decline toward the $0.1320 level or even $0.120 in the near term.
Technical Indicators
Hourly MACD – The MACD for DOGE/USD is now gaining momentum in the bearish zone.
Hourly RSI (Relative Strength Index) – The RSI for DOGE/USD is now below the 50 level.
Major Support Levels – $0.1620 and $0.1550.
Major Resistance Levels – $0.1720 and $0.1770.
Source link
Reason to trust
![]()
Strict editorial policy that focuses on accuracy, relevance, and impartiality
Created by industry experts and meticulously reviewed
The highest standards in reporting and publishing
Strict editorial policy that focuses on accuracy, relevance, and impartiality
Morbi pretium leo et nisl aliquam mollis. Quisque arcu lorem, ultricies quis pellentesque nec, ullamcorper eu odio.
Crypto analyst KrissPax has revealed that the Dogecoin price is mirroring a pattern from a previous bull run. Based on this, he raised the possibility of a price surge to $4 for the foremost meme coin.
Dogecoin Price Mirroring 2017 Pattern As It Eyes Rally To $4
In an X post, KrissPax stated that the Dogecoin price continues to trade in a similar pattern to the 2017 bull cycle. He added that if the second large breakout of this cycle happens, DOGE could surge well over its current all-time high (ATH) of $0.73. His accompanying chart showed that the foremost meme coin could reach $4 when this price breakout occurs.
Related Reading
Crypto analyst Master Kenobi also recently mentioned that the Dogecoin price is mirroring a bullish pattern from the 2017 bull run. Like KrissPax, he also alluded to DOGE witnessing a second parabolic phase of its bull run, just like in 2017. However, he gave a more conservative prediction, predicting that DOGE could rally to $1.1 by June later this year.
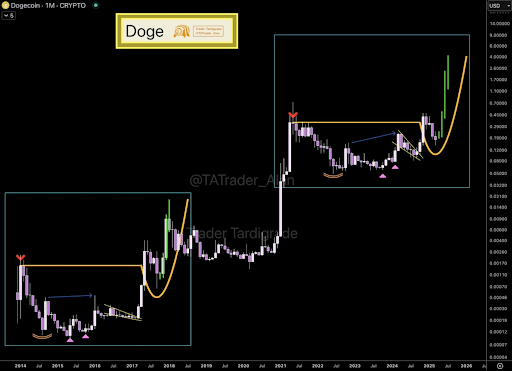
The Dogecoin price already looks set for the second phase of its bull run, seeing as the foremost meme coin looks bottomed. Crypto analysts like Trader Tardigrade also suggested that DOGE has bottomed, having dropped to as low as $0.14. Now, the foremost meme coin could be targeting new highs, especially with the Bitcoin price also in rebound mode.
Crypto analyst Ali Martinez stated that the Dogecoin price is breaking out of a triangle, which can result in a 16% upswing. The target is a rally to $0.183, which could pave the way for a further rally to the psychological $0.2 price level. Dogecoin whales are also actively accumulating in anticipation of this price surge, as they bought over 120 million DOGE last week.
A Breakout Has Yet To Occur
While analyzing DOGE’s daily chart, Trader Tardigrade warned that the Dogecoin price hasn’t broken out just yet. His accompanying chart showed that the foremost meme coin needs to break above $0.185 to confirm the breakout. The analyst also noted that DOGE is struggling to break a descending trendline, as it continues to stay below this resistance after several attempts.
Related Reading
However, the analyst provided some positives for the Dogecoin price, stating that the RSI has shown a breakout, indicating that DOGE has gained significant momentum recently. He added that a strong uptrend could occur if this momentum continues to build. The accompanying chart showed that the meme coin could record a parabolic rally to as high as $0.5 if it breaks above $0.185.
At the time of writing, the Dogecoin price is trading at around $0.18, up over 4% in the last 24 hours, according to data from CoinMarketCap.
Featured image from iStock, chart from Tradingview.com
Source link
Reason to trust
![]()
Strict editorial policy that focuses on accuracy, relevance, and impartiality
Created by industry experts and meticulously reviewed
The highest standards in reporting and publishing
Strict editorial policy that focuses on accuracy, relevance, and impartiality
Morbi pretium leo et nisl aliquam mollis. Quisque arcu lorem, ultricies quis pellentesque nec, ullamcorper eu odio.
Crypto analyst CobraVanguard has revealed the next price target for Dogecoin as an ascending triangle forms for the foremost meme coin. A rally to this price target could pave the way for the new highs, especially with the crypto market looking to be in rebound mode.
Next Target For Dogecoin As Ascending Triangle Forms
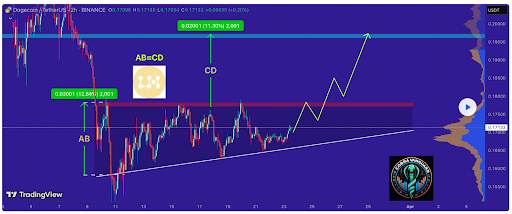
In a TradingView post, CobraVanguard set $0.197 as the next target for the Dogecoin price with an ascending triangle forming. He noted that this ascending triangle indicates a potential price increase. The analyst added that it is anticipated that the price could rise, aligning with the projected price movement of AB=CD.
Related Reading
Meanwhile, CobraVanguard warned that it is crucial to wait for the triangle to break before taking any action. His accompanying chart showed that Dogecoin needs to break above $0.177 to confirm a break above the ascending triangle. A break above that target would then lead to a rally to the $0.197 target.
Dogecoin already looks to be in rebound mode at the moment, alongside Bitcoin, which is nearing the $90,000 mark again. The foremost meme coin is nearing the $0.177 target for a break above the ascending triangle. As crypto analyst Kevin Capital suggested, DOGE will likely rally as long as BTC is in bullish territory.
Crypto traders are also betting on a Dogecoin rally to the upside. Crypto analyst Ali Martinez revealed that 76.26% of traders with open DOGE positions on Binance futures are leaning bullish. This is particularly bullish because Binance traders have a good track record of being right most of the time. In another X post, Martinez revealed that whales bought over 120 million DOGE last week, which is also bullish for the foremost meme coin.
DOGE’s Market Structure Has Shifted
In an X post, crypto analyst Trader Tardigrade revealed that Dogecoin’s market structure has shifted. This came as he noted that Dogecoin is recovering from an ascending triangle, forming higher highs and higher lows from lower highs and lower lows.
Related Reading
Based on this, the analyst affirmed that Dogecoin had shifted the market structure from a downtrend to an uptrend on the hourly chart since it just formed the second higher high. His accompanying chart showed that DOGE is eyeing a rally to $0.177 as it continues to form higher highs.
Martinez raised the possibility of the Dogecoin price rallying to as high as $4 or even $20 in the long term. He stated that if DOGE holds above the $0.16 support at the lower boundary of an ascending channel, history suggests that it could rebound toward the mid-range at $4 or upper range at around $20.
At the time of writing, the Dogecoin price is trading at around $0.174, up over 3% in the last 24 hours, according to data from CoinMarketCap.
Featured image from Pexels, chart from Tradingview.com
Source link

Dogecoin (DOGE) Bulls In Trouble—Can They Prevent a Drop Below $0.15?

California introduces ’Bitcoin rights’ in amended digital assets bill

MELANIA Insider Hayden Davis Selling Millions of Dollars Worth of Memecoin Amid 95% Drop: On-Chain Data

Toulouse starts to accept crypto for public transport

Bitcoin, Crypto Prices Slide as Trade Tensions, Inflation Risks Rattle Markets

Will BlackRock Investors Stay Bullish?

Bitcoin Could Appear on 25% of S&P 500 Balance Sheets by 2030, Analyst Says

Centralization and the dark side of asset tokenization — MEXC exec

Bitcoin Support Thins Below $78,000 As Cost Basis Clusters Shift Toward $95,000

Cryptocurrencies to watch this week: Solana, Cronos, DOT

EU Regulator Pushes for New Capital Rules for European Insurers Holding Crypto Assets

Japan Set To Classify Cryptocurrencies As Financial Products, Here’s All

This Week in Crypto Games: ‘Off the Grid’ Token, GameStop Goes Bitcoin, SEC Clears Immutable

Binance debuts centralized exchange to decentralized exchange trades

Why Is the Crypto Market Down Today? Bitcoin Drops to $82K as Traders Flee Risk Assets Amid Macro Worries


 24/7 Cryptocurrency News5 months ago
Arthur Hayes, Murad’s Prediction For Meme Coins, AI & DeFi Coins For 2025

 Bitcoin2 months ago
Expert Sees Bitcoin Dipping To $50K While Bullish Signs Persist

 24/7 Cryptocurrency News3 months ago
Aptos Leverages Chainlink To Enhance Scalability and Data Access

 Bitcoin5 months ago
Bitcoin Could Rally to $80,000 on the Eve of US Elections

 Altcoins2 months ago
Sonic Now ‘Golden Standard’ of Layer-2s After Scaling Transactions to 16,000+ per Second, Says Andre Cronje

 Bitcoin5 months ago
Institutional Investors Go All In on Crypto as 57% Plan to Boost Allocations as Bull Run Heats Up, Sygnum Survey Reveals

 Opinion5 months ago
Crypto’s Big Trump Gamble Is Risky

 Price analysis5 months ago
Ripple-SEC Case Ends, But These 3 Rivals Could Jump 500x
