Relative Strength Index
SUI Price Stability At $3.5 Signals Room For More Growth, $4 Mark Imminent?
Published
4 months agoon
By
admin
Despite market fluctuations, SUI has demonstrated remarkable stability, holding steady above the critical $3.5 support level. This steady performance reflects underlying bullish momentum, as buyers continue to defend this key zone, boosting confidence in the asset’s upward potential. With strong support intact, SUI appears well-positioned to target higher resistance levels, sparking optimism for further gains.
This analysis aims to explore SUI’s ability to stay above the $3.5 level and assess its implications for future price movements. By examining key technical indicators and resistance zones, this piece seeks to provide insights into whether SUI can sustain its bullish strength or if market pressures could trigger a shift in its trajectory.
What SUI Stability Above $3.5 Means For Bulls
SUI is showcasing renewed bullish strength as it maintains a firm position above the critical $3.5 support level. This stability highlights growing buying interest and market confidence, paving the way for a possible move toward the $4 mark. Its ability to hold above this key level and the 4-hour Simple Moving Average (SMA) reinforces the asset’s upward momentum, and positions SUI for further gains if positive sentiment persists.
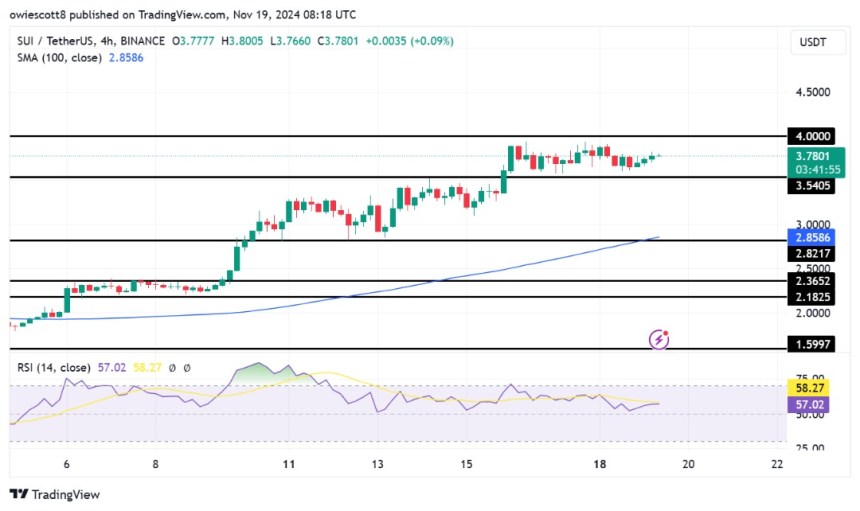
An analysis of the 4-hour Relative Strength Index (RSI) analysis shows a rebound from 51%, rising toward and above the 60% level, indicating a renewed optimistic outlook. If the RSI continues to rise above 60%, it would confirm the positive trend, boosting the potential for more price growth.
Additionally, SUI shows significant upward movement on the daily chart, marked by the formation of a bullish candlestick as it moves toward the $4 mark. Trading above the crucial 100-day SMA reinforces the positive trend, indicating sustained strength. As SUI continues to climb, it bolsters market confidence, setting the stage for growth. With upside pressure brewing, the next key target to watch out for is the $4 resistance level, which could determine whether the bullish move extends.
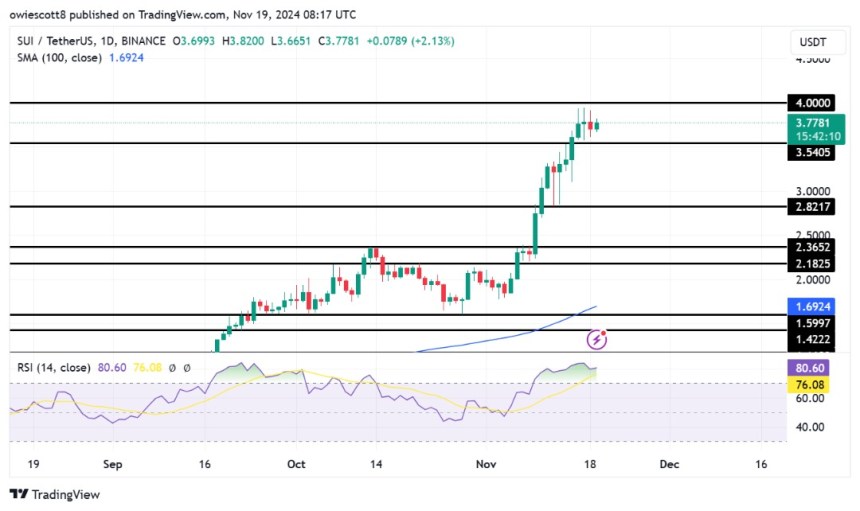
The daily chart’s RSI has increased to 80%, signaling strong positive sentiment with sustained buying pressure. While the asset remains in an overbought territory, it shows no signs of weakening. If the momentum continues, further price gains are possible, though one should be cautious, as prolonged overbought conditions could lead to a correction if buying pressure decreases.
Potential Scenarios: Upside Targets And Risks To Watch
SUI’s current stability above the $3.5 support level indicates potential for continued upside. Should buying pressure persist, the next key target lies at $4, where bullish interest could be triggered, leading to new price highs.
However, if resistance at $4 proves challenging to break through, consolidation or a minor decline may occur, possibly causing the price to retreat toward the $3.5 support level. A break below this level could result in additional losses, with the next key support target being around $2.8, followed by other support areas below.
Source link
You may like


Trump’s Crypto Dealings Are Making Regulation ‘More Complicated’: House Financial Services Chair


Pontus-X taps Oasis for private, cross-border data sharing in E.U.


Elon Musk, Dogecoin Proponent and U.S. Agency Figurehead, Says ‘No DOGE in D.O.G.E.’


Crypto Investor’s Brave Yet Hilarious Prediction Speculates If XRP Price Will Hit $3,000 This Cycle


Dogecoin (DOGE) Bulls In Trouble—Can They Prevent a Drop Below $0.15?


California introduces ’Bitcoin rights’ in amended digital assets bill
ETH
Ethereum Bulls Disappointed As Recovery Attempt Fails At $2,160 Resistance
Published
2 days agoon
March 29, 2025By
admin
Reason to trust

Strict editorial policy that focuses on accuracy, relevance, and impartiality
Created by industry experts and meticulously reviewed
The highest standards in reporting and publishing
Strict editorial policy that focuses on accuracy, relevance, and impartiality
Morbi pretium leo et nisl aliquam mollis. Quisque arcu lorem, ultricies quis pellentesque nec, ullamcorper eu odio.
Ethereum’s attempt to regain bullish momentum has hit a roadblock, as the price failed to break through the crucial $2,160 resistance level. After showing signs of recovery, ETH faced strong selling pressure at this key level, preventing a sustained breakout and disappointing bullish traders who were hoping for further upside.
Its inability to push past this resistance suggests that bears are still in control, keeping Ethereum’s price under pressure. With the momentum fading and the market sentiment turning cautious, traders are now closely watching key support zones to determine the next move.
Bearish Pressure Mounts: What’s Next For Ethereum?
Ethereum is facing increasing downside pressure as its latest recovery attempt was rejected at the $2,160 resistance level. The failed breakout has reinforced bearish sentiment, with key technical indicators signaling weakness. If buyers fail to step in, ETH could be at risk of deeper declines in the near term.
Related Reading
One of the major warning signs is weak volume during the recovery attempt. A strong breakout typically requires significant buying interest, but Ethereum’s rally lacked momentum, making it easier for sellers to regain control. This lack of conviction from bulls suggests that the upside move was not sustainable, allowing bears to push prices lower.
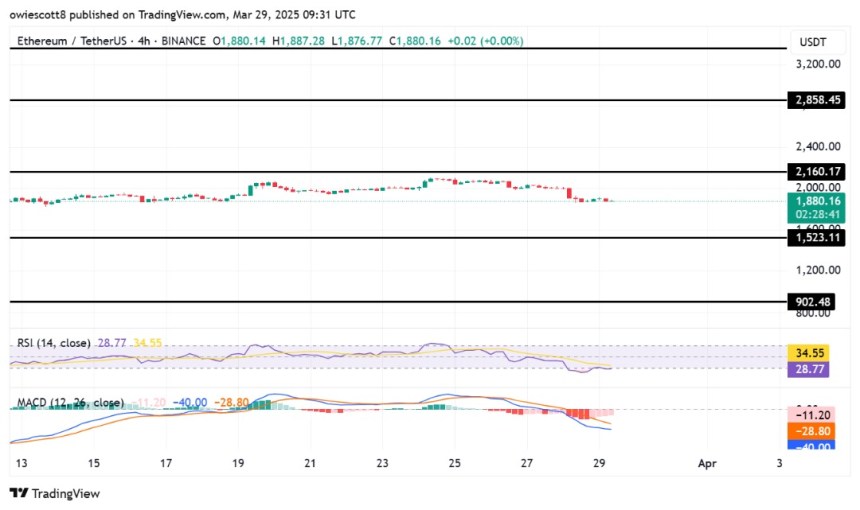
Additionally, the Relative Strength Index (RSI) has broken down, moving below key thresholds that indicate weakening bullish strength. The current declining RSI shows that buying pressure is fading, making it difficult for Ethereum to build upward momentum. If the RSI continues trending downward, it could further confirm a prolonged bearish phase.
The Moving Average Convergence Divergence (MACD) has also turned negative, with a breakdown below the signal line and a widening gap between the MACD and its moving average. This crossover indicates that bearish momentum is accelerating, reducing the chances of an immediate recovery. When combined with other bearish signals, the MACD breakdown further supports the case for a continued downside.
Looking ahead, ETH may retest key support zones. However, a strong bounce from lower levels could offer bulls another chance to regain lost ground. For now, the charts suggest that Ethereum remains vulnerable to further declines.
Support Levels To Watch: Can Bulls Prevent Further Decline?
With attention now turning to key support levels, the first major support to watch is around $1,523, a level that previously acted as a short-term demand zone. If Ethereum holds above this area, it might provide bulls with a foundation for another rebound attempt. However, a break below this level could signal growing bearish dominance, increasing the risk of deeper losses.
Related Reading
Below $1,523, the next key support lies at $902, aligning with previous price reactions and acting as a psychological level for traders. A failure to hold here may accelerate selling pressure, pushing ETH toward other support below.
Featured image from iStock, chart from Tradingview.com
Source link
Altcoin
XRP Price Face Major Resistance At $2.9, Why This Analyst Believes $20 Is Still Possible
Published
3 weeks agoon
March 11, 2025By
admin
Reason to trust

Strict editorial policy that focuses on accuracy, relevance, and impartiality
Created by industry experts and meticulously reviewed
The highest standards in reporting and publishing
Strict editorial policy that focuses on accuracy, relevance, and impartiality
Morbi pretium leo et nisl aliquam mollis. Quisque arcu lorem, ultricies quis pellentesque nec, ullamcorper eu odio.
Crypto analyst ElmoX has asserted that the XRP price is still bullish despite the recent crypto market crash. His analysis revealed that XRP is set to face major resistance at $2.9, although he is confident that the crypto will eventually break this resistance and rally to as high as $20.
XRP Price Faces Resistance At $2.9 But Could Still Rally To $20
In a TradingView post, ElmoX outlined two scenarios for the XRP price as it eyes a rally to $20, although he noted that the crypto will retest the major resistance at around $2.92 either way, on its way to a new all-time high (ATH). For the first scenario, the analyst stated that XRP would break this resistance and then skyrocket to $20.
Related Reading
Meanwhile, in the second scenario, ElmoX stated that the XRP price could face another rejection, sending it below the $1.5 level before it witnesses a bullish reversal and rallies to a new ATH. The analyst revealed that he is betting on this second scenario since there is usually a swift crash before an impulsive move to the upside.
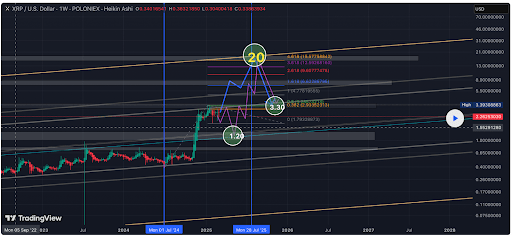
ElmoX remarked that the XRP price has barely corrected, which is also why he believes there could still be a massive crash before a rally to a new ATH. Meanwhile, the analyst didn’t provide an exact timing for the potential price correction and subsequent rally to a new ATH and the $20 price target.
Instead, he simply told market participants to be patient. He further warned that the XRP price might sit in price discovery until at least mid-July. His accompanying chart showed that XRP will first drop to as low as $1.20 before it witnesses an impulsive move to as high as $20.
The Altcoin Records A Bullish Close
In an X post, crypto analyst CasiTrades noted that although the XRP price briefly broke below the $2 trendline, the candle closed back above this trendline, reclaiming the consolidation range. She remarked that this is exactly what bulls needed to see. However, the analyst added that a confirmation is needed with XRP holding the range between $2 and $2.03 as support.
Related Reading
CasiTrades stated that a breakdown from consolidation usually leads to further downsides, but the XRP price managed to recover the level quickly, showing that buyers are stepping in. She also noted that the bullish divergence is still holding up to the 1-hour RSI even after the dip with selling pressure weakening, which suggests a shift in momentum is possible.
If the XRP price holds the support between $2 and $2.03, CasiTrades predicts that the crypto could bounce and rally toward $2.25 and $2.70. On the other hand, if XRP loses this level, she stated that the next major support sits at $1.90 which is the 0.5 Fibonacci retracement level. Meanwhile, there is also the possibility that XRP could drop to the 0.618 Fib retracement level at $1.54.
At the time of writing, the XRP price is trading at around $2.10, down over 4% in the last 24 hours, according to data from CoinMarketCap.
Featured image from Adobe Stock, chart from Tradingview.com
Source link
Litecoin
Will Litecoin Bounce Back? $113 Becomes Key After Recent Rejection
Published
2 months agoon
February 12, 2025By
admin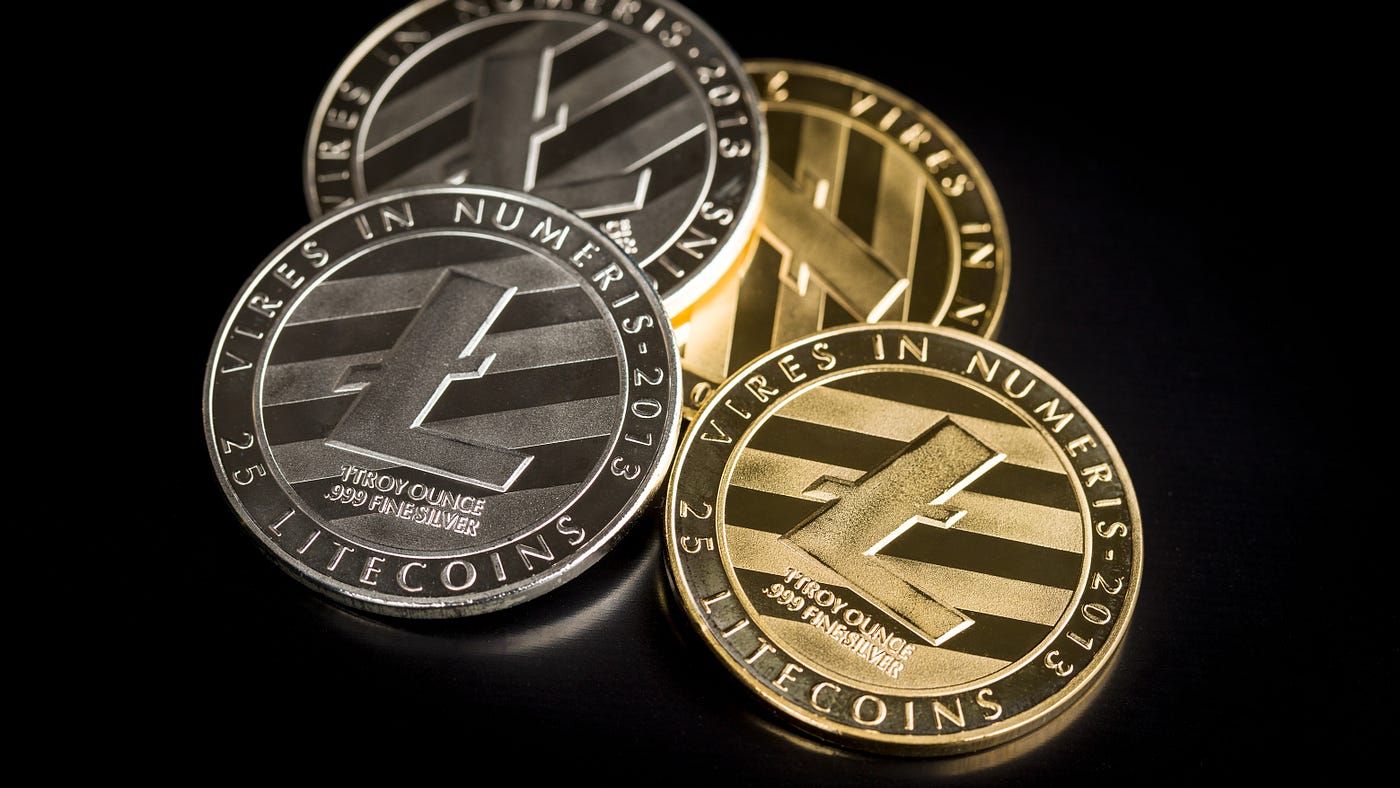
My name is Godspower Owie, and I was born and brought up in Edo State, Nigeria. I grew up with my three siblings who have always been my idols and mentors, helping me to grow and understand the way of life.
My parents are literally the backbone of my story. They’ve always supported me in good and bad times and never for once left my side whenever I feel lost in this world. Honestly, having such amazing parents makes you feel safe and secure, and I won’t trade them for anything else in this world.
I was exposed to the cryptocurrency world 3 years ago and got so interested in knowing so much about it. It all started when a friend of mine invested in a crypto asset, which he yielded massive gains from his investments.
When I confronted him about cryptocurrency he explained his journey so far in the field. It was impressive getting to know about his consistency and dedication in the space despite the risks involved, and these are the major reasons why I got so interested in cryptocurrency.
Trust me, I’ve had my share of experience with the ups and downs in the market but I never for once lost the passion to grow in the field. This is because I believe growth leads to excellence and that’s my goal in the field. And today, I am an employee of Bitcoinnist and NewsBTC news outlets.
My Bosses and co-workers are the best kinds of people I have ever worked with, in and outside the crypto landscape. I intend to give my all working alongside my amazing colleagues for the growth of these companies.
Sometimes I like to picture myself as an explorer, this is because I like visiting new places, I like learning new things (useful things to be precise), I like meeting new people – people who make an impact in my life no matter how little it is.
One of the things I love and enjoy doing the most is football. It will remain my favorite outdoor activity, probably because I’m so good at it. I am also very good at singing, dancing, acting, fashion and others.
I cherish my time, work, family, and loved ones. I mean, those are probably the most important things in anyone’s life. I don’t chase illusions, I chase dreams.
I know there is still a lot about myself that I need to figure out as I strive to become successful in life. I’m certain I will get there because I know I am not a quitter, and I will give my all till the very end to see myself at the top.
I aspire to be a boss someday, having people work under me just as I’ve worked under great people. This is one of my biggest dreams professionally, and one I do not take lightly. Everyone knows the road ahead is not as easy as it looks, but with God Almighty, my family, and shared passion friends, there is no stopping me.
Source link

Trump’s Crypto Dealings Are Making Regulation ‘More Complicated’: House Financial Services Chair

Pontus-X taps Oasis for private, cross-border data sharing in E.U.

Elon Musk, Dogecoin Proponent and U.S. Agency Figurehead, Says ‘No DOGE in D.O.G.E.’

Crypto Investor’s Brave Yet Hilarious Prediction Speculates If XRP Price Will Hit $3,000 This Cycle

Dogecoin (DOGE) Bulls In Trouble—Can They Prevent a Drop Below $0.15?

California introduces ’Bitcoin rights’ in amended digital assets bill

MELANIA Insider Hayden Davis Selling Millions of Dollars Worth of Memecoin Amid 95% Drop: On-Chain Data

Toulouse starts to accept crypto for public transport

Bitcoin, Crypto Prices Slide as Trade Tensions, Inflation Risks Rattle Markets

Will BlackRock Investors Stay Bullish?

Bitcoin Could Appear on 25% of S&P 500 Balance Sheets by 2030, Analyst Says

Centralization and the dark side of asset tokenization — MEXC exec

Bitcoin Support Thins Below $78,000 As Cost Basis Clusters Shift Toward $95,000

Cryptocurrencies to watch this week: Solana, Cronos, DOT

EU Regulator Pushes for New Capital Rules for European Insurers Holding Crypto Assets

Arthur Hayes, Murad’s Prediction For Meme Coins, AI & DeFi Coins For 2025

Expert Sees Bitcoin Dipping To $50K While Bullish Signs Persist

Aptos Leverages Chainlink To Enhance Scalability and Data Access

Bitcoin Could Rally to $80,000 on the Eve of US Elections

Sonic Now ‘Golden Standard’ of Layer-2s After Scaling Transactions to 16,000+ per Second, Says Andre Cronje

Institutional Investors Go All In on Crypto as 57% Plan to Boost Allocations as Bull Run Heats Up, Sygnum Survey Reveals

Crypto’s Big Trump Gamble Is Risky

Ripple-SEC Case Ends, But These 3 Rivals Could Jump 500x

Has The Bitcoin Price Already Peaked?

A16z-backed Espresso announces mainnet launch of core product

Xmas Altcoin Rally Insights by BNM Agent I

Blockchain groups challenge new broker reporting rule

The Future of Bitcoin: Scaling, Institutional Adoption, and Strategic Reserves with Rich Rines

Trump’s Coin Is About As Revolutionary As OneCoin

Is $200,000 a Realistic Bitcoin Price Target for This Cycle?
Trending

 24/7 Cryptocurrency News5 months ago
Arthur Hayes, Murad’s Prediction For Meme Coins, AI & DeFi Coins For 2025

 Bitcoin2 months ago
Expert Sees Bitcoin Dipping To $50K While Bullish Signs Persist

 24/7 Cryptocurrency News3 months ago
Aptos Leverages Chainlink To Enhance Scalability and Data Access

 Bitcoin5 months ago
Bitcoin Could Rally to $80,000 on the Eve of US Elections

 Altcoins2 months ago
Sonic Now ‘Golden Standard’ of Layer-2s After Scaling Transactions to 16,000+ per Second, Says Andre Cronje

 Bitcoin5 months ago
Institutional Investors Go All In on Crypto as 57% Plan to Boost Allocations as Bull Run Heats Up, Sygnum Survey Reveals

 Opinion5 months ago
Crypto’s Big Trump Gamble Is Risky

 Price analysis5 months ago
Ripple-SEC Case Ends, But These 3 Rivals Could Jump 500x


