bull market
After Arrest for Murder, $LUIGI’s Market Cap Hits $60M
Published
4 months agoon
By
admin
Luigi Inu, a memecoin inspired by Luigi Mangione, has hit a new all-time high by market capitalization, reaching $60 million. This market movement is in conjunction with the Pennsylvania police taking Mangione in custody for the murder.
The Luigi Inu (LUIGI) token first started gaining traction following Mangione’s arrest in Altoona, Pennsylvania and charged on Dec 9. The token’s market cap reached $29 million before it rocketed higher to $60 million, after the arrest was confirmed. Originally launched by anonymous crypto traders, the token is trending on Raydium, the automated market maker built on Solana.
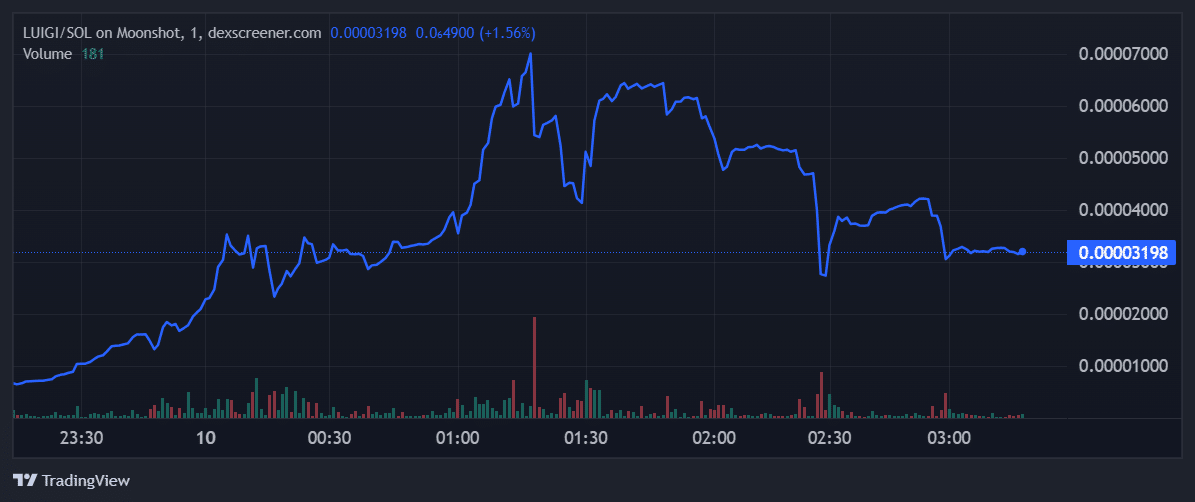
The connection between Mangione and the memecoin lies in the fact that his arrest and the subsequent media attention have significantly boosted the token’s popularity and value.
Who is Luigi Mangione?
According to police, Luigi Mangione, is connected to the “premeditated and pre-planned attack” killing of Brian Thompson, the CEO of UnitedHealthcare, in Manhattan. Surveillance footage also captured Luigi Mangione exiting the vicinity shortly after the gunfire erupted. Mangione also published a manifesto about disparaging things about corporate America, which added fuel to the virality of the memecoin.
The problem with hype-based memecoins
I am not against memes, but meme coins are getting “a little” weird now.
Let’s build real applications using blockchain.
— CZ
BNB (@cz_binance) November 26, 2024
In the wake of recent market activity, numerous new-cycle memecoins have disappointed with their inability to break all-time highs, leaving many to question the “memecoin supercycle” a phrase championed by Murad Mahmudov at September’s Token2049 conference. As meme tokens inspired by hysteria potentially cross the line between tragedy and speculation, experts caution that there are dangers in playing with such whiff-of-miracle assets.
These tokens, like LUIGI, exploit the fear of missing out using viral narratives about wealth, which become appealing much like sports betting, believes Alex Beene. However, they lack the fundamental value and stability of traditional assets, making them highly volatile and risky investments.
i feel like there a better narrative here and eventually, people will start to rotate into $BRIAN and stop supporting a murderer. but then again maybe I have too much faith in CT. https://t.co/Bem5eaD5VG
— BaketheSnake
(@BaketheS77946) December 10, 2024
Many netizens are trading the LUIGI token, with some actively supporting the alleged idea of anti-establishment, which Mangione is said to envision. However, many within the crypto community also condemn the incident and seek justice for the victim. A new token called $BRIAN has also surfaced, which aims to bring justice to Brian Thompson.
Source link
You may like


Trump’s Crypto Dealings Are Making Regulation ‘More Complicated’: House Financial Services Chair


Pontus-X taps Oasis for private, cross-border data sharing in E.U.


Elon Musk, Dogecoin Proponent and U.S. Agency Figurehead, Says ‘No DOGE in D.O.G.E.’


Crypto Investor’s Brave Yet Hilarious Prediction Speculates If XRP Price Will Hit $3,000 This Cycle


Dogecoin (DOGE) Bulls In Trouble—Can They Prevent a Drop Below $0.15?


California introduces ’Bitcoin rights’ in amended digital assets bill

Following a sharp multi-week selloff that dragged Bitcoin from above $100,000 to below $80,000, the recent price bounce has traders debating whether the Bitcoin bull market is truly back on track or if this is merely a bear market rally before the next macro leg higher.
Bitcoin’s Local Bottom or Bull Market Pause?
Bitcoin’s latest correction was deep enough to rattle confidence, but shallow enough to maintain macro trend structure. Price seems to have set a local bottom between $76K–$77K, and several reliable metrics are beginning to solidify the local lows and point towards further upside.
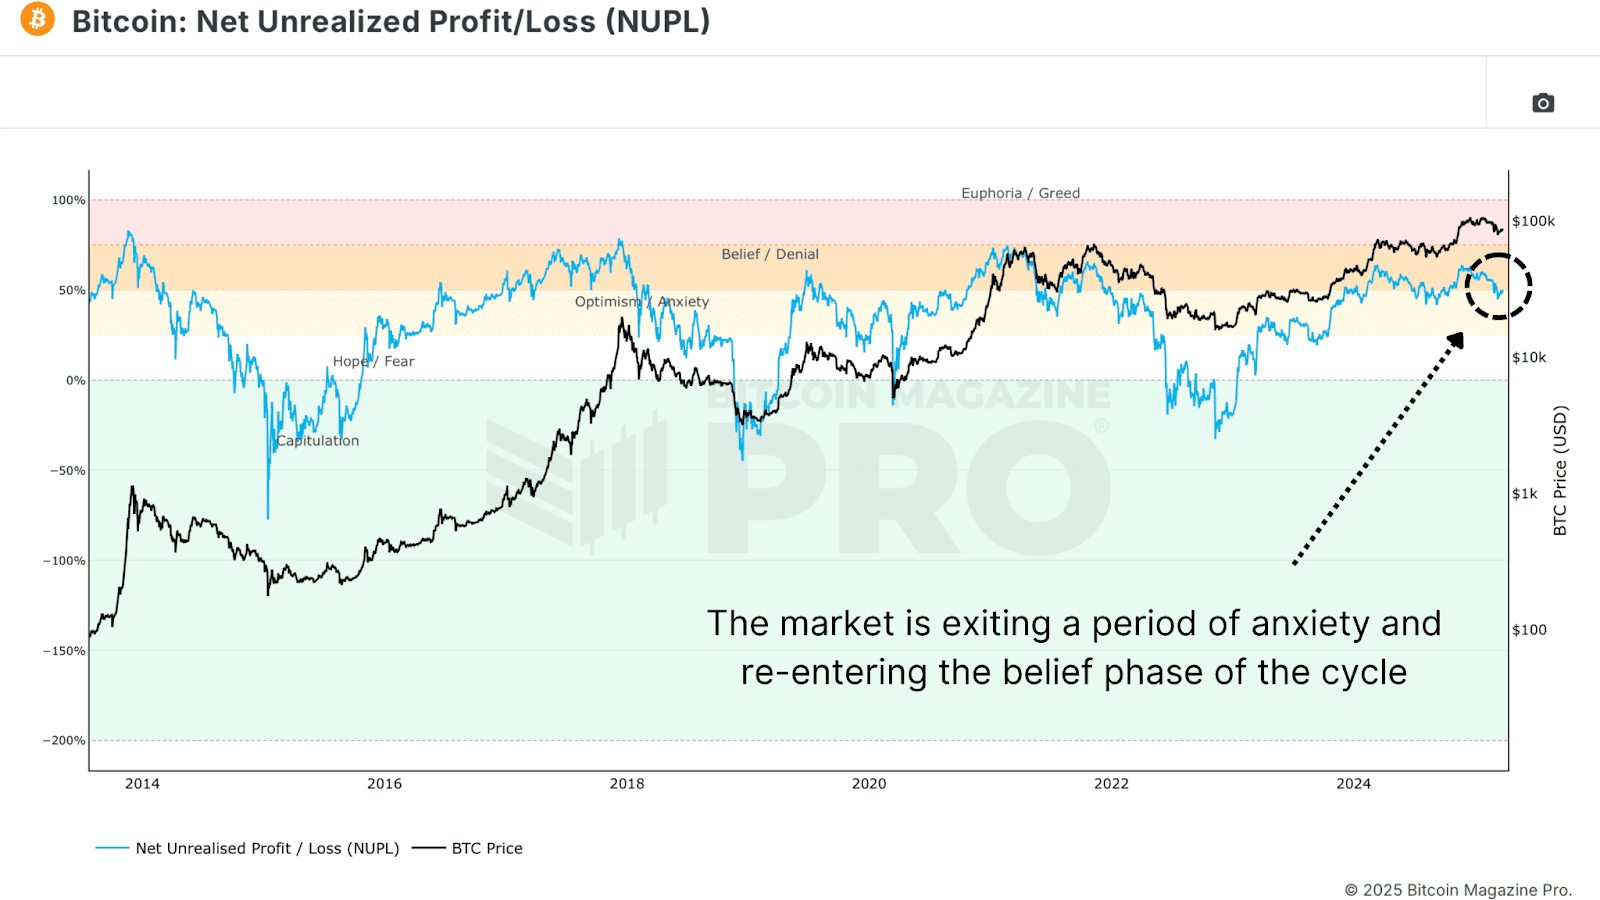
The Net Unrealized Profit and Loss (NUPL) is one of the most reliable sentiment gauges across Bitcoin cycles. As price fell, NUPL dropped into “Anxiety” territory, but following the rebound, NUPL has now reclaimed the “Belief” zone, a critical sentiment transition historically seen at macro higher lows.
The Value Days Destroyed (VDD) Multiple weighs BTC spending by both coin age and transaction size, and compares the data to a previous yearly average, giving insight into long term holder behavior. Current readings have reset to low levels, suggesting that large, aged coins are not being moved. This is a clear signal of conviction from smart money. Similar dynamics preceded major price rallies in both the 2016/17 and 2020/21 bull cycles.

Bitcoin Long-Term Holders Boost Bull Market
We’re also now seeing the Long Term Holder Supply beginning to climb. After profit-taking above $100K, long-term participants are now re-accumulating at lower levels. Historically, these phases of accumulation have set the foundation for supply squeezes and subsequent parabolic price action.

Bitcoin Hash Ribbons Signal Bull Market Cross
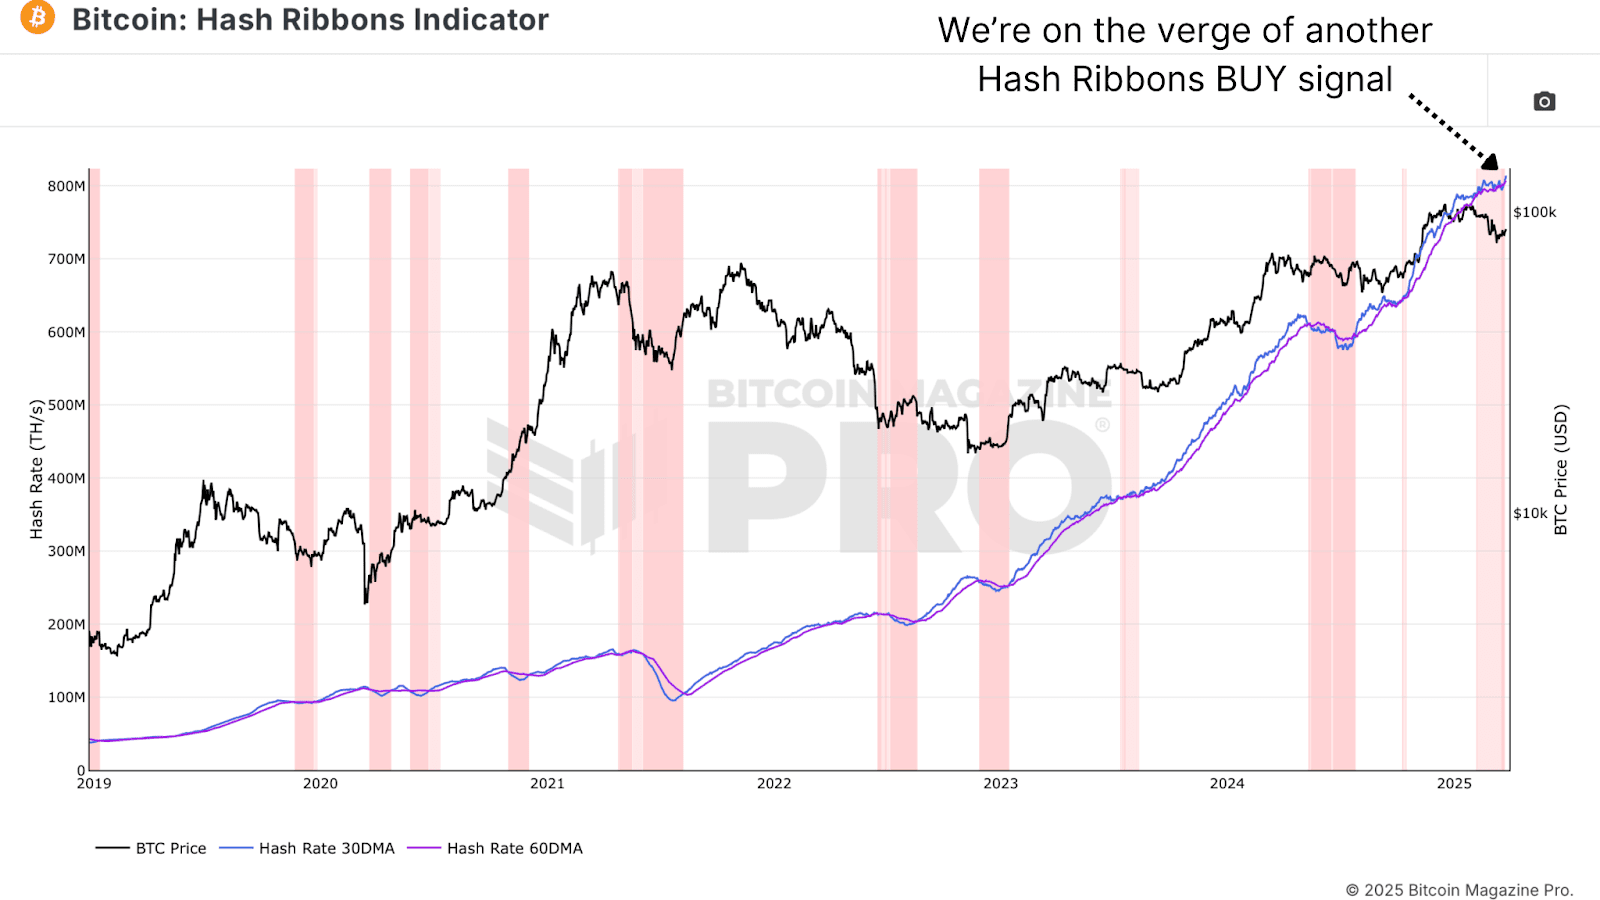
The Hash Ribbons Indicator has just completed a bullish crossover, where the short-term hash rate trend moves above the longer-term average. This signal has historically aligned with bottoms and trend reversals. Given that miner behavior tends to reflect profitability expectations, this cross suggests miners are now confident in higher prices ahead.
Bitcoin Bull Market Tied to Stocks
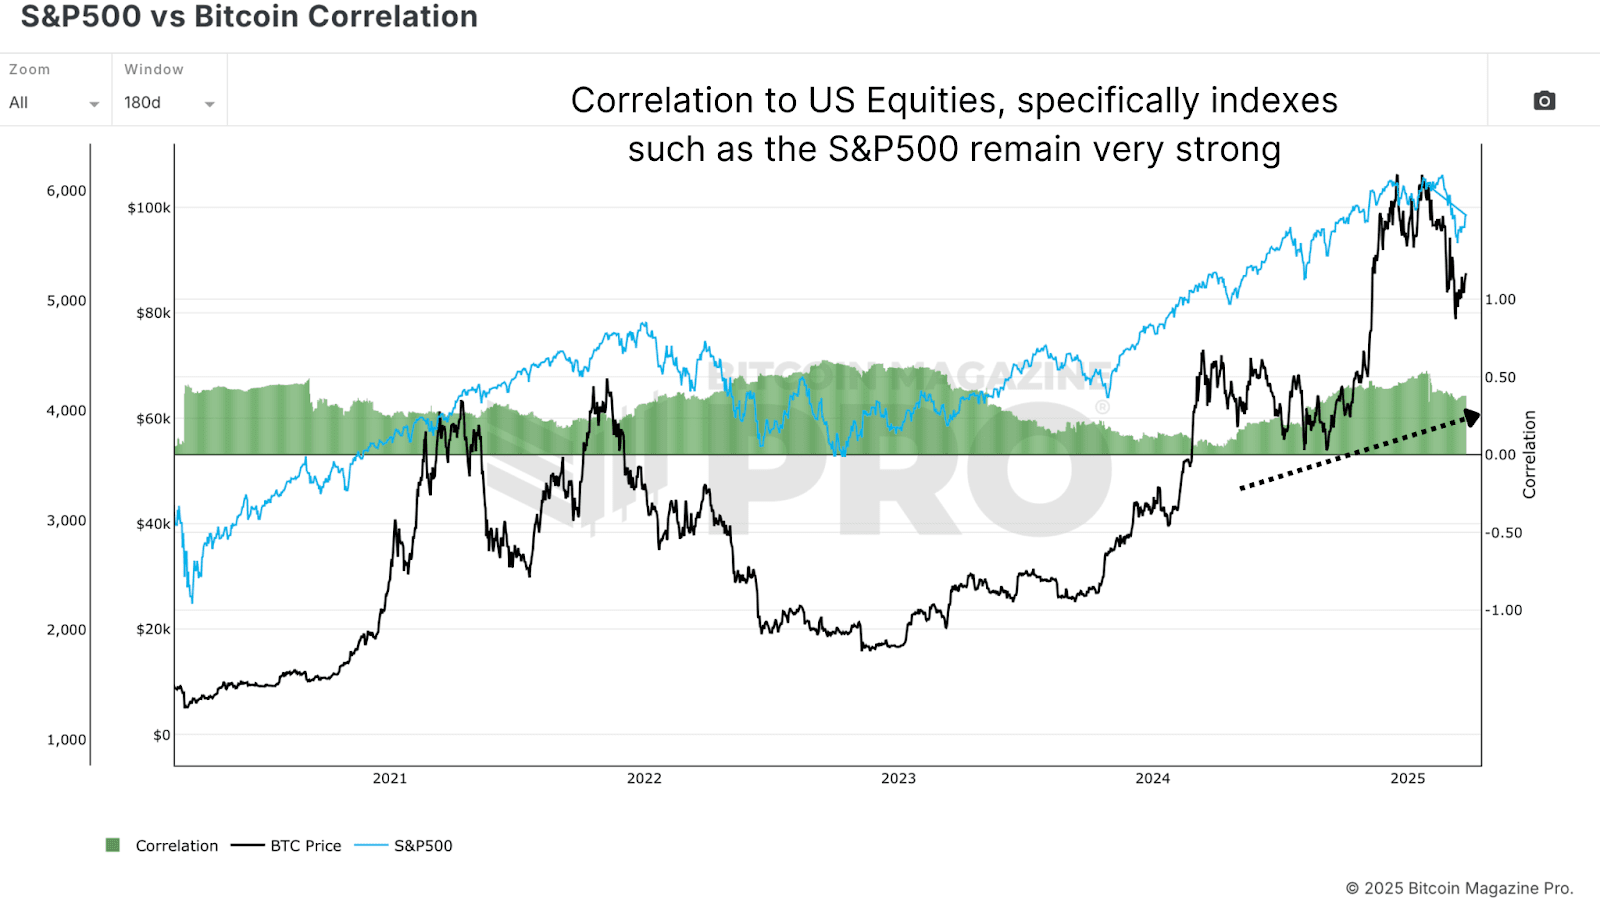
Despite bullish on-chain data, Bitcoin remains closely tied to macro liquidity trends and equity markets, particularly the S&P 500. As long as that correlation holds, BTC will be partially at the mercy of global monetary policy, risk sentiment, and liquidity flows. While rate cut expectations have helped risk assets bounce, any sharp reversal could cause renewed choppiness for Bitcoin.
Bitcoin Bull Market Outlook
From a data-driven perspective, Bitcoin looks increasingly well-positioned for a sustained continuation of its bull cycle. On-chain metrics paint a compelling picture of resilience for the Bitcoin bull market. The Net Unrealized Profit and Loss (NUPL) has shifted from “Anxiety” during the dip to the “Belief” zone after the rebound—a transition often seen at macro higher lows. Similarly, the Value Days Destroyed (VDD) Multiple has reset to levels signaling conviction among long-term holders, echoing patterns before Bitcoin’s rallies in 2016/17 and 2020/21. These metrics point to structural strength, bolstered by long-term holders aggressively accumulating supply below $80,000.
Further supporting this, the Hash Ribbons indicator’s recent bullish crossover reflects growing miner confidence in Bitcoin’s profitability, a reliable sign of trend reversals historically. This accumulation phase suggests the Bitcoin bull market may be gearing up for a supply squeeze, a dynamic that has fueled parabolic moves before. The data collectively highlights resilience, not weakness, as long-term holders seize the dip as an opportunity. Yet, this strength hinges on more than just on-chain signals—external factors will play a critical role in what comes next.
However, macro conditions still warrant caution, as the Bitcoin bull market doesn’t operate in isolation. Bull markets take time to build momentum, often needing steady accumulation and favorable conditions to ignite the next leg higher. While the local bottom between $76K–$77K seems to hold, the path forward won’t likely feature vertical candles of peak euphoria yet. Bitcoin’s tie to the S&P 500 and global liquidity trends means volatility could emerge from shifts in monetary policy or risk sentiment.
For example, while rate cut expectations have lifted risk assets, an abrupt reversal—perhaps from inflation spikes or geopolitical shocks—could test Bitcoin’s stability. Thus, even with on-chain data signaling a robust setup, the next phase of the Bitcoin bull market will likely unfold in measured steps. Traders anticipating a return to six-figure prices will need patience as the market builds its foundation.
If you’re interested in more in-depth analysis and real-time data, consider checking out Bitcoin Magazine Pro for valuable insights into the Bitcoin market.
Disclaimer: This article is for informational purposes only and should not be considered financial advice. Always do your own research before making any investment decisions.
Source link
Bitcoin
Trader Predicts Crypto Rallies Amid Expectations of Fed Monetary Policy Shift – But There’s a Catch
Published
2 weeks agoon
March 18, 2025By
admin
A widely followed crypto analyst is predicting higher prices for crypto assets as he expects the Federal Reserve to end its anti-inflation monetary policies.
In a new thread, the pseudonymous crypto analyst Pentoshi tells his 861,300 followers on the social media platform X that we are close to seeing the end of quantitative tightening (QT), which are policies that reduce the Fed’s balance sheet and lowers the supply of money in circulation.
The trader cites data from the decentralized prediction platform Polymarket, which shows that 100% of users believe that the Fed will end QT by May of this year.
The cessation of QT is typically seen as bullish for risk assets like Bitcoin (BTC) and altcoins as the move signals the end of tight monetary conditions.
However, Pentoshi warns investors to be “cautiously optimistic” as both the S&P 500 and top crypto assets have seen growth over the last few years that appears unsustainable.
“I think we are getting close to [the] end of QT with Polymarket now pricing in odds as a sure thing whereas before they were much lower odds. As previously stated, it does seem Trump would end up forcing it. I don’t think QT automatically means it’s easy mode.
I think that mode is clearly gone overall in the way people think about it (2017/2021). While prices are much lower, I think it’s best to be cautiously optimistic. Many things are down significantly and there hopefully will be some decent mean reversion. Markets in general have rallied hard. And assets were likely a bit overvalued before.
SPX going 25% back to back years was going to have low growth or negative this year as it wasn’t a sustainable pace. BTC went from $16,000 to $108,000, SOL [from] $8 to $300. Cautiously optimistic. [Be] patient for any time capitulation, as often, following big trends, we eventually get longer sideways periods and less volatility as the market finds balance.”
While Pentoshi is flipping tactically bullish on stocks and crypto, he warns investors that any rally will likely be short-lived.
“I think any up currently will be a lower high. People underestimate the time aspect.”
At time of writing, Bitcoin is trading for $83,248.
Follow us on X, Facebook and Telegram
Don’t Miss a Beat – Subscribe to get email alerts delivered directly to your inbox
Check Price Action
Surf The Daily Hodl Mix
 

Disclaimer: Opinions expressed at The Daily Hodl are not investment advice. Investors should do their due diligence before making any high-risk investments in Bitcoin, cryptocurrency or digital assets. Please be advised that your transfers and trades are at your own risk, and any losses you may incur are your responsibility. The Daily Hodl does not recommend the buying or selling of any cryptocurrencies or digital assets, nor is The Daily Hodl an investment advisor. Please note that The Daily Hodl participates in affiliate marketing.
Generated Image: Midjourney
Source link
bull market
Low Ethereum gas fees signal bullish mid-term sentiment
Published
1 month agoon
February 19, 2025By
admin
Ethereum gas fees have dropped significantly, with the average cost of a transfer now at just $0.41, far below the $15.21 peak seen in the past two years.
According to on-chain analytics firm Santiment, low gas fees often suggest a network that isn’t overly congested, which can be a bullish signal for Ethereum’s (ETH) mid-to-long-term price outlook.
The average fee of an Ethereum transfer currently sits at just $0.41, in contrast to the $15.21 high point of the past 2 years. When Ethereum transaction fees are low, it usually means the network is not overly crowded. When users are not paying high prices to move their ETH… pic.twitter.com/G22qd3eTl8
— Santiment (@santimentfeed) February 19, 2025
It is easier for new buyers to enter the market when there are lower transaction costs, which usually occur during times of price stagnation or negative sentiment. However, as traders and users scramble to transact, high fees typically signal soaring demand, which frequently results in temporary corrections.
In another development that could further lower transaction fees, the Ethereum network recently approved a vote to raise its gas limit to more than 30 million. Gas limit refers to the maximum amount of gas, or computational resources, that can be consumed by all transactions in a block
A higher gas limit means the network will be able to process more transactions per block, potentially reducing congestion and lowering fees.. Gas limit has reached 35.9 million in the past 24 hours, according to data from gaslimit.pics.
Ethereum is now trading at roughly $2,674 after falling 2% over the past day. Trading volume has increased by 10% despite the drop, indicating rising investor interest. Ethereum has been consolidating between $2,565 and $2,800 for the last two weeks, but the most recent drop to the lower end of this range suggests that there may be more declines to come.
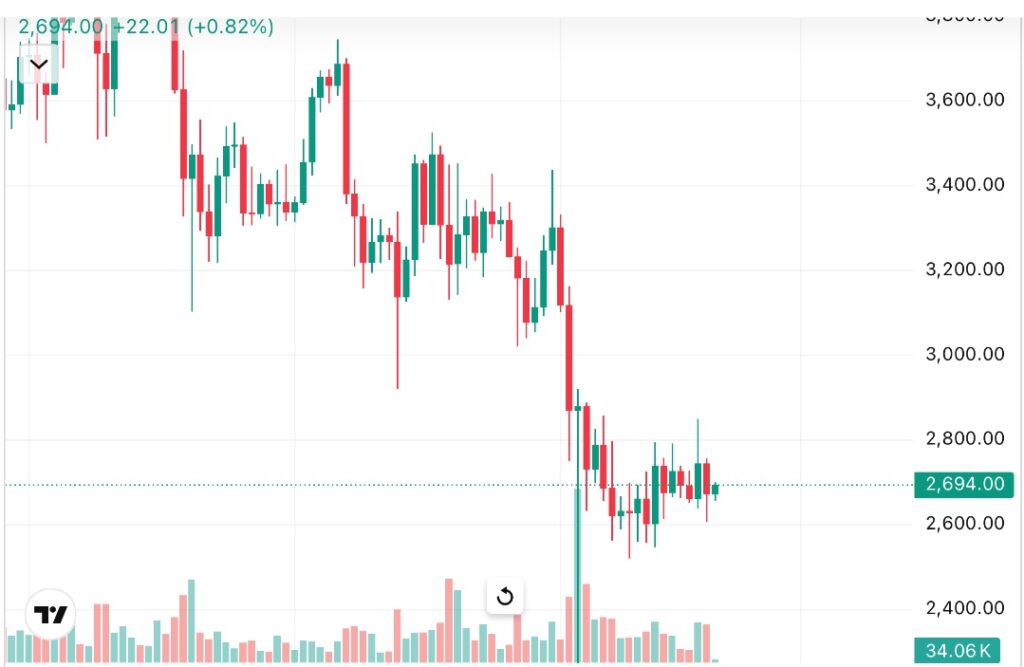
Over $60 million worth of ETH has moved off of exchanges in the last day, according to Coinglass data, which raises the possibility that investors are accumulating ETH. Because they suggest long-term holding and lessen selling pressure, exchange outflows are frequently interpreted as optimistic indicators.
However, with $121 million in short positions at $2,650 and $90 million in long positions at $2,605, intraday traders are still being cautious. This points to a greater level of short-term bearish sentiment.
The SEC’s ruling on spot Ethereum ETFs with staking integration continues to be the largest possible bullish catalyst for ETH. Some analysts believe the lack of staking yield has limited demand for these ETFs, but approval could drive institutional inflows. As of Feb 18., total cumulative ETH ETF inflows have risen to $3.16 billion, according to data from SoSoValue.
Meanwhile, ETH’s decentralized exchange activity has surged. DefiLlama data shows that Ethereum-based protocols handled $2.62 billion in 24-hour trading volume up from $1.1 billion on Feb. 16. Ethereum is closing in on Solana, which continues to face criticism over recent meme coin rug pulls.
Source link

Trump’s Crypto Dealings Are Making Regulation ‘More Complicated’: House Financial Services Chair

Pontus-X taps Oasis for private, cross-border data sharing in E.U.

Elon Musk, Dogecoin Proponent and U.S. Agency Figurehead, Says ‘No DOGE in D.O.G.E.’

Crypto Investor’s Brave Yet Hilarious Prediction Speculates If XRP Price Will Hit $3,000 This Cycle

Dogecoin (DOGE) Bulls In Trouble—Can They Prevent a Drop Below $0.15?

California introduces ’Bitcoin rights’ in amended digital assets bill

MELANIA Insider Hayden Davis Selling Millions of Dollars Worth of Memecoin Amid 95% Drop: On-Chain Data

Toulouse starts to accept crypto for public transport

Bitcoin, Crypto Prices Slide as Trade Tensions, Inflation Risks Rattle Markets

Will BlackRock Investors Stay Bullish?

Bitcoin Could Appear on 25% of S&P 500 Balance Sheets by 2030, Analyst Says

Centralization and the dark side of asset tokenization — MEXC exec

Bitcoin Support Thins Below $78,000 As Cost Basis Clusters Shift Toward $95,000

Cryptocurrencies to watch this week: Solana, Cronos, DOT

EU Regulator Pushes for New Capital Rules for European Insurers Holding Crypto Assets

Arthur Hayes, Murad’s Prediction For Meme Coins, AI & DeFi Coins For 2025

Expert Sees Bitcoin Dipping To $50K While Bullish Signs Persist

Aptos Leverages Chainlink To Enhance Scalability and Data Access

Bitcoin Could Rally to $80,000 on the Eve of US Elections

Sonic Now ‘Golden Standard’ of Layer-2s After Scaling Transactions to 16,000+ per Second, Says Andre Cronje

Institutional Investors Go All In on Crypto as 57% Plan to Boost Allocations as Bull Run Heats Up, Sygnum Survey Reveals

Crypto’s Big Trump Gamble Is Risky

Ripple-SEC Case Ends, But These 3 Rivals Could Jump 500x

Has The Bitcoin Price Already Peaked?

A16z-backed Espresso announces mainnet launch of core product

Xmas Altcoin Rally Insights by BNM Agent I

Blockchain groups challenge new broker reporting rule

The Future of Bitcoin: Scaling, Institutional Adoption, and Strategic Reserves with Rich Rines

Trump’s Coin Is About As Revolutionary As OneCoin

Is $200,000 a Realistic Bitcoin Price Target for This Cycle?
Trending

 24/7 Cryptocurrency News5 months ago
Arthur Hayes, Murad’s Prediction For Meme Coins, AI & DeFi Coins For 2025

 Bitcoin2 months ago
Expert Sees Bitcoin Dipping To $50K While Bullish Signs Persist

 24/7 Cryptocurrency News3 months ago
Aptos Leverages Chainlink To Enhance Scalability and Data Access

 Bitcoin5 months ago
Bitcoin Could Rally to $80,000 on the Eve of US Elections

 Altcoins2 months ago
Sonic Now ‘Golden Standard’ of Layer-2s After Scaling Transactions to 16,000+ per Second, Says Andre Cronje

 Bitcoin5 months ago
Institutional Investors Go All In on Crypto as 57% Plan to Boost Allocations as Bull Run Heats Up, Sygnum Survey Reveals

 Opinion5 months ago
Crypto’s Big Trump Gamble Is Risky

 Price analysis5 months ago
Ripple-SEC Case Ends, But These 3 Rivals Could Jump 500x


