
Bitcoin
Can Realized Cap HODL Waves Identify The Next Bitcoin Price Peak?


Bitcoin’s cyclical nature has captivated investors for over a decade, and tools like the Realized Cap HODL Waves offer a window into the psychology of the market. As an adaptation of the traditional HODL waves, this indicator provides crucial insights by weighting age bands by the realized price—the cost basis of Bitcoin held in wallets at any given time.
Currently, the six-month-and-below band sits at ~55%, signaling a market with room to grow before reaching overheated levels historically seen around 80%. In this article, we’ll dive into the details of Realized Cap HODL Waves, what they tell us about the market, and how investors can use this tool to better navigate Bitcoin’s price cycles.
When the 6-month and below #Bitcoin Realized Cap HODL Waves bands surpass ~80%, it's a good indication the market is over-heated, and a major price peak is likely…
Currently we're at around 55%, plenty of upside to go for #BTC!
pic.twitter.com/ZL5P7USMo9
— Bitcoin Magazine Pro (@BitcoinMagPro) December 12, 2024

Click here to view the Realized Cap HODL Waves live chart on Bitcoin Magazine Pro.
Understanding Realized Cap HODL Waves
At its core, the Realized Cap HODL Waves chart shows the cost basis of Bitcoin held in wallets, grouped into different age brackets. Unlike traditional HODL waves, which track the total supply of Bitcoin, this chart accounts for the realized value—a measure of the price at which Bitcoin was last moved.
The key insight? Younger age bands (e.g., coins held for six months or less) tend to dominate during bullish phases, reflecting rising market optimism. Conversely, older age bands gain prominence during bearish phases, often coinciding with market bottoms when investor sentiment is subdued.
This dynamic allows the chart to serve as a barometer for market cycles, identifying periods of overheating or underpricing with remarkable accuracy.
Why 80% Is Critical: Historical Context
The chart reveals that when short-term holders—represented by the six-month-and-below age bands—make up 80% or more of the total realized cap, Bitcoin is often nearing a major market peak. This level historically aligns with euphoric price action, where speculative mania drives the market.
For example:
- 2013 Bull Market: The six-month band surpassed 80% during Bitcoin’s meteoric rise, marking the peak of the cycle.
- 2017 Bull Market: A similar pattern occurred as Bitcoin reached its then-all-time high of $20,000.
- 2021 Bull Market: Peaks in the short-term bands preceded corrections, reinforcing the indicator’s predictive value.
At the current ~55% level, there is ample room for Bitcoin to grow before reaching the overheated territory historically seen near 80%.
What the Data Tells Us Today
The latest Chart of the Day, shared by Bitcoin Magazine Pro, underscores the importance of this indicator. Here are the key takeaways:
- Room for Growth: With the six-month-and-below bands at 55%, the market appears to be in a healthy growth phase with significant upside potential.
- No Overheating Yet: Historically, overheating occurs when these bands exceed 80%. This suggests Bitcoin has room to run before encountering similar conditions.
- Cycle Perspective: The current cycle aligns with early-to-mid-stage bull market behavior, where newer investors are accumulating, and optimism is building.
The ETF Effect: How Bitcoin ETFs Could Impact Realized Cap HODL Waves
Unlike previous Bitcoin cycles, 2024 marks a significant shift with the introduction of Bitcoin ETFs. These financial products, designed to provide institutional and retail investors easy exposure to Bitcoin, have the potential to reshape the on-chain data reported by tools like Realized Cap HODL Waves. While this indicator has historically been a reliable measure of market cycles and price peaks, the dynamics of this cycle may differ.
Bitcoin ETFs aggregate investments from numerous participants into centralized custodial wallets, reducing the number of active on-chain addresses and transactions. This centralization introduces unique challenges when interpreting Realized Cap HODL Waves:
- Younger Age Bands May Underestimate Market Activity: ETF trading occurs off-chain, meaning that short-term transactions and active addresses might be underrepresented in the six-month-and-below bands. As a result, the indicator could suggest less market enthusiasm than is actually present.
- Older Age Bands May Dominate: Long-term Bitcoin holdings within ETFs could shift realized value into higher age bands, making it appear that the market is more conservative and less dynamic than in previous cycles.
While ETFs bring increased liquidity and price discovery through traditional markets, they also introduce complexities for on-chain analysis. This shift highlights the importance of adapting how we interpret indicators like Realized Cap HODL Waves in the context of evolving market structures.
Why This Cycle May Be Different
With Bitcoin ETFs now playing a central role, this cycle may not follow the same patterns as previous ones. The historical success of Realized Cap HODL Waves in identifying price peaks remains noteworthy, but investors should consider that ETFs represent a new variable. Increased adoption via ETFs could lead to more significant price movements that are less directly visible in on-chain data.
As always, it’s crucial not to rely solely on one indicator for investment decisions. Tools like Realized Cap HODL Waves are best used to supplement broader market analysis, providing valuable insights into underlying market trends. By combining on-chain indicators with ETF inflow data and other metrics, investors can gain a clearer and more comprehensive understanding of Bitcoin’s price dynamics in this new era.
How Investors Can Use Realized Cap HODL Waves
For investors, the Realized Cap HODL Waves chart offers actionable insights:
- Market Sentiment: Use the six-month band as a gauge of market euphoria or fear. Higher percentages indicate bullish sentiment, while lower percentages often signal consolidation or accumulation phases.
- Cycle Timing: Peaks in younger age bands often precede corrections. Monitoring these levels can help investors manage risk during bullish cycles.
- Strategic Positioning: Understanding when the market is overheating can help long-term holders optimize their exit strategies, while buyers may find opportunities during periods dominated by older age bands.
Conclusion: Bullish Outlook with Room to Run
The Realized Cap HODL Waves chart is an invaluable tool for understanding Bitcoin’s price cycles. With the six-month-and-below bands currently at 55%, the market shows plenty of upside potential before hitting overheated levels. For investors, this means the current phase offers an attractive opportunity to capitalize on Bitcoin’s growth trajectory.
As always, it’s crucial to combine this indicator with other tools and fundamental analysis. To explore more live data and stay updated on Bitcoin’s price action, visit Bitcoin Magazine Pro.
Disclaimer: This article is for informational purposes only and should not be considered financial advice. Always do your own research before making any investment decisions.
Source link


Bitcoin price is at a pivotal level as ETF flows offloaded $93 million on Friday, ending a 10-day buying spree. While BTC holds key support at $82,000, BlackRock investors disposition may signal optimism.
Bitcoin ETFs End 10-day Buying Spree, But BlackRock Investors Hold
Bitcoin ETFs drew media attention on Friday as net outflows reached $93 million, marking the end of a 10-day buying spree that added over $1.07 billion in BTC.
FairSide data reveals that all of the outflows came from Fidelity’s FBTC, while BlackRock’s IBIT and eight other U.S.-approved spot ETFs recorded neutral flows, signaling diverging institutional investor sentiment.

Despite the selling pressure, BTC price showed resilience, bouncing from a 10-day low of $82,000 to reclaim the $84,000 level over the weekend.
This suggests that while some institutional players have turned cautious, BTC continues to find buyers at the $82,000 mark, likely driven by macroeconomic hedging.
Why Are Bitcoin ETFs Taking a Neutral Outlook Despite Bearish Market Sentiment?
While Bitcoin’s brief dip below $82,000 coincided with renewed regulatory uncertainty—following U.S. Congress’ scrutiny of Paul Atkins, Trump’s crypto-friendly SEC pick—the decision by major ETFs like BlackRock’s IBIT to hold rather than sell suggests a more calculated approach among institutional investors.
One possible explanation is that institutional investors are weighing broader macroeconomic risks. With concerns mounting over Trump’s proposed trade policies and their potential impact on traditional stock markets, Bitcoin remains an attractive hedge due to its independence from traditional financial structures. This could explain why ETF outflows have been concentrated in specific funds like FBTC rather than across the board.
- Large Un-realized Profits
Prior to the $93 million sell-off observed on Friday, Bitcoin ETFs had acquired over $1.07 billion in the previous 10-days. This sheer volume of Bitcoin accumulated by ETFs in recent weeks means that short-term supply is limited.
It also hints that majority on investors who began buying when BTC prices plunged below $77,000 over the past week are still in profit, hence the reluctance to sell.

This key dynamics may have contributed to Bitcoin price holding key support levels above $82,000. Notably, while BTC price rebounded, leading altcoins like Ethereum (ETH), Solana (SOL), and Ripple (XRP) have lagged behind, further reinforcing the narrative that institutional capital remains primarily focused on BTC.
What’s Next for Bitcoin ETFs and Institutional Demand?
The coming weeks will be crucial in determining whether Bitcoin ETFs resume their accumulation trend or if further outflows signal a shift in sentiment. Investors will closely watch developments in U.S. regulatory policy and broader market conditions to assess whether Bitcoin’s status as a safe-haven asset remains intact.
If the macroeconomic environment continues to favor Bitcoin as a non-correlated asset, ETF inflows could resume, pushing BTC to new highs. However, prolonged uncertainty or negative regulatory developments could trigger deeper corrections.
For now, BlackRock and other major institutional players appear to be maintaining their positions, indicating confidence in Bitcoin’s long-term trajectory.
Bitcoin Price Forecast: BTC Faces Critical Resistance at $84,400 Amid Bearish Pennant Formation
Bitcoin price forecast signals remains uncertain as BTC trades at $82,363, hovering near key support levels. The Bollinger Bands show tightening volatility, with resistance at $84,412 and $88,215. The Parabolic SAR at $80,237 suggests a continuation of the downtrend unless BTC breaks above the mid-range resistance.

A bearish pennant formation signals potential downside risk. If BTC fails to reclaim $84,400, selling pressure could drive the price towards $80,600 or even the lower Bollinger Band at $80,237. The volume delta reveals declining buying momentum, supporting the bearish case.
However, a bullish scenario emerges if BTC can hold above $82,000 and break past $84,400 with strong volume. This could lead to a rally toward $88,215, negating the bearish pennant. With key resistance intact, Bitcoin’s trajectory depends on its next move at this crucial level.
Frequently Asked Questions (FAQs)
Bitcoin price is declining due to ETF outflows, regulatory uncertainty, and shifting investor sentiment favoring safer assets like gold and cash.
Yes, if institutional demand returns, macroeconomic conditions improve, and key support levels hold, Bitcoin could regain bullish momentum.
Bitcoin ETFs drive large-scale buying and selling, influencing price volatility and overall market liquidity depending on institutional investor behavior.
ibrahim
Crypto analyst covering derivatives markets, macro trends, technical analysis, and DeFi. His works feature in-depth market insights, price forecasts, and institutional-grade research on digital assets.
Disclaimer: The presented content may include the personal opinion of the author and is subject to market condition. Do your market research before investing in cryptocurrencies. The author or the publication does not hold any responsibility for your personal financial loss.
Source link


Bitcoin is making its way from trading desks to corporate treasuries, and by the end of the decade, it could be standard practice, according to one analyst.
“Across all the different strategies and implementations, I anticipate that by 2030, a quarter of the S&P 500 will have BTC somewhere on their balance sheets as a long-term asset,” Elliot Chun, a partner at Architect Partners, wrote in a market snapshot.
The strategy—holding bitcoin as a treasury reserve asset—was unorthodox when Strategy, formerly known as MicroStrategy, first adopted it in August 2020. The firm framed BTC as a hedge against inflation, a diversification tool, and a way to distinguish itself in the market.
Then CEO Michael Saylor’s highly public embrace of bitcoin transformed the company into a de facto proxy for BTC exposure. Since then, MicroStrategy stock has surged more than 2,000%, far outpacing both the S&P 500 and bitcoin over the same period, Chun pointed out.
GameStop is the latest company to follow suit, announcing this week that it would raise $1.3 billion through a convertible note to acquire bitcoin. Its stock initially surged following the announcement but has since endured a correction, falling nearly 15% for the week.
Chun argued that treasurers may soon face career risk not for buying bitcoin, but for ignoring it altogether. “Doing nothing is no longer a defensible strategy,” he wrote.
According to BitcoinTreasuries data, publicly listed companies currently hold 665,618 BTC, around 3.17% of the cryptocurrency’s total supply. Strategy holds the lion’s share, 506,137 BTC.
Read more: U.S. Listed Firms Continue Bitcoin (BTC) Treasury Adoption
Source link

Reason to trust
![]()
Strict editorial policy that focuses on accuracy, relevance, and impartiality
Created by industry experts and meticulously reviewed
The highest standards in reporting and publishing
Strict editorial policy that focuses on accuracy, relevance, and impartiality
Morbi pretium leo et nisl aliquam mollis. Quisque arcu lorem, ultricies quis pellentesque nec, ullamcorper eu odio.
Bitcoin’s price action in the past 48 hours has seen it approaching the $80,000 price level again, with risks of breaking to the downside. Looking at on-chain data shows a notable support level between $80,920 and $78,000 that must not be broken.
Related Reading
Particularly, on-chain analytics from Glassnode point to a thinning of support at the $78,000 level, where only minimal cost basis clusters now exist. The insight follows a sharp move that saw savvy traders scoop up nearly 15,000 Bitcoin at the March 10 low before cashing out at the $87,000 local top.
Support Cushion Rises With Clusters Between $80,000 And $84,000
Bitcoin started the month of March with a crazy crash that saw its price hit below $77,000 on March 10 and March 11. Most of the month was spent by Bitcoin embarking on a recovery from this level, eventually reaching as high as $88,500 last week.
Interestingly, on-chain data from Glassnode shows that some Bitcoin traders took advantage of the crash and bought about 15,000 BTC at this low. However, many addresses from this same cohort sold at the $87,000 local top, leaving behind a depleted buffer zone that may no longer offer the same price stability.
Bitcoin’s strongest cost basis clusters have steadily migrated upward from $78,000 throughout the month, with the most prominent support levels now sitting between $80,920 and $84,100. Approximately 20,000 BTC were acquired at $80,920, 50,000 BTC at $82,090, and another 40,000 BTC at around $84,100. These fresh accumulations are now the new zones of confidence among recent buyers that may offer cushions for the recent market dip.
At the time of writing, Bitcoin is trading at $83,120, meaning that it has lost the zone of 40,000 BTC around $84,100. This puts the onus on $82,090 and, subsequently, the $80,920 price levels. However, if the correction sharpens further, it wouldn’t be until after $78,000 that structural support reappears at $74,000 and $71,000, where long-term conviction buying occurred, estimated at 49,000 BTC and 41,000 BTC, respectively.
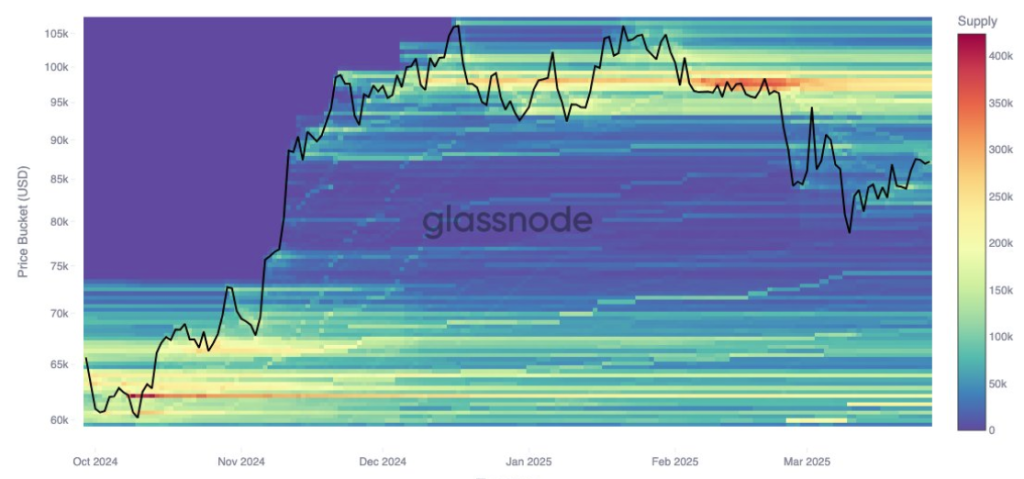
Image From X: Glassnode
$95,000 Cost Basis Cluster Grows With Cooling Demand
As support continues to climb gradually, resistance appears to be firming near the $95,000 mark. Investor cost basis data shows an increase of 12,000 BTC clustered at this level since March 24.
This implies that some investors now anticipate a top forming around $95,000, and selling activity could become more pronounced if prices approach that zone. This resistance, alongside the support levels, could see Bitcoin confined within a narrowing range in the short term.
Related Reading
Glassnode data confirms that long-term holders (addresses holding Bitcoin for more than 150 days) have been the primary source of profit-taking for a while. Long-term holders’ profit-taking is now nearly matched by the losses endured by short-term traders who have been holding Bitcoin for less than 155 days.
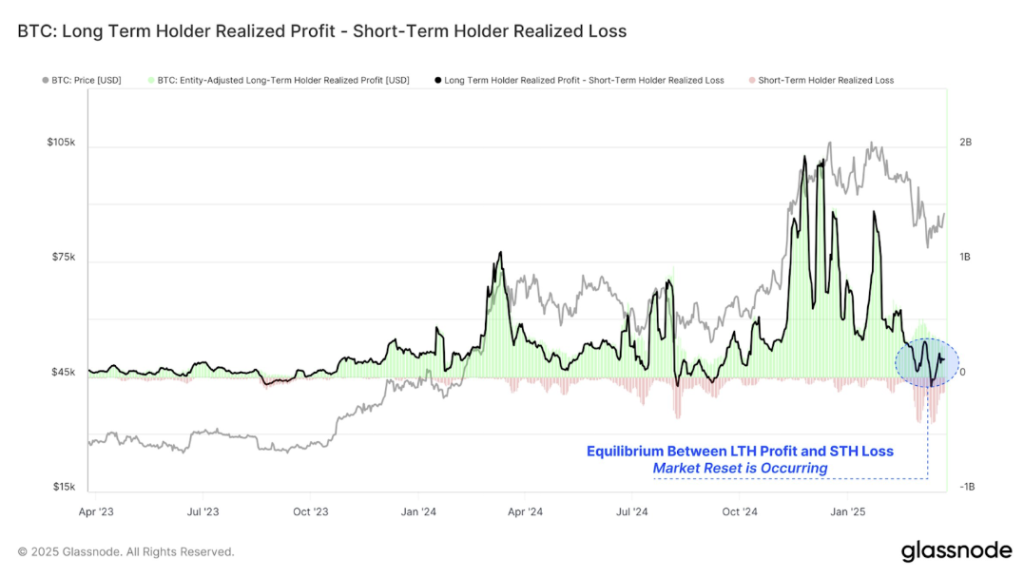
Image From X: Glassnode
Featured image from Tech Research Online, chart from TradingView
Source link

Trump’s Crypto Dealings Are Making Regulation ‘More Complicated’: House Financial Services Chair

Pontus-X taps Oasis for private, cross-border data sharing in E.U.

Elon Musk, Dogecoin Proponent and U.S. Agency Figurehead, Says ‘No DOGE in D.O.G.E.’

Crypto Investor’s Brave Yet Hilarious Prediction Speculates If XRP Price Will Hit $3,000 This Cycle

Dogecoin (DOGE) Bulls In Trouble—Can They Prevent a Drop Below $0.15?

California introduces ’Bitcoin rights’ in amended digital assets bill

MELANIA Insider Hayden Davis Selling Millions of Dollars Worth of Memecoin Amid 95% Drop: On-Chain Data

Toulouse starts to accept crypto for public transport

Bitcoin, Crypto Prices Slide as Trade Tensions, Inflation Risks Rattle Markets

Will BlackRock Investors Stay Bullish?

Bitcoin Could Appear on 25% of S&P 500 Balance Sheets by 2030, Analyst Says

Centralization and the dark side of asset tokenization — MEXC exec

Bitcoin Support Thins Below $78,000 As Cost Basis Clusters Shift Toward $95,000

Cryptocurrencies to watch this week: Solana, Cronos, DOT

EU Regulator Pushes for New Capital Rules for European Insurers Holding Crypto Assets


 24/7 Cryptocurrency News5 months ago
Arthur Hayes, Murad’s Prediction For Meme Coins, AI & DeFi Coins For 2025

 Bitcoin2 months ago
Expert Sees Bitcoin Dipping To $50K While Bullish Signs Persist

 24/7 Cryptocurrency News3 months ago
Aptos Leverages Chainlink To Enhance Scalability and Data Access

 Bitcoin5 months ago
Bitcoin Could Rally to $80,000 on the Eve of US Elections

 Altcoins2 months ago
Sonic Now ‘Golden Standard’ of Layer-2s After Scaling Transactions to 16,000+ per Second, Says Andre Cronje

 Bitcoin5 months ago
Institutional Investors Go All In on Crypto as 57% Plan to Boost Allocations as Bull Run Heats Up, Sygnum Survey Reveals

 Opinion5 months ago
Crypto’s Big Trump Gamble Is Risky

 Price analysis5 months ago
Ripple-SEC Case Ends, But These 3 Rivals Could Jump 500x

✓ Share: