
Bitcoin
Billionaire Jack Dorsey Issues Bitcoin Warning, Says BTC Risks Becoming Irrelevant if This Happens

Billionaire and Block CEO Jack Dorsey says that Bitcoin (BTC) is at risk of failure if it doesn’t manage to tackle one critical use case.
In a new interview on the Presidio Bitcoin YouTube channel, Dorsey is asked to imagine that he fast-forwarded to the future where Bitcoin has failed.
When asked how Bitcoin failed, Dorsey says the flagship crypto asset faded into irrelevance because it was only used as a store of value and not as a form of money for payments and transactions.
“I think it fails through irrelevance. It fails to be relevant to people on a daily basis. If it just ends up being a store of value and nothing more, I don’t think it gains relevance at all.
I think it has to be payments for it to be relevant on the everyday. Otherwise, it’s just something you kind of buy and forget and only use in emergency situations or when you want to get liquid again. So I think if it doesn’t transition to payments and find that everyday use case, it’s increasingly irrelevant. And that’s fair to me.”
When asked what can be done to mitigate the risk of Bitcoin failing, Dorsey says more applications need to be built to facilitate easy, fast payments to rival giants like Visa and Mastercard.
“I think building simple accessible experiences that solve the payment use case, making it scale, making it fast, giving the speed of the Visa and Mastercard networks real competition – and there are tons of projects that do that – and it continues to increase in privacy and security and ultimately safety. That gives you a third option, and I think we always want a third option to the US dollar, to the Chinese yuan. Having a third option for currency is important and it keeps the other currencies in check and governments in check as well.”
Follow us on X, Facebook and Telegram
Don’t Miss a Beat – Subscribe to get email alerts delivered directly to your inbox
Check Price Action
Surf The Daily Hodl Mix

Disclaimer: Opinions expressed at The Daily Hodl are not investment advice. Investors should do their due diligence before making any high-risk investments in Bitcoin, cryptocurrency or digital assets. Please be advised that your transfers and trades are at your own risk, and any losses you may incur are your responsibility. The Daily Hodl does not recommend the buying or selling of any cryptocurrencies or digital assets, nor is The Daily Hodl an investment advisor. Please note that The Daily Hodl participates in affiliate marketing.
Generated Image: DALLE3
Source link


Bitcoin
Trader Unveils Massive Downside Target for Bitcoin, Calls for Multi-Month BTC Bear Market – Here’s His Outlook

A trader who nailed the Bitcoin market top earlier this year believes BTC will witness a period of falling prices in the coming months.
Pseudonymous analyst Bluntz tells his 318,000 followers on the social media platform X that he thinks Bitcoin is already in a bear market that will last about two years.
The trader shares a chart suggesting that he arrived at that time frame by measuring the length of the most recent Bitcoin bull market, which he says lasted from December 2022 to January 2025.
“Time-wise will probably last into 2027 in my opinion, give or take 25%.”
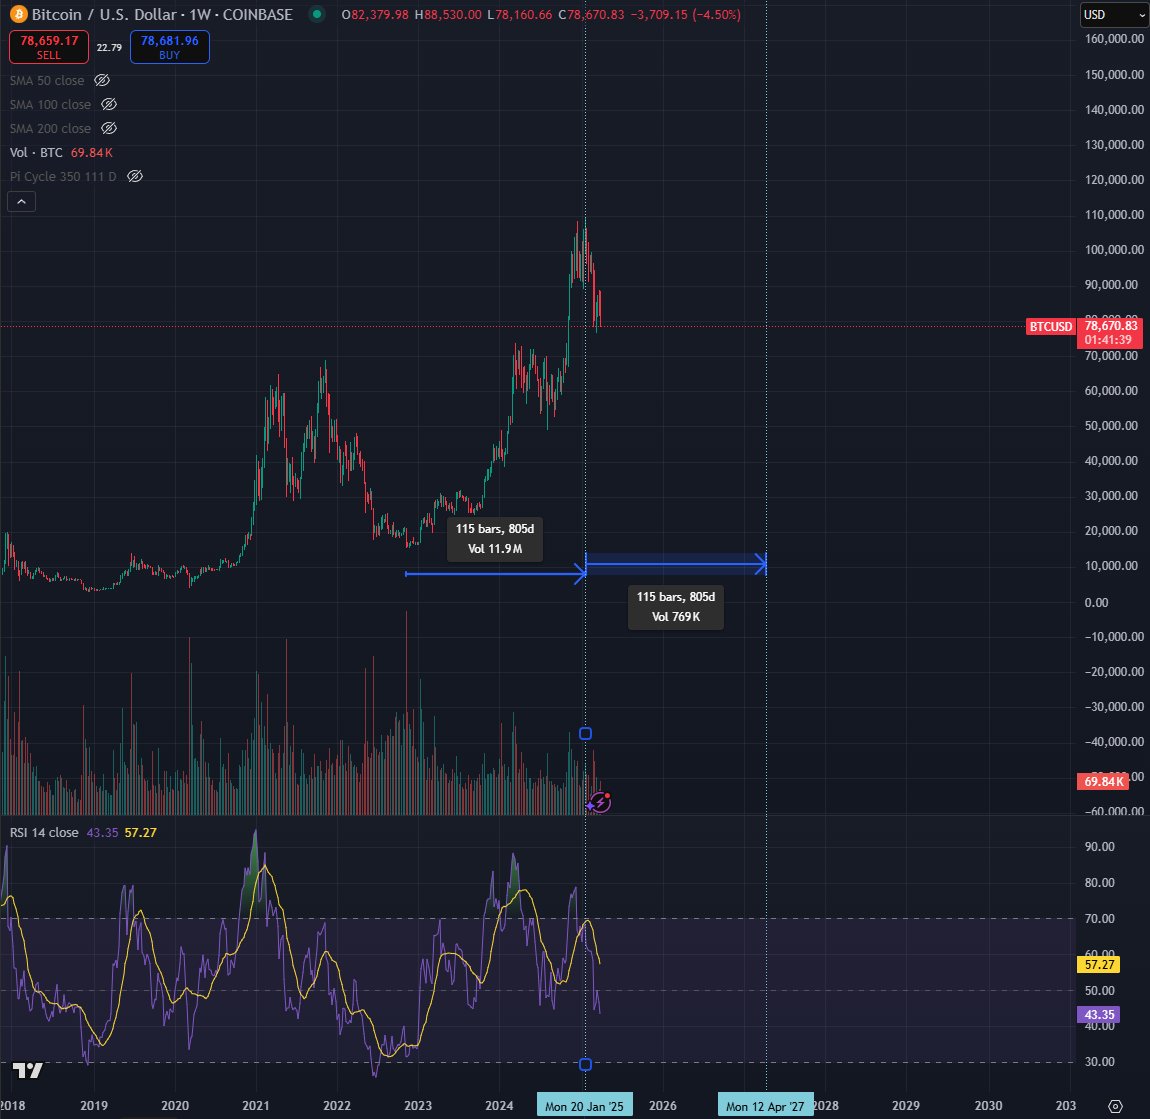
He also predicts that during the period of a sustained downtrend, Bitcoin may lose up to 55% of its current value before hitting a bear market bottom.
When asked about his downside price target for BTC, Bluntz replied,
“$36,000.”
At time of writing, Bitcoin is trading for $80,296.
While Bluntz is bearish on Bitcoin, he says one precious metal is about to start a bull run. Looking at the two-week chart of gold versus silver (XAUUSD/XAGUSD), the analyst thinks the pair has printed a major lower high after completing an ABC rally.
“Time to pay attention to silver, in my opinion… Finally.”
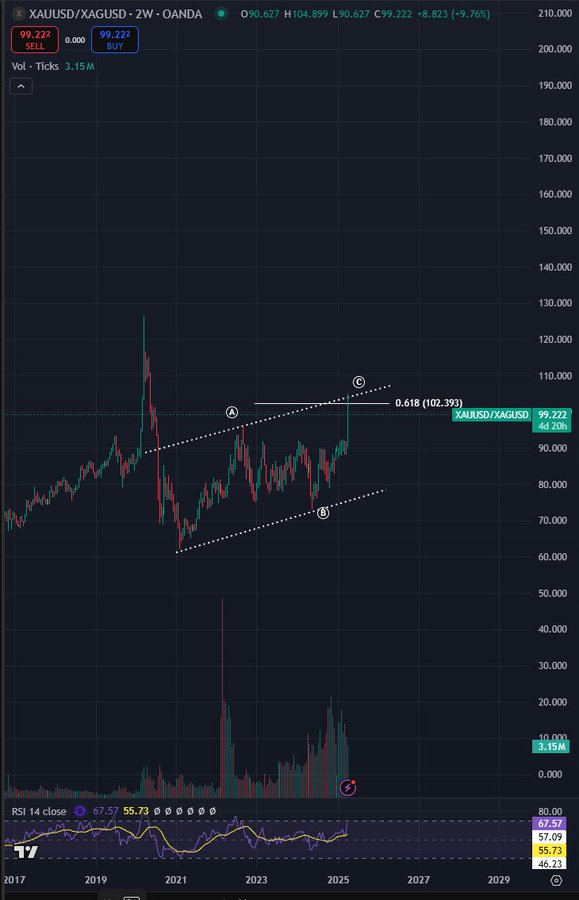
Bluntz practices the Elliott Wave theory, which states that a bullish asset tends to witness a five-wave downtrend after concluding an ABC rally. A bearish gold-versus-silver chart suggests that silver is about to outperform gold.
Last week, gold printed a fresh all-time high at $3,167 per ounce.
At time of writing, silver is trading for $30 per ounce.
Follow us on X, Facebook and Telegram
Don’t Miss a Beat – Subscribe to get email alerts delivered directly to your inbox
Check Price Action
Surf The Daily Hodl Mix
Disclaimer: Opinions expressed at The Daily Hodl are not investment advice. Investors should do their due diligence before making any high-risk investments in Bitcoin, cryptocurrency or digital assets. Please be advised that your transfers and trades are at your own risk, and any losses you may incur are your responsibility. The Daily Hodl does not recommend the buying or selling of any cryptocurrencies or digital assets, nor is The Daily Hodl an investment advisor. Please note that The Daily Hodl participates in affiliate marketing.
Generated Image: DALLE3
Source link
Reason to trust
![]()
Strict editorial policy that focuses on accuracy, relevance, and impartiality
Created by industry experts and meticulously reviewed
The highest standards in reporting and publishing
Strict editorial policy that focuses on accuracy, relevance, and impartiality
Morbi pretium leo et nisl aliquam mollis. Quisque arcu lorem, ultricies quis pellentesque nec, ullamcorper eu odio.
The global equity and cryptocurrency markets experienced significant downturns earlier today, as US President Donald Trump’s country-specific reciprocal tariffs are set to take effect on April 9. The leading cryptocurrency, Bitcoin (BTC), has declined by more than 7% in the past 24 hours, and analysts predict further near-term challenges for the digital asset.
US Tariffs Lead To Crypto Market Rout
Notably, Trump’s baseline 10% tariffs on all countries went into effect on April 5, while the higher, country-specific reciprocal tariffs are scheduled to commence on April 9. These developments have raised fears of a global recession and widespread job losses.
Related Reading
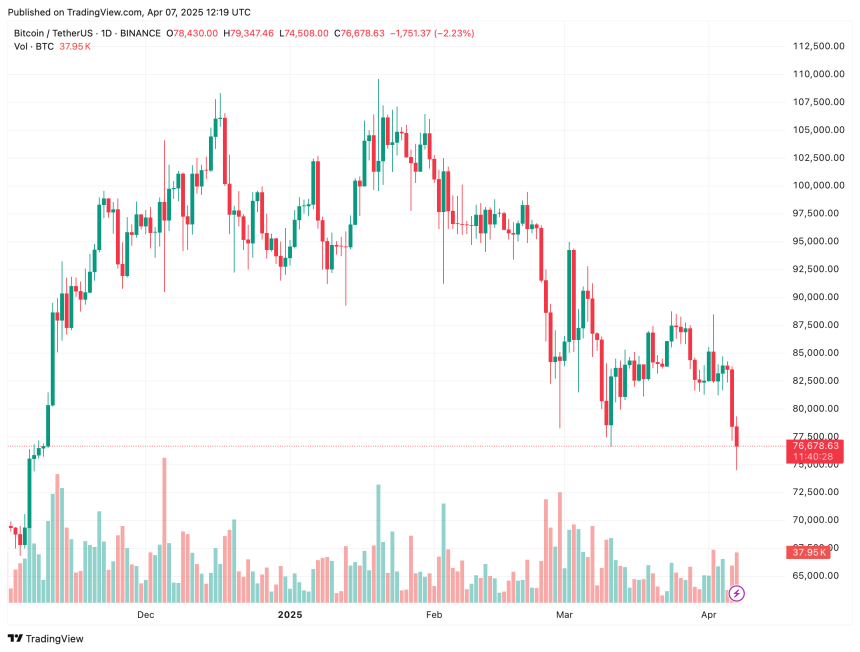
The digital assets market has felt the impact of these tariffs, with BTC slipping over 7% in the past 24 hours – from approximately $82,300 on April 6, to a low of around $74,500 earlier today.
Altcoins such as Ethereum (ETH), Solana (SOL), and XRP have experienced even greater declines, tumbling by 17.2%, 16%, and 15.8% respectively over the past 24 hours. Similarly, the total crypto market capitalization has shed almost $130 billion during the same period.
Commenting on BTC’s price action amid the market turmoil, seasoned crypto analyst Ali Martinez highlighted that there may be more challenges ahead for the leading digital asset, as it has flashed the infamous death cross on the daily chart, indicating the potential for further price pullbacks.
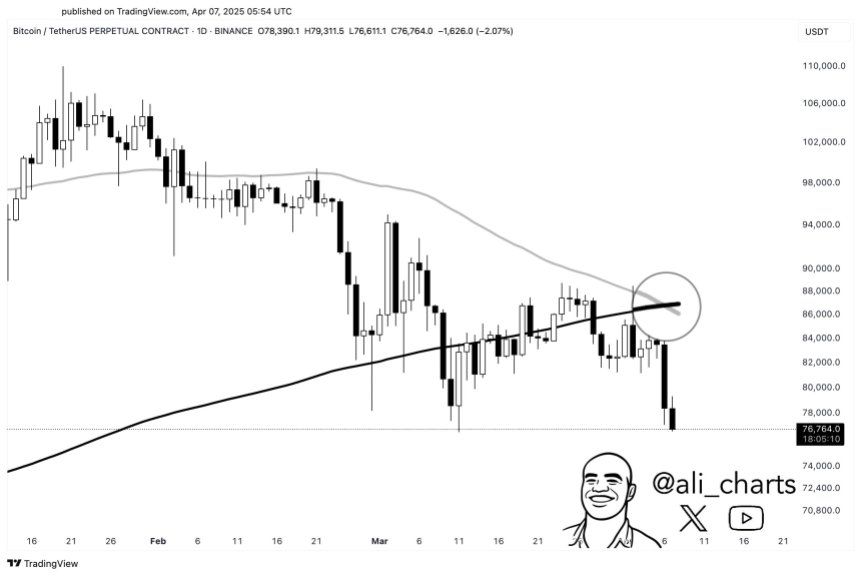
For the uninitiated, a death cross is a bearish technical signal that appears when the 50-day moving average (MA) drops below the 200-day MA. It often suggests a potential downtrend or increased selling pressure in the market.
Similarly, veteran trader Peter Brandt shared the following chart, showing BTC trading in a symmetrical triangle pattern, with a wedge retest located at $81,024. The trader hinted that BTC may follow a drop to the 50% retracement level of $54,000.

To elaborate, a symmetrical triangle pattern in trading is a chart formation where the price consolidates with converging trend lines connecting a series of lower highs and higher lows, indicating a period of indecision before a potential breakout in either direction.
Similarly, a wedge retest refers to the price action where, after breaking out from a wedge pattern – a formation with converging trend lines – the price returns to test the breakout level before continuing in the breakout direction.
An Opportunity To Stack Bitcoin?
While heightened fears surrounding further price declines in BTC have unsettled investors and traders alike, some risk-seeking investors view this as an opportunity to accumulate more BTC at lower prices.
Related Reading
For instance, CryptoQuant analyst BorisVest, in a recent analysis, emphasized that if BTC falls between $65,000 to $71,000, it could offer a favorable buying opportunity for investors with a decent risk-reward ratio. At press time, BTC trades at $76,678, down 7.5% in the past 24 hours.
Featured image created with Unsplash, charts from X and TradingView.com
Source link

Bitcoin (BTC) fell to a four-month low of $74,500 on April 7, and data suggests that the price may not have bottomed yet.
Investors dumped risk assets after US President Donald Trump doubled down on his plan to impose global tariffs over the weekend, triggering a $9.5 trillion wipeout in global equity markets.
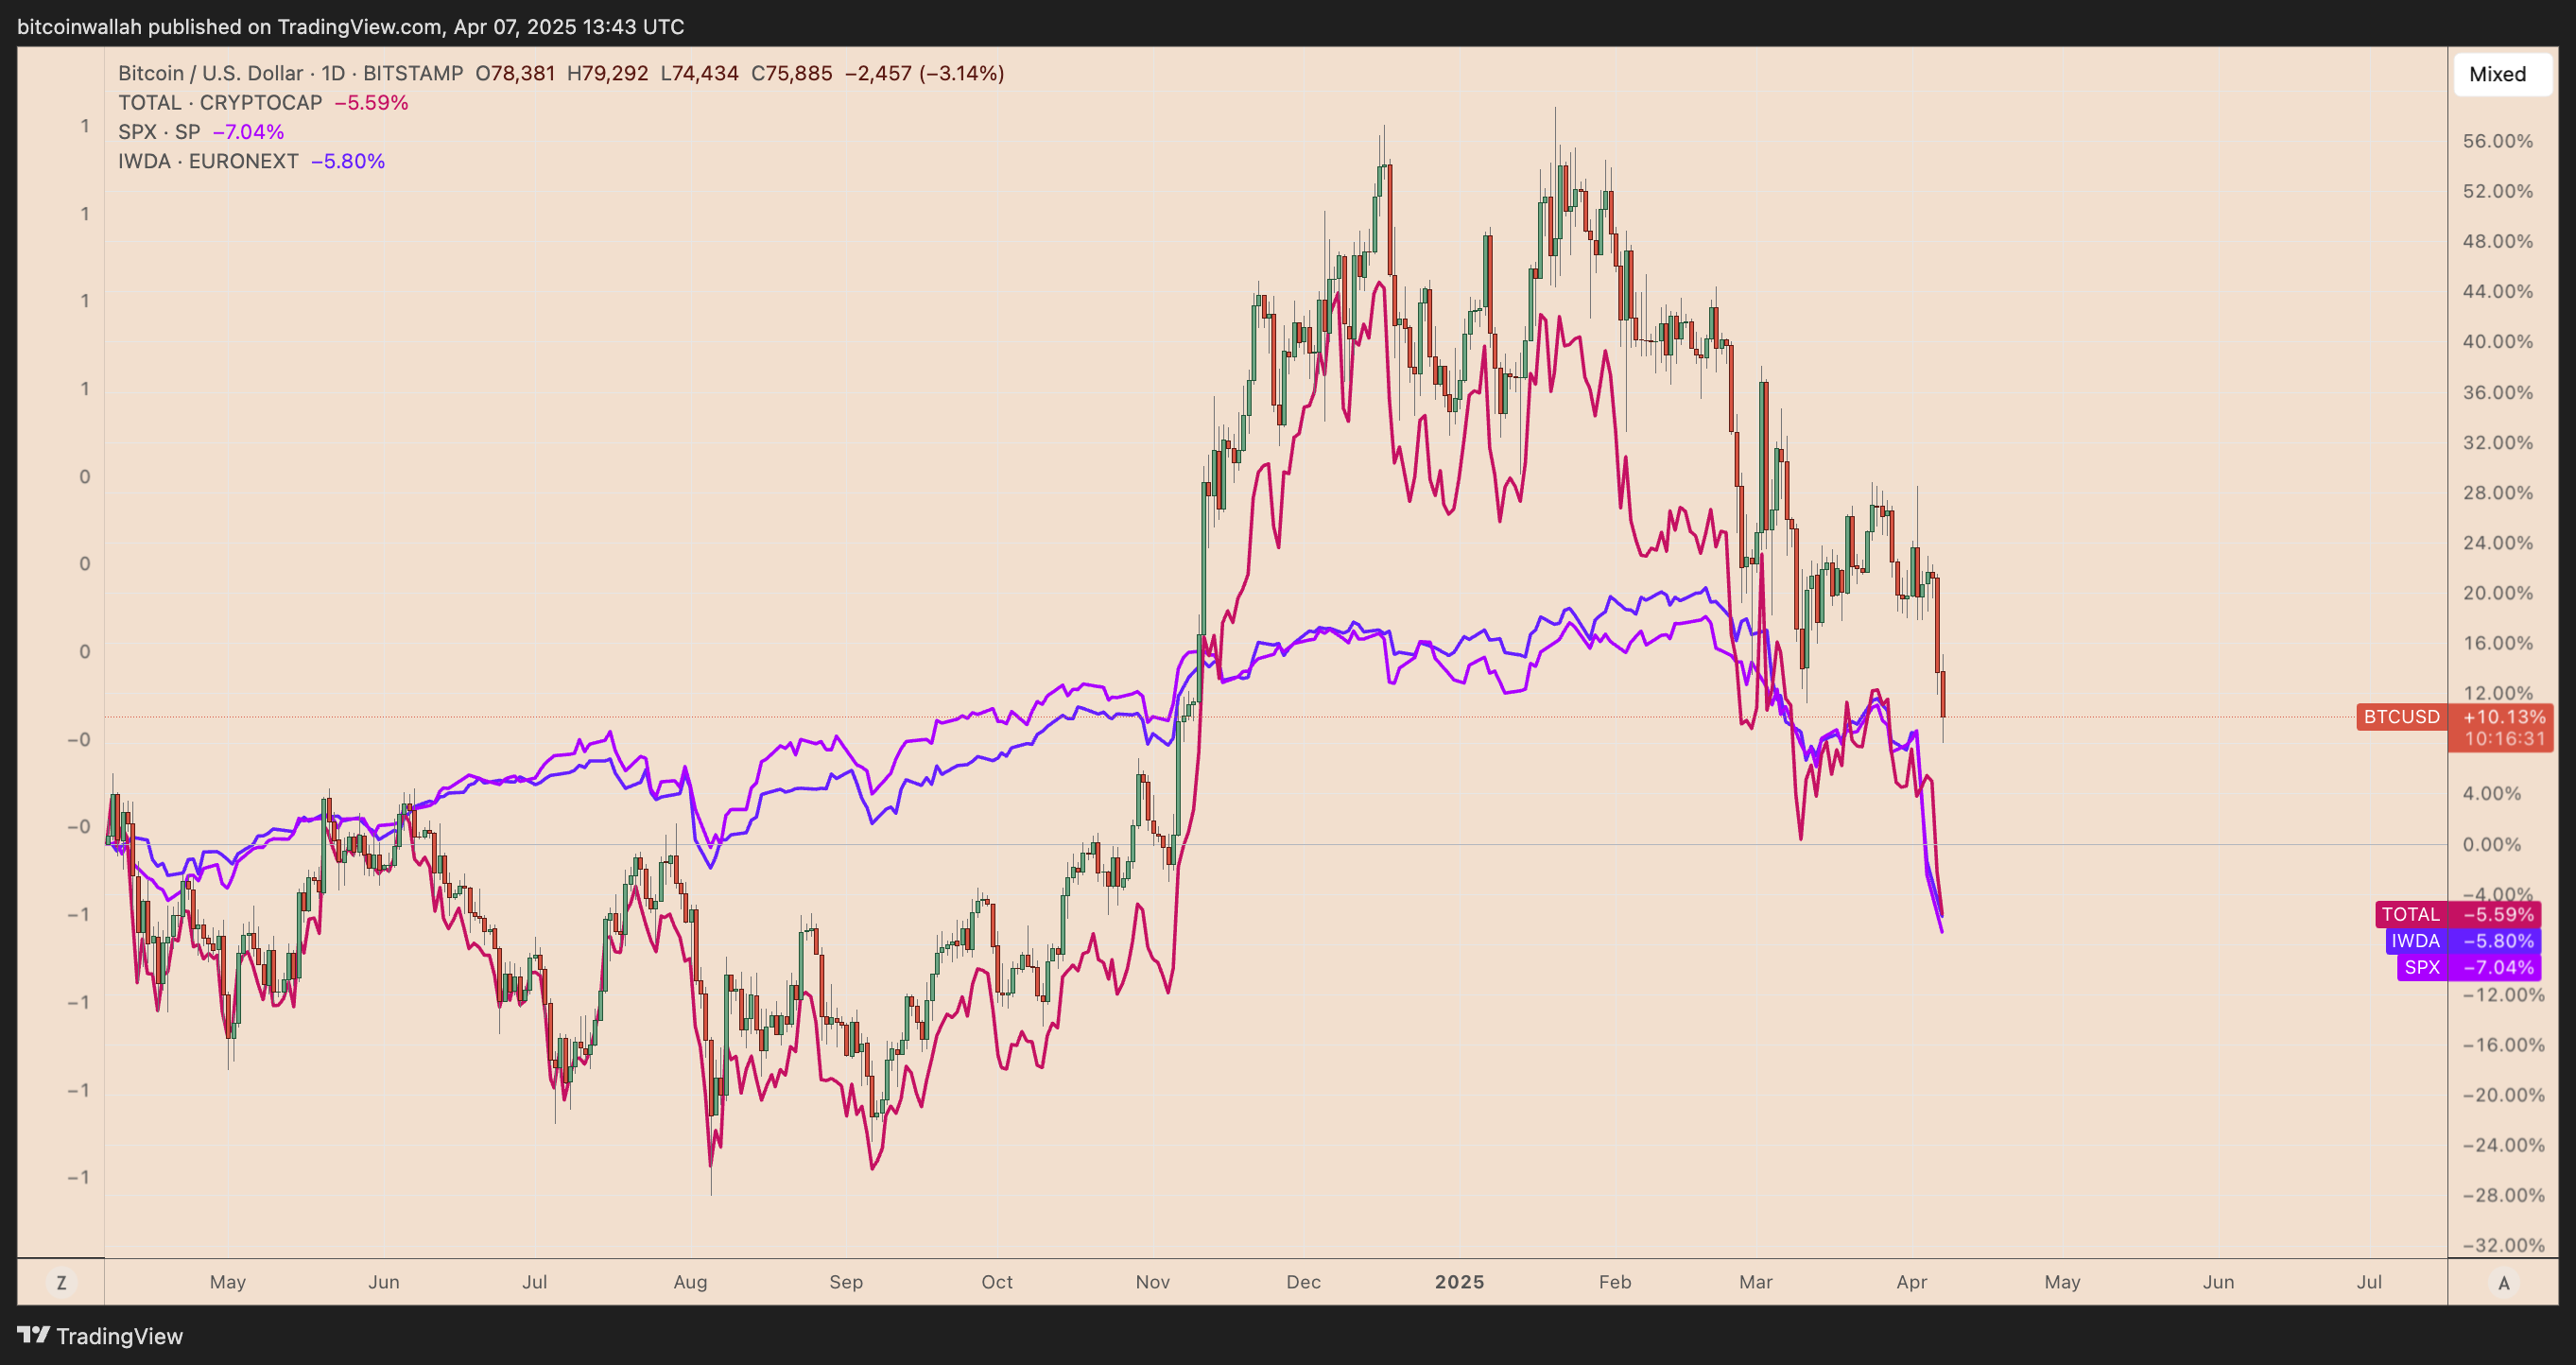
BTC/USD vs. TOTAL crypto market cap, S&P 500, and MSCI World index one-year performance. Source: TradingView
Growing calls for a US recession have spooked risk investors while leaving crypto market participants wondering how low can the Bitcoin price go in the near future.
Bitcoin eyes decline toward “Saylor’s average entry“ level
Bitcoin is currently testing a critical technical level—the 50-week exponential moving average (50-week EMA)—which has historically acted as a dividing line between bull and bear phases.
According to market analyst Ted Pillows and numerous other chartists, Bitcoin must reclaim the EMA, currently near $77,500, to avoid a deeper correction.
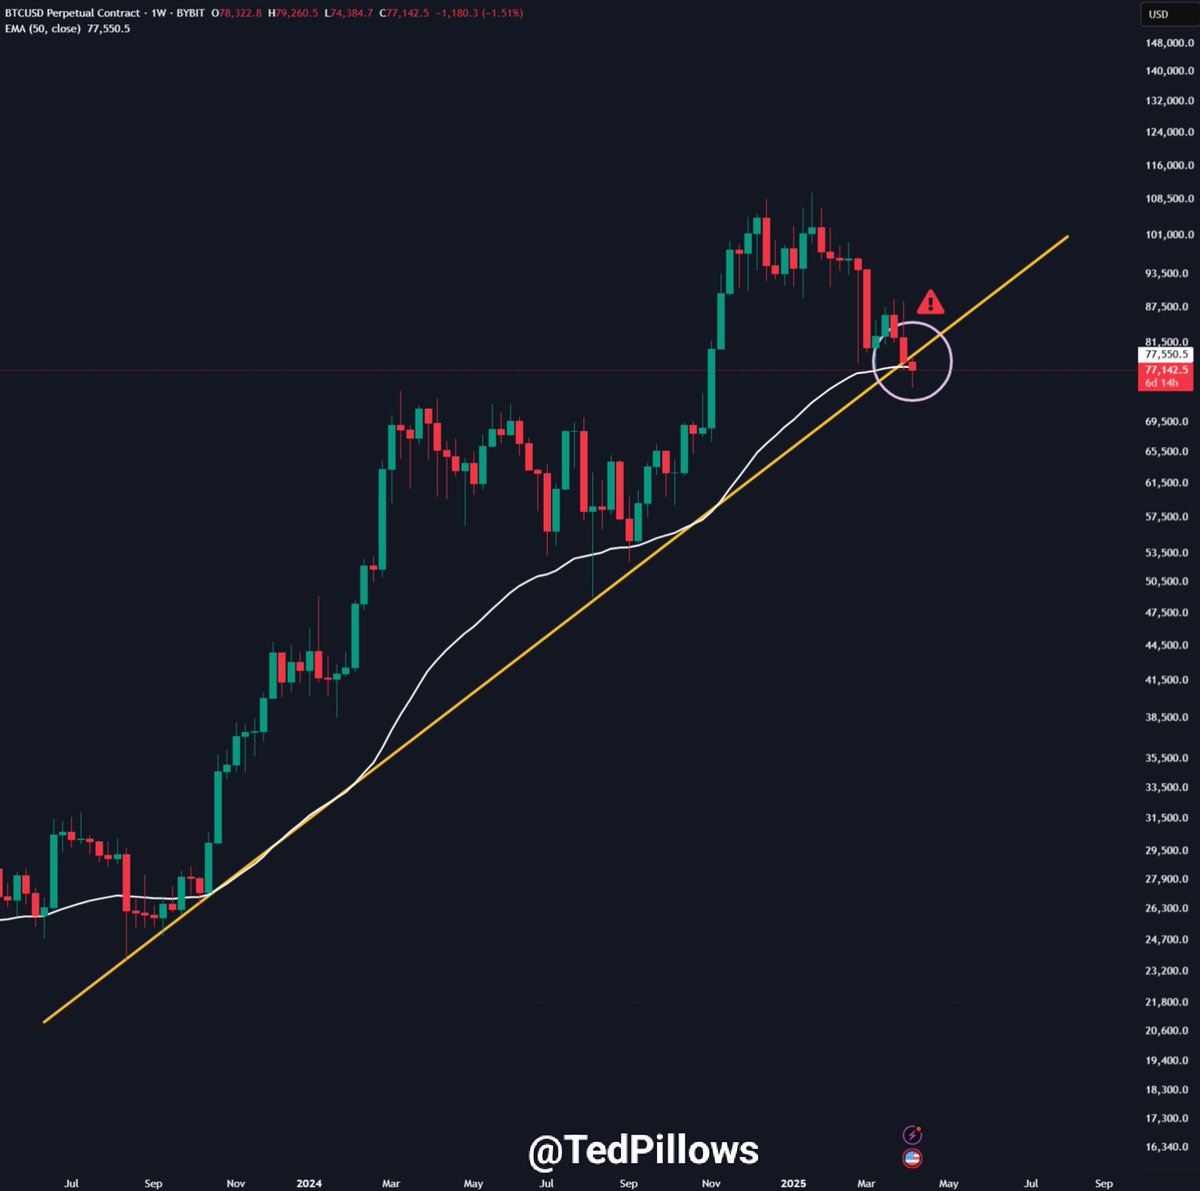
BTC/USD weekly price chart. Source: TradingView/Ted Pillows
If BTC fails to close back above it, Pillows warns of a potential decline toward the $69,000–$70,000 range, which aligns with the 2021 cycle highs. A further drop to $67,000, the average entry-level of Strategy’s Michael Saylor, also remains a possibility.
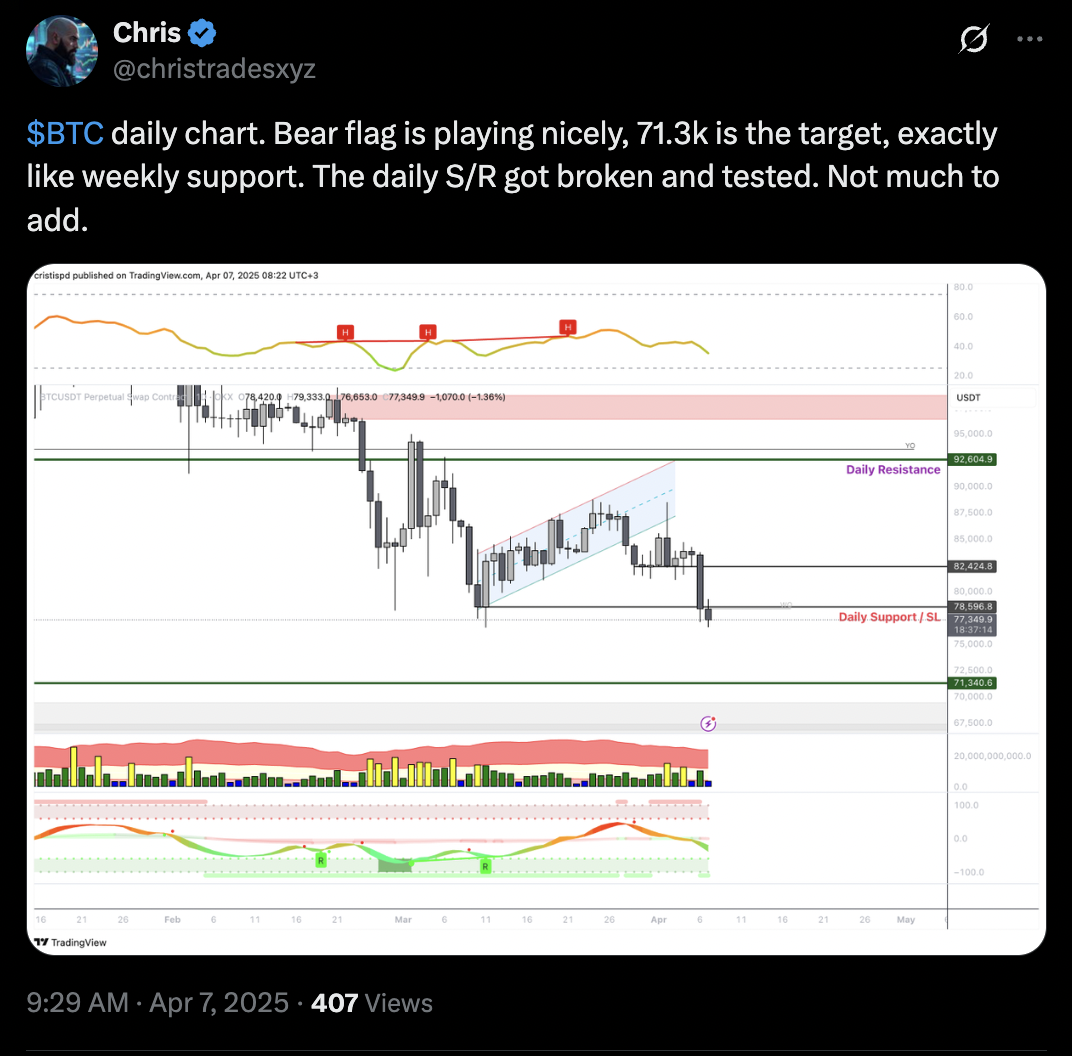
Source: @ChrisTradesXYZ
Bitcoin “max pain” target is near $69,000
Bitcoin appeared to have found short-term support at around $74,000, which corresponds to a notable cost-basis cluster where over 50,000 BTC are held.
Glassnode’s UTXO realized price distribution (URPD) heatmap shows this is the first major cost-basis cluster below $80,000. These holders raised their average buy price until March 10, then stopped moving coins—showing confidence, not panic.
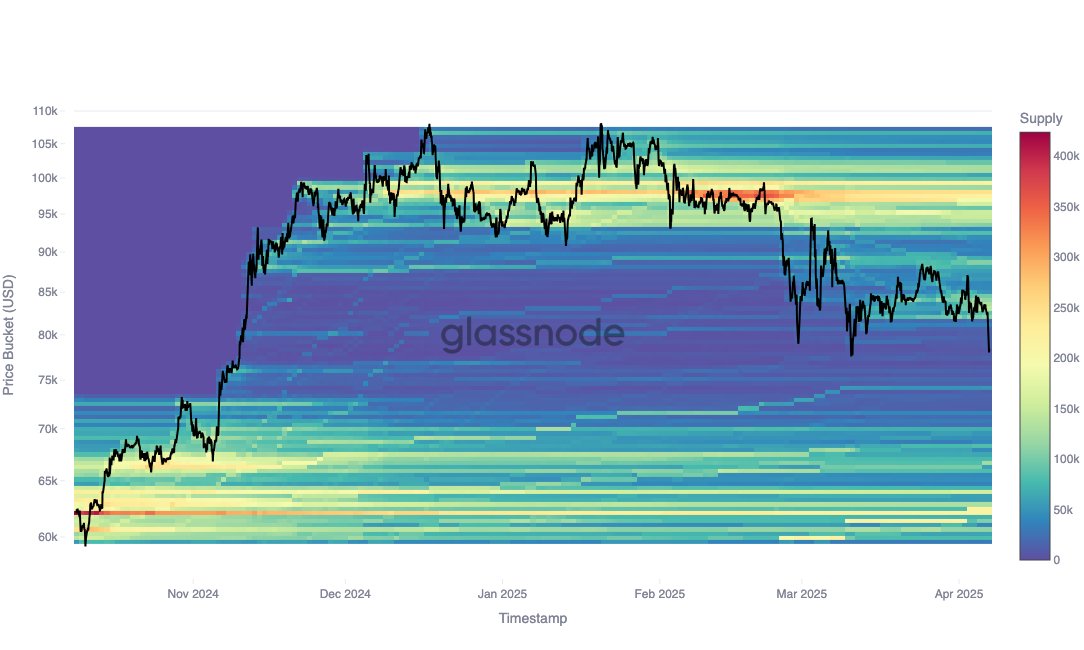
Bitcoin URPD heatmap. Source: Glassnode
Investors hold around 175,000 BTC in the $74,000–$70,000 range, creating a strong buffer zone. The largest cluster sits at $71,600, with 41,000 BTC concentrated there, making it the likely next support if $74,000 breaks.
Related: Black Monday 2.0? 5 things to know in Bitcoin this week
Meanwhile, Glassnode’s Short-Term Holder (STH) realized price bands place the current average STH cost basis at $89,000, with the -1 standard deviation band at $69,000.
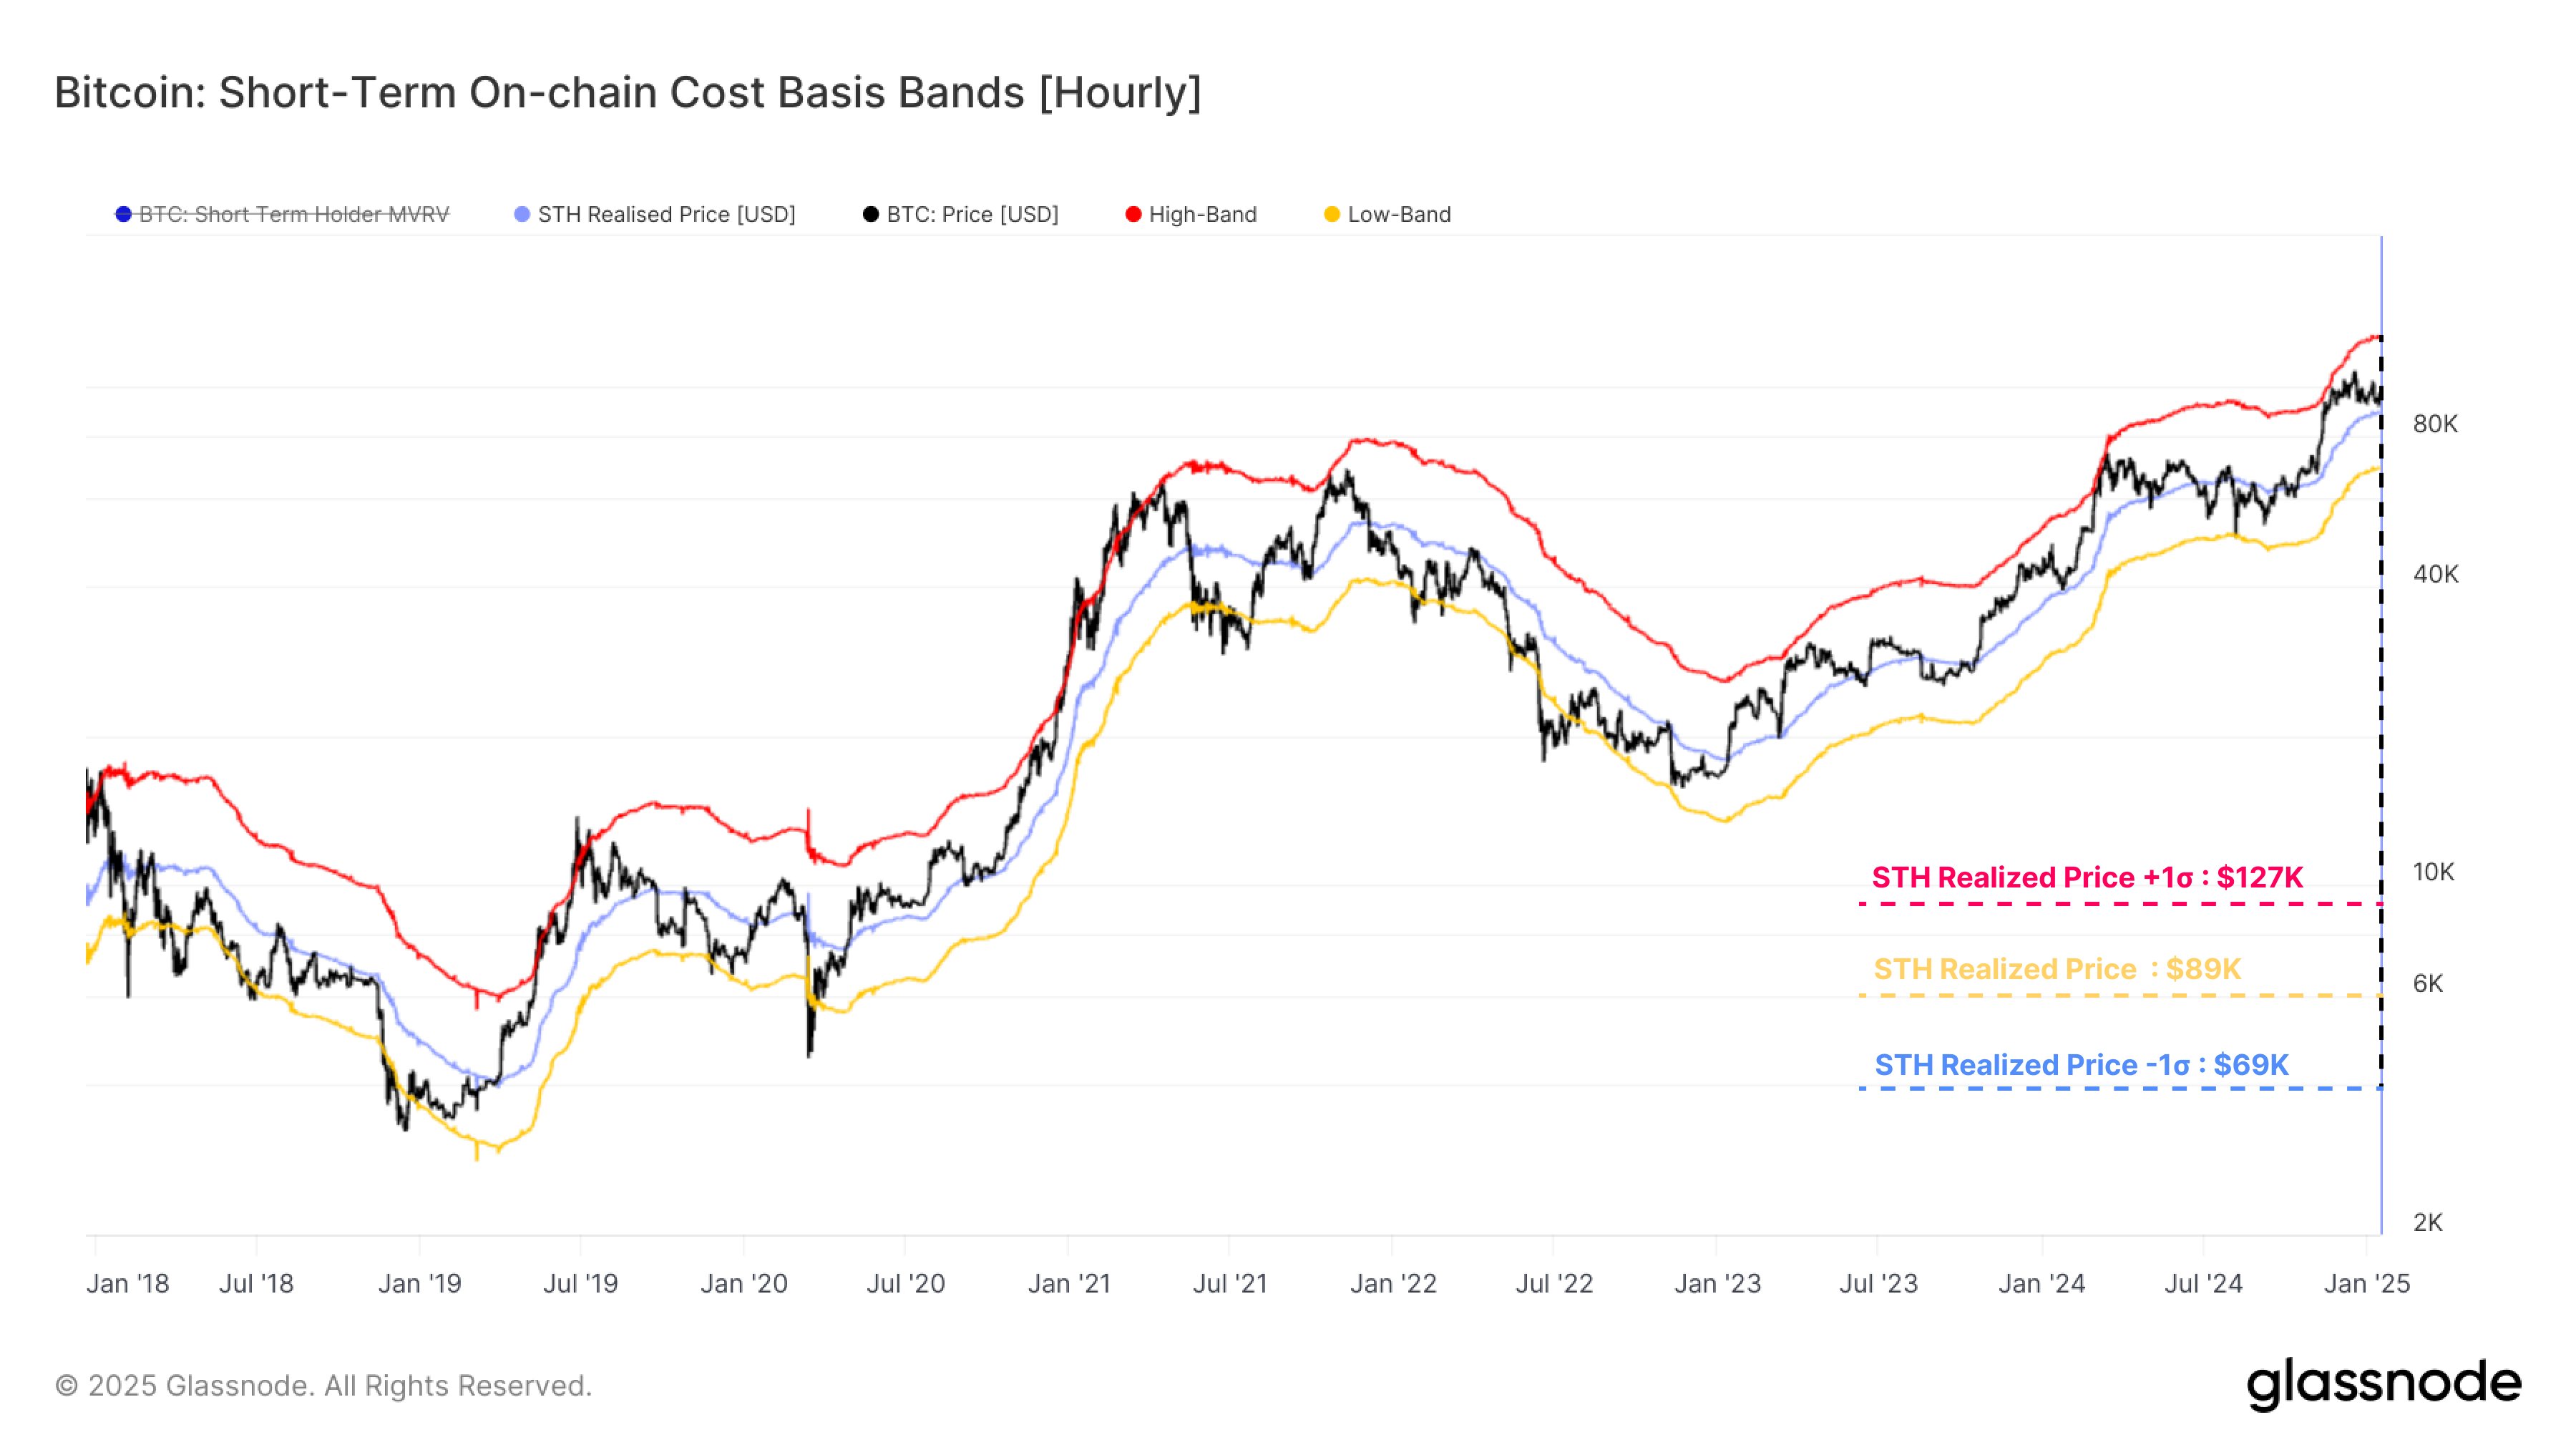
Bitcoin STH onchain cost basis bands. Source: Glassnode
This level has acted as a historical “max pain” zone for short-term investors during pullbacks in previous bull cycles, suggesting the $69,000 level is a floor where weak hands capitulate and long-term investors often step in.
A $50,000 Bitcoin price target cannot be ruled out
Historical patterns reveal Bitcoin entering a prolonged bear market after breaking decisively below the 50-week EMA support. In most cases, such corrections have led the price toward the 200-week EMA, as shown in red circular areas below.
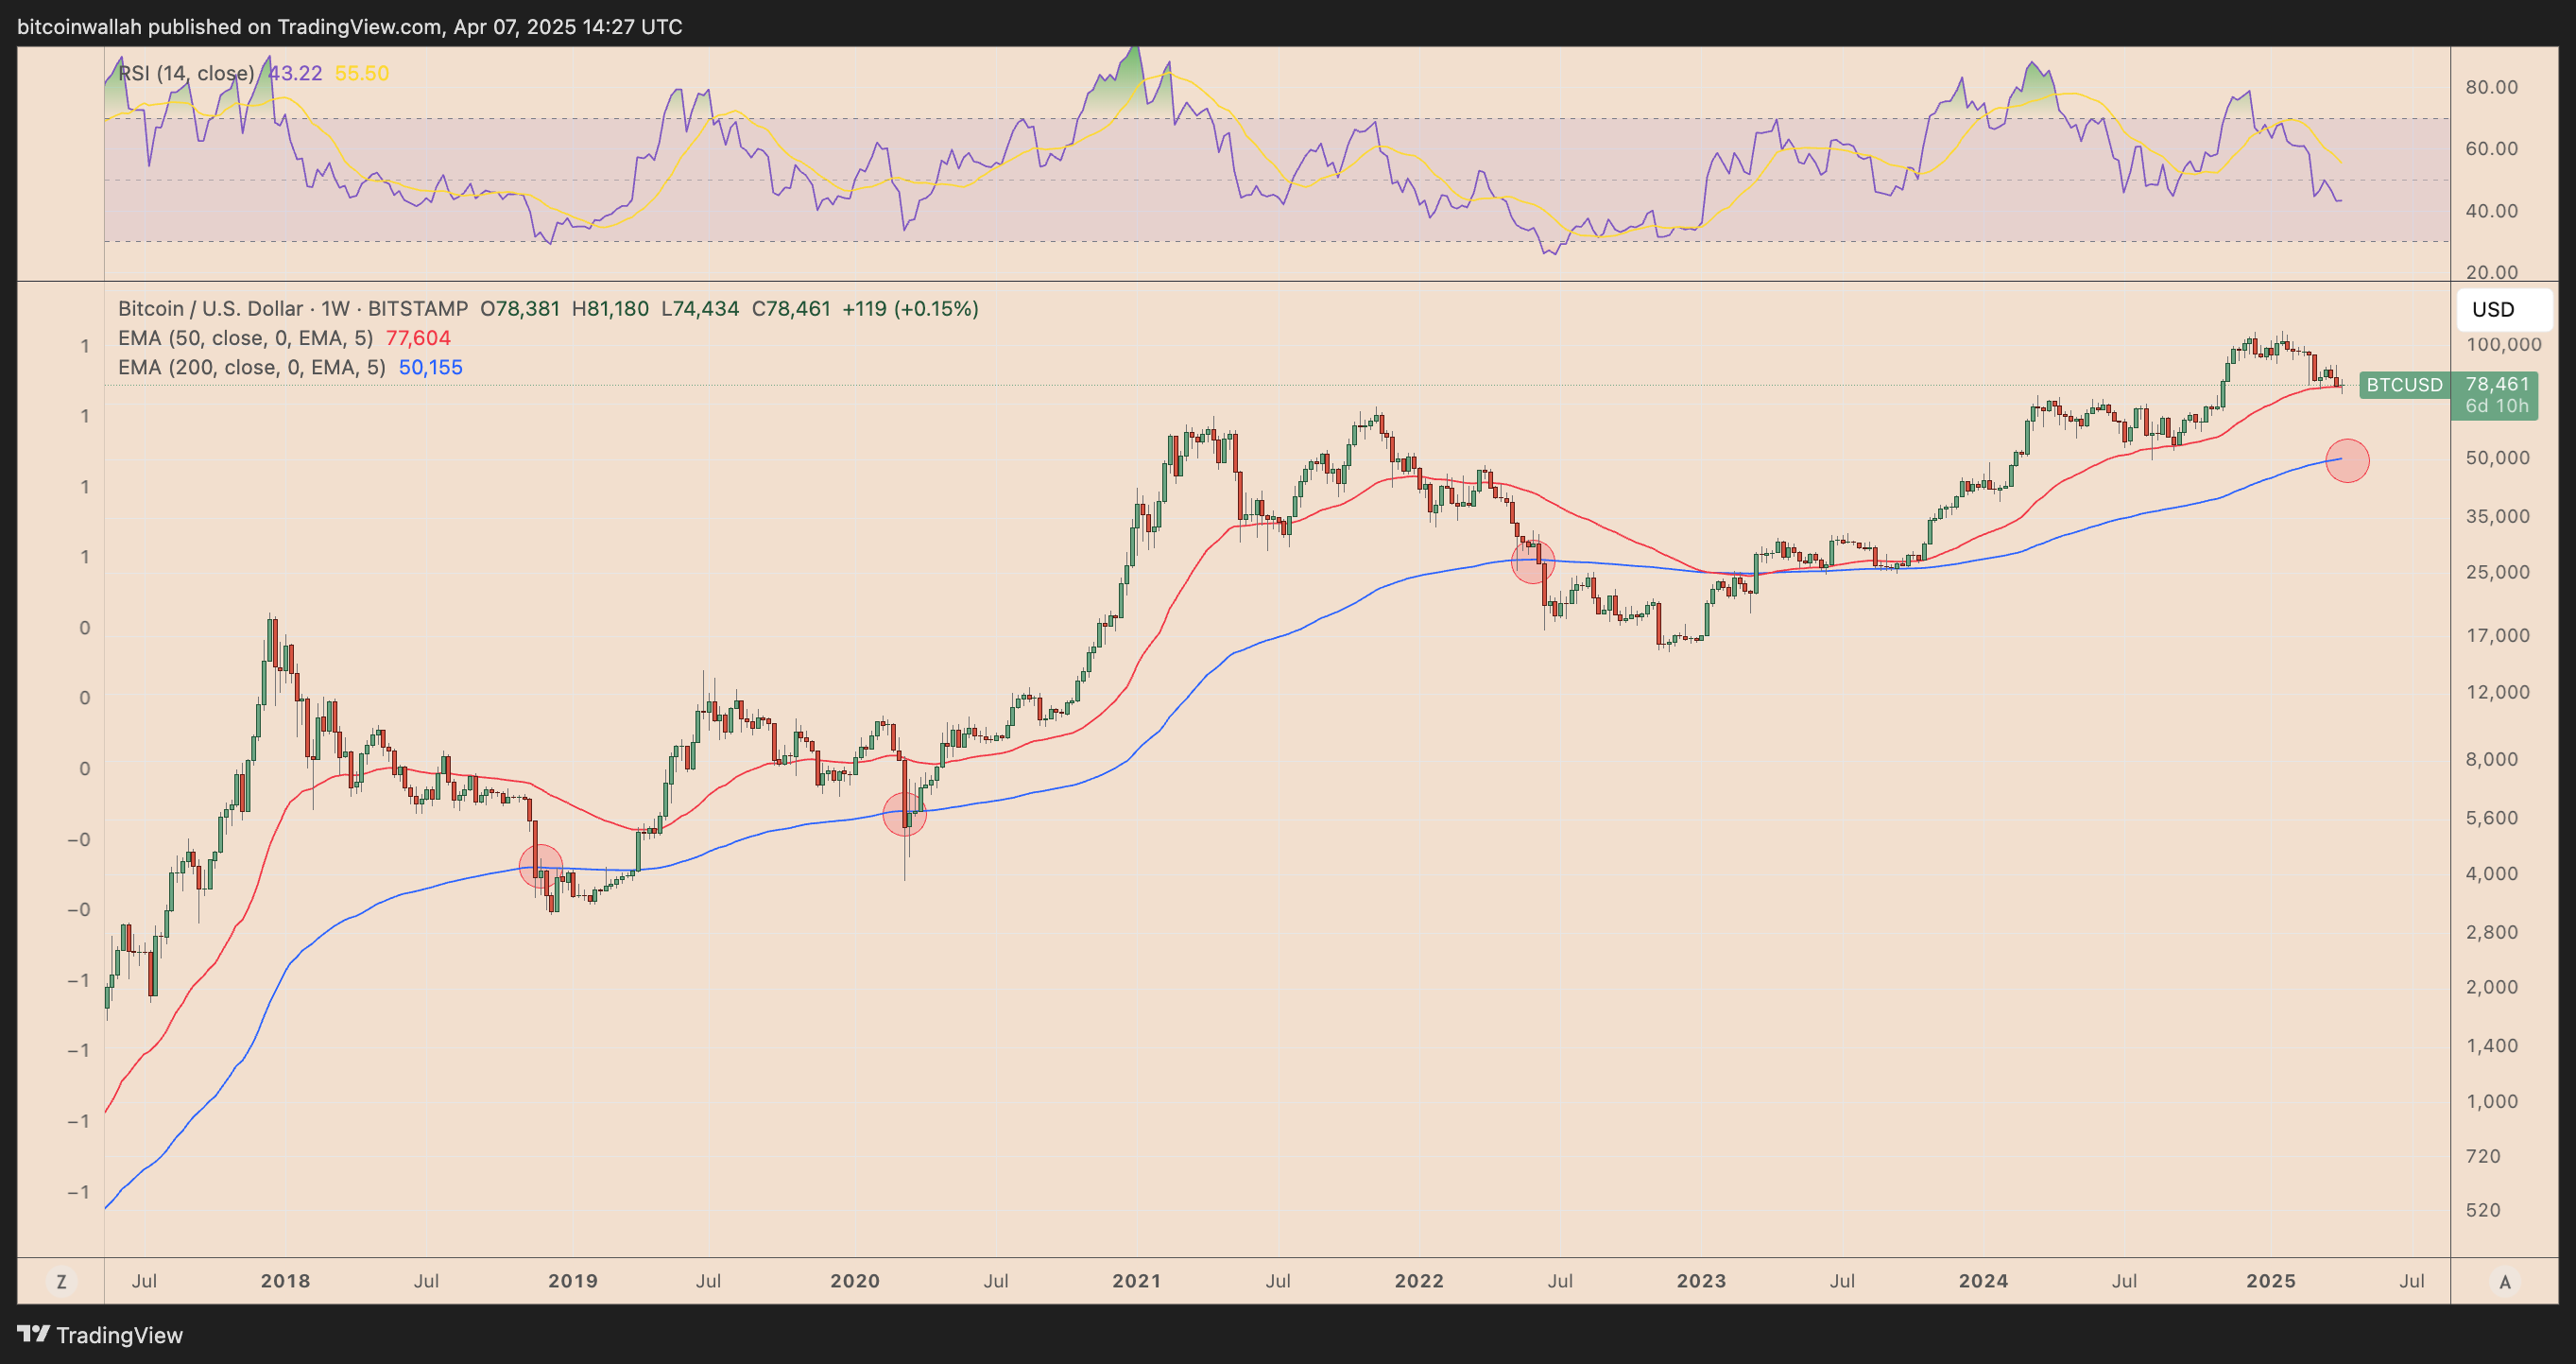
BTC/USD weekly price chart. Source: TradingView
If the fractal analysis plays out as intended, Bitcoin’s price target in the event of a 50-week EMA breakdown appears to be around $50,000, aligning with the 200-week EMA’s current positioning.
This article does not contain investment advice or recommendations. Every investment and trading move involves risk, and readers should conduct their own research when making a decision.
Source link

Billionaire Jack Dorsey Issues Bitcoin Warning, Says BTC Risks Becoming Irrelevant if This Happens

XRP Leveraged ETF Outshines Solana At Launch

Gaming Tokens Are Disappearing From Crypto’s Top 100—What Happened?

Bitcoin price could rally even as global trade war rages on — Here is why

Bitcoin Resilience Suggests Bullish Outlook as Dollar Weakens, Stagflation Looms — Grayscale

How To Watch OPNEXT On Bitcoin Magazine’s Livestream

XRP Breaks Out Of Head-And-Shoulders Pattern — Eyes Move Toward $1.30

4 charts that explain the ongoing Ethereum price crash

Economist Alex Krüger Warns US Stocks Could Repeat 2008 Bear Market Amid Trump’s Trade War

“Perfect Time to Buy” - Patterns Point to a Pepe Coin Price Resurgence
93% of WazirX Creditors Greenlight Post-Hack Recovery Plan

Double-edged sword during global market turmoil

BTC’s Haven Claim Hit as U.S., China Play Tariff Chicken

Zilliqa CEO steps down two months after X-Bridge exploit
Here’s Where Ethereum’s Last Line Of Defense Lies, According To On-Chain Data

Arthur Hayes, Murad’s Prediction For Meme Coins, AI & DeFi Coins For 2025

Expert Sees Bitcoin Dipping To $50K While Bullish Signs Persist

Aptos Leverages Chainlink To Enhance Scalability and Data Access

Bitcoin Could Rally to $80,000 on the Eve of US Elections

Crypto’s Big Trump Gamble Is Risky

Sonic Now ‘Golden Standard’ of Layer-2s After Scaling Transactions to 16,000+ per Second, Says Andre Cronje

Institutional Investors Go All In on Crypto as 57% Plan to Boost Allocations as Bull Run Heats Up, Sygnum Survey Reveals

Ripple-SEC Case Ends, But These 3 Rivals Could Jump 500x

Has The Bitcoin Price Already Peaked?

A16z-backed Espresso announces mainnet launch of core product

Xmas Altcoin Rally Insights by BNM Agent I

Blockchain groups challenge new broker reporting rule

The Future of Bitcoin: Scaling, Institutional Adoption, and Strategic Reserves with Rich Rines

I’m Grateful for Trump’s Embrace of Bitcoin
Trump’s Coin Is About As Revolutionary As OneCoin
 24/7 Cryptocurrency News5 months ago
Arthur Hayes, Murad’s Prediction For Meme Coins, AI & DeFi Coins For 2025
 Bitcoin3 months ago
Expert Sees Bitcoin Dipping To $50K While Bullish Signs Persist
 24/7 Cryptocurrency News3 months ago
Aptos Leverages Chainlink To Enhance Scalability and Data Access
 Bitcoin5 months ago
Bitcoin Could Rally to $80,000 on the Eve of US Elections
 Altcoins2 months ago
Sonic Now ‘Golden Standard’ of Layer-2s After Scaling Transactions to 16,000+ per Second, Says Andre Cronje
 Opinion5 months ago
Crypto’s Big Trump Gamble Is Risky
 Bitcoin5 months ago
Institutional Investors Go All In on Crypto as 57% Plan to Boost Allocations as Bull Run Heats Up, Sygnum Survey Reveals
- Price analysis5 months ago
Ripple-SEC Case Ends, But These 3 Rivals Could Jump 500x
