
BTC
Crypto Majors BTC, ETH, XRP Little Changed as HBO Calls Peter Todd the Bitcoin Creator
The HBO documentary “Money Electric: The Bitcoin Mystery” sparked significant interest and speculation in the cryptocurrency community about the identity of Bitcoin’s pseudonymous creator, Satoshi Nakamoto, in the past week. Nakamoto’s true identity, in theory, could be a sudden volatility-boosting event for crypto markets, and past attempts have been unfruitful.
Source link


Altcoin Season
End of Altcoin Season? Glassnode Co-Founders Warn Alts in Danger of Lagging Behind After Last Week’s Correction

The creators of the crypto analytics firm Glassnode are warning that altcoins could lose all bullish momentum following last week’s market correction.
Jan Happel and Yann Allemann, who go by the handle Negentropic on the social media platform X, tell their 63,400 followers that “altcoin season,” which they say began in late November, could come to an abrupt end after alts witnessed deep pullbacks over the last seven days.
According to the Glassnode co-founders, traders and investors will likely have a risk-off approach on altcoins unless Bitcoin recovers a key psychological price point.
“Is This the End of Altcoin Season?
Bitcoin dominance is surging after dipping below $100,000, while altcoins are losing critical supports. Dominance has risen and resumed its upward trend, signaling a stronger BTC environment.
If BTC stabilizes above $100,00, we might see a pump in altcoins now in accumulation zones. Until then, Bitcoin appears poised to lead, leaving altcoins lagging behind.”
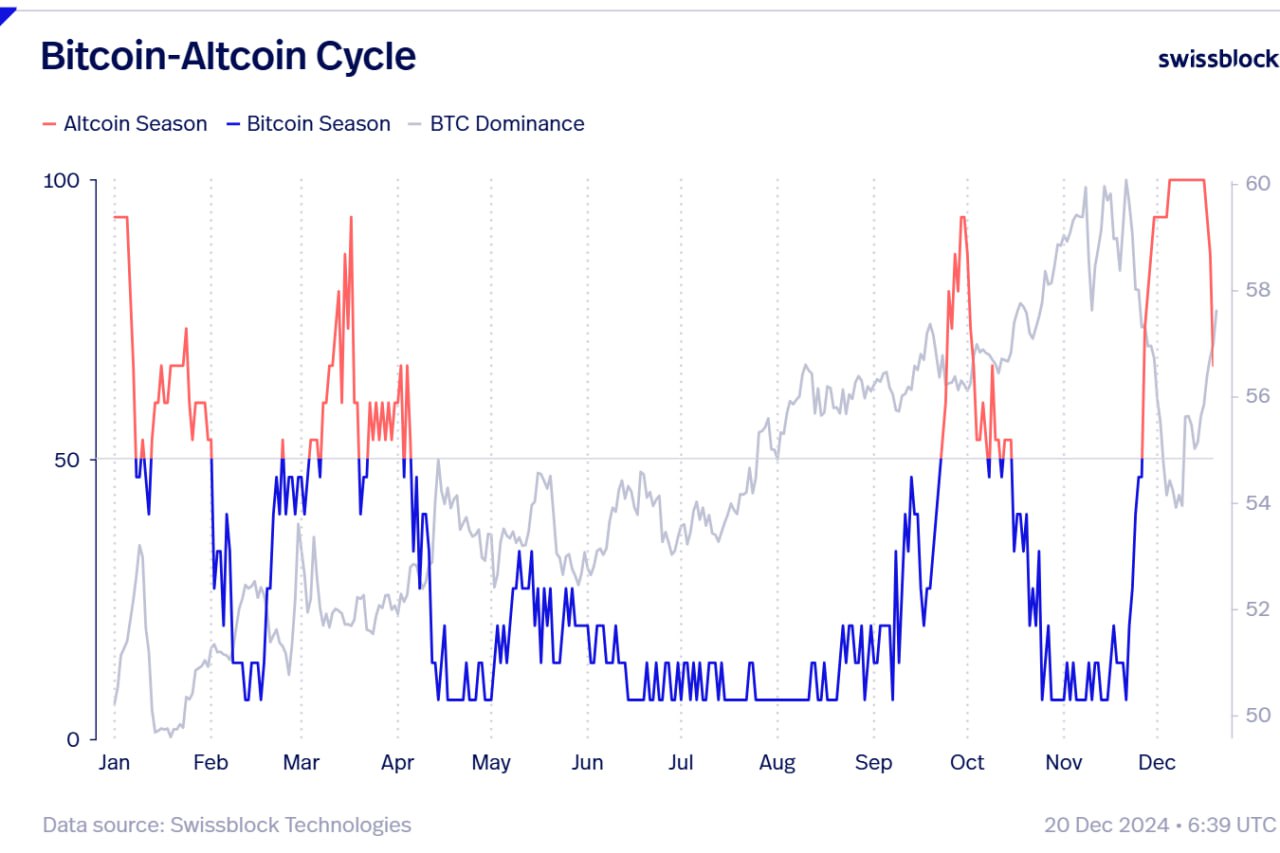
The Bitcoin Dominance (BTC.D) chart tracks how much of the total crypto market cap belongs to BTC. In the current state of the market, a surging BTC.D suggests that altcoins are losing value faster than Bitcoin.
At time of writing, BTC.D is hovering at 59%.
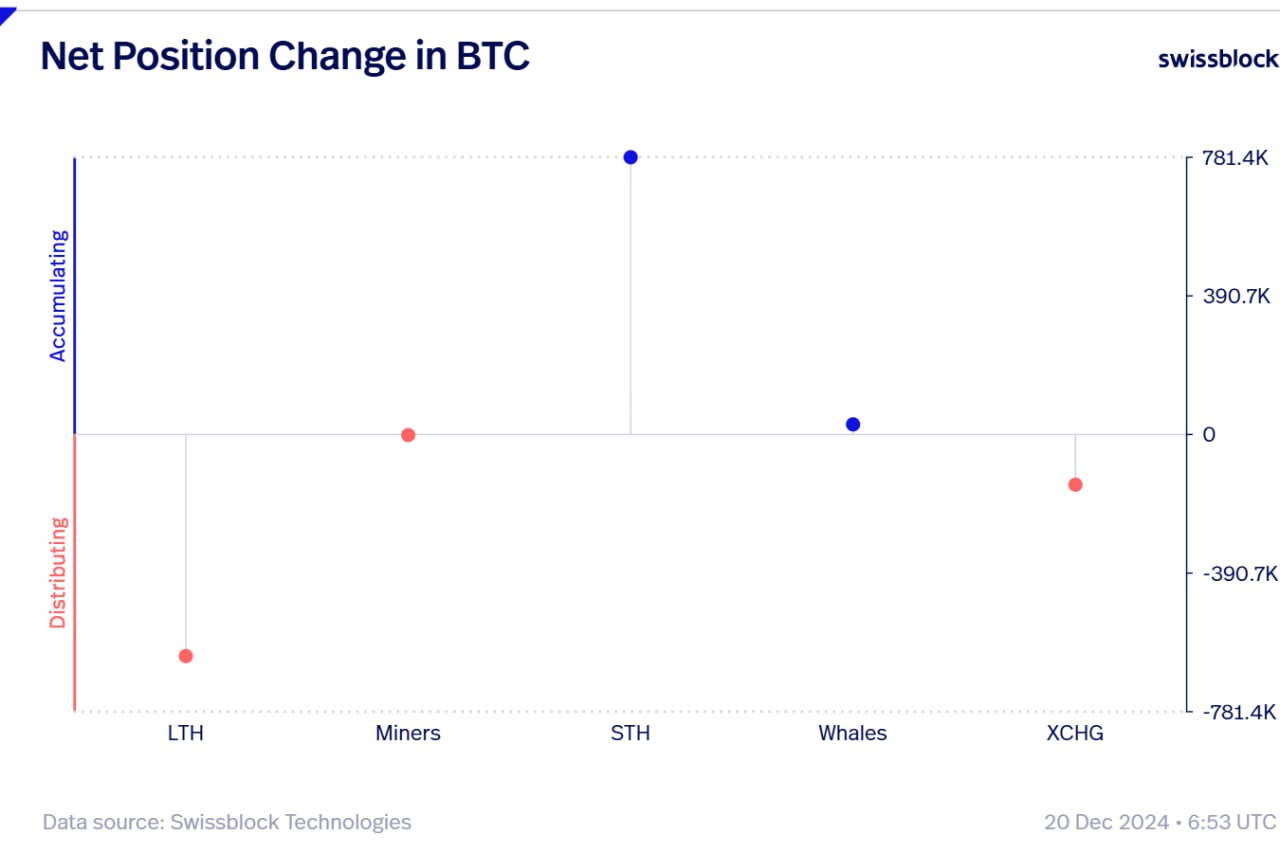
Looking at Bitcoin itself, the Glassnode executives say long-term Bitcoin holders are massively unloading their holdings as other investor cohorts pick up the slack.
“The Board Keeps Shifting.
As BTC continues flowing out of exchanges during this dip, long-term holders are exiting forcefully, while short-term holders step in without hesitation.
Whales quietly accumulate, miners remain neutral, and selling pressure has merely reshuffled the board.
New hands are absorbing the sales.”
At time of writing, Bitcoin is worth $97,246.
Don’t Miss a Beat – Subscribe to get email alerts delivered directly to your inbox
Check Price Action
Follow us on X, Facebook and Telegram
Surf The Daily Hodl Mix
 

Disclaimer: Opinions expressed at The Daily Hodl are not investment advice. Investors should do their due diligence before making any high-risk investments in Bitcoin, cryptocurrency or digital assets. Please be advised that your transfers and trades are at your own risk, and any losses you may incur are your responsibility. The Daily Hodl does not recommend the buying or selling of any cryptocurrencies or digital assets, nor is The Daily Hodl an investment advisor. Please note that The Daily Hodl participates in affiliate marketing.
Generated Image: DALLE3
Source link

The Bitcoin price is approaching the $100,000 level again after experiencing significant declines these past weeks. A crypto analyst has pointed out that the critical resistance level at $99,800 is crucial for Bitcoin’s next move. If the pioneer cryptocurrency can break through this level, it could trigger a significant breakout, potentially propelling Bitcoin past the $100,000 mark.
Related Reading
Bitcoin Price Faces Resistance At $99,800
Prominent crypto analyst Ali Martinez has shared a chart showing an In/Out of the Money Around Price (IOMAP) analysis of the distribution of Bitcoin wallets based on their purchase price. According to the analyst, the Bitcoin price is facing extreme resistance between the $97,500 and $99,800 price levels as it tries to breach $100,000 again.
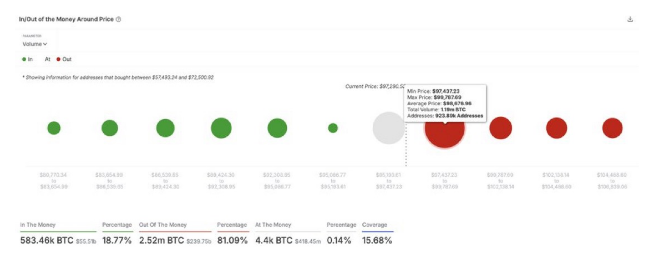
Martinez noted that around this price range, approximately 923,890 wallet addresses had purchased over 1.19 million BTC. This price zone acts as an important resistance level because many Bitcoin holders may look to sell and break even, potentially exerting selling pressure.
In the IOMAP chart shared by Martinez, the green dots that signal ‘In the Money’ represent price levels below the current Bitcoin price, where wallet holders are in profit because they bought BTC at a lower value. On the other hand, the red dots that represent ‘Out of the Money’ show price levels of Bitcoin’s present value, where wallet holders are at a loss because they bought BTC at a higher price.
Lastly, the white dot indicates ‘At the Money’ and represents the current price of Bitcoin at an average of $98,676, where some crypto wallets see neither profit nor loss.
Below Bitcoin’s current price, the chart shows strong buying zones, which could provide strong support if the pioneer cryptocurrency experiences a potential pullback. Martinez has forecasted that breaking through the critical resistance range between $97,500 and $99,800 would signal the start of a bullish rally for Bitcoin, potentially leading it to a new all-time high.
Currently, the Bitcoin price is trading at $98,652, steadily rising to return to previous highs above $100,000. To a new all-time high, Bitcoin will have to surge by over 7%, surpassing its present ATH above $104,000.
Related Reading
Bitcoin’s Biggest Gains To Come After Christmas
A popular crypto analyst identified as the ‘Crypto Rover’ has expressed optimism about Bitcoin’s near-term price potential this Q4. According to the analyst, Bitcoin has historically experienced its most significant gains right after Christmas during the halving years.
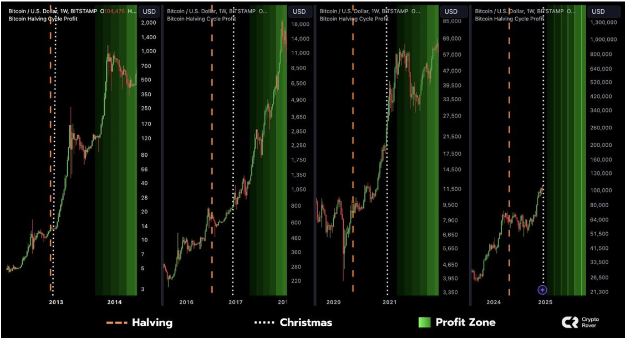
The analyst shared a price chart showing Bitcoin’s market performance during each halving cycle. In the 2012 halving year, Bitcoin started a significant price rally, which extended into the following year. The same bullish trend occurred in the next halving years in 2016 and 2020, with Bitcoin hitting exponential price highs.
Based on this historical trend, Crypto Rover projects that Bitcoin could witness a similar bullish surge before the end of 2024, with the rally potentially continuing into 2025.
Featured image from Bloomberg Images, chart from TradingView
Source link
Bitcoin, the leading cryptocurrency by market capitalization, has recently experienced a significant and sudden price correction, sparking debate among investors.
Concerns have surfaced about whether this downturn signals the conclusion of the current bull cycle or merely represents a temporary setback.
While short-term holders face losses, long-term metrics provide a broader perspective on Bitcoin’s trajectory, as analyzed by CryptoQuant’s Avocado Onchain in a recent report.
Opportunity Or End of The Bull Cycle?
According to Avocado Onchain, the realized price for investors who entered the market during Bitcoin’s recent peak at $98,000 places them in a loss-making position.
However, for those who invested between one to three months ago, the realized price is significantly lower at $71,000, offering a cushion against the current correction.

Avocado pointed out that historical patterns from Bitcoin’s 2021 bull cycle reveal similar alternations between record highs and sharp corrections, suggesting that these dips may not necessarily indicate the end of the cycle. Instead, they have historically been “opportunities” for market rebalancing and subsequent growth.
A key indicator analyzed is the 30-day moving average of the short-term SOPR (Spent Output Profit Ratio). This metric tracks whether recent market participants are selling at a profit or a loss.
The current SOPR data reveals that recent short-term inflows into Bitcoin have yet to result in substantial profit-taking. Unlike previous cycle peaks characterized by aggressive selling, the ongoing correction appears subdued, indicating that the market may still have room for upward movement.

Bitcoin Short-Term Dips vs. Long-Term Trends
Additionally, Avocado Onchain highlights the importance of distinguishing between short-term corrections and broader cycle trends. Bitcoin’s tendency to rebound after corrections in past bull cycles reinforces the notion that the current downturn might not mark the cycle’s end.
These insights align with the behaviour of long-term holders, who often use corrections to consolidate their positions, strengthening market resilience.
Avocado concluded the analysis, noting:
For investors who have yet to enter the market, this may be an excellent opportunity to buy Bitcoin at a discount. Instead of succumbing to panic selling during short-term downturns, adopting a long-term perspective and a dollar-cost averaging (DCA) strategy could be a more effective approach.
At the time of writing, Bitcoin is seeing a gradual rebound in its price surging by 1.3% in the past 1 hour. Regardless, the asset still appears to be overshadowed by the bears as BTC remains down by 3.5% in the past day and 10.5% from its peak of $108,135 recorded last week.
Featured image created with DALL-E, Chart from TradingView
Source link

Experts say these 3 altcoins will rally 3,000% soon, and XRP isn’t one of them

Robert Kiyosaki Hints At Economic Depression Ahead, What It Means For BTC?

BNB Steadies Above Support: Will Bullish Momentum Return?

Metaplanet makes largest Bitcoin bet, acquires nearly 620 BTC

Tron’s Justin Sun Offloads 50% ETH Holdings, Ethereum Price Crash Imminent?

Investors bet on this $0.0013 token destined to leave Cardano and Shiba Inu behind

End of Altcoin Season? Glassnode Co-Founders Warn Alts in Danger of Lagging Behind After Last Week’s Correction

Can Pi Network Price Triple Before 2024 Ends?

XRP’s $5, $10 goals are trending, but this altcoin with 7,400% potential takes the spotlight

CryptoQuant Hails Binance Reserve Amid High Leverage Trading

Trump Picks Bo Hines to Lead Presidential Crypto Council

The introduction of Hydra could see Cardano surpass Ethereum with 100,000 TPS

Top 4 Altcoins to Hold Before 2025 Alt Season

DeFi Protocol Usual’s Surge Catapults Hashnote’s Tokenized Treasury Over BlackRock’s BUIDL

DOGE & SHIB holders embrace Lightchain AI for its growth and unique sports-crypto vision
182267361726451435
Why Did Trump Change His Mind on Bitcoin?

Top Crypto News Headlines of The Week

New U.S. president must bring clarity to crypto regulation, analyst says

Will XRP Price Defend $0.5 Support If SEC Decides to Appeal?

Bitcoin Open-Source Development Takes The Stage In Nashville

Ethereum, Solana touch key levels as Bitcoin spikes

Bitcoin 20% Surge In 3 Weeks Teases Record-Breaking Potential

Ethereum Crash A Buying Opportunity? This Whale Thinks So

Shiba Inu Price Slips 4% as 3500% Burn Rate Surge Fails to Halt Correction

Washington financial watchdog warns of scam involving fake crypto ‘professors’

‘Hamster Kombat’ Airdrop Delayed as Pre-Market Trading for Telegram Game Expands

Citigroup Executive Steps Down To Explore Crypto
Mostbet Güvenilir Mi – Casino Bonus 2024

NoOnes Bitcoin Philosophy: Everyone Eats

 3 months ago
182267361726451435

 Donald Trump5 months ago
Why Did Trump Change His Mind on Bitcoin?
 24/7 Cryptocurrency News4 months ago
Top Crypto News Headlines of The Week
 News4 months ago
New U.S. president must bring clarity to crypto regulation, analyst says
 Price analysis4 months ago
Will XRP Price Defend $0.5 Support If SEC Decides to Appeal?
 Opinion5 months ago
Bitcoin Open-Source Development Takes The Stage In Nashville
 Bitcoin5 months ago
Ethereum, Solana touch key levels as Bitcoin spikes
 Bitcoin5 months ago
Bitcoin 20% Surge In 3 Weeks Teases Record-Breaking Potential
