
cryptocurrency
Crypto scammers nabbed in India for $700k fraud posing as a Japanese exchange


Law enforcement in India has arrested five suspects who allegedly duped a businessman out of roughly $700,000 via a fake cryptocurrency trading platform.
According to local media, the five suspects, including one woman, were taken into custody following an investigation by the cybercrime wing of Odisha’s Crime Branch.
The accused reportedly ran a scam using a bogus trading app called ZAIF, where they promised massive returns of up to 200% on digital currency investments. The trading platform was promoted as being based in Japan.
It’s worth noting that ZAIF is the name of a legitimate Japanese cryptocurrency exchange, which suffered a $60 million hack in 2022. However, the platform used in this scam is likely unaffiliated and merely borrowed the name to appear credible.
The fraud kicked off when the victim, an Indian businessman, was contacted on Facebook by a woman claiming to be a Hong Kong-based IBM software developer.
She gained his trust and convinced him to invest in crypto via ZAIF. Over a month, he transferred more than INR 6 crore (approximately $$699,352) across various accounts controlled by the scammers.
As is common in such crypto trading scams, the victim was initially shown fake profits on the platform to build trust. However, when the victim attempted to withdraw gains, the platform demanded an additional INR 89 lakh to unlock the funds — a tactic commonly referred to as an advance fee fraud.
Once the victim refused, the scammers vanished, cutting off contact.
Police tracked down the suspects through digital trails and banking records. Authorities seized phones, SIM cards, ID documents, and other incriminating materials during a raid.
With cryptocurrencies still operating in a grey area, India remains a hotspot for scams and fraud targeting unsuspecting users. Earlier this month, police cracked down on a similar scam that promoted a fake token called RSN and promised 2% daily returns. Losses were estimated to be between $1.14 and $2.29 million.
Source link


Reason to trust
![]()
Strict editorial policy that focuses on accuracy, relevance, and impartiality
Created by industry experts and meticulously reviewed
The highest standards in reporting and publishing
Strict editorial policy that focuses on accuracy, relevance, and impartiality
Morbi pretium leo et nisl aliquam mollis. Quisque arcu lorem, ultricies quis pellentesque nec, ullamcorper eu odio.
Bitcoin’s price action in the past 48 hours has seen it approaching the $80,000 price level again, with risks of breaking to the downside. Looking at on-chain data shows a notable support level between $80,920 and $78,000 that must not be broken.
Related Reading
Particularly, on-chain analytics from Glassnode point to a thinning of support at the $78,000 level, where only minimal cost basis clusters now exist. The insight follows a sharp move that saw savvy traders scoop up nearly 15,000 Bitcoin at the March 10 low before cashing out at the $87,000 local top.
Support Cushion Rises With Clusters Between $80,000 And $84,000
Bitcoin started the month of March with a crazy crash that saw its price hit below $77,000 on March 10 and March 11. Most of the month was spent by Bitcoin embarking on a recovery from this level, eventually reaching as high as $88,500 last week.
Interestingly, on-chain data from Glassnode shows that some Bitcoin traders took advantage of the crash and bought about 15,000 BTC at this low. However, many addresses from this same cohort sold at the $87,000 local top, leaving behind a depleted buffer zone that may no longer offer the same price stability.
Bitcoin’s strongest cost basis clusters have steadily migrated upward from $78,000 throughout the month, with the most prominent support levels now sitting between $80,920 and $84,100. Approximately 20,000 BTC were acquired at $80,920, 50,000 BTC at $82,090, and another 40,000 BTC at around $84,100. These fresh accumulations are now the new zones of confidence among recent buyers that may offer cushions for the recent market dip.
At the time of writing, Bitcoin is trading at $83,120, meaning that it has lost the zone of 40,000 BTC around $84,100. This puts the onus on $82,090 and, subsequently, the $80,920 price levels. However, if the correction sharpens further, it wouldn’t be until after $78,000 that structural support reappears at $74,000 and $71,000, where long-term conviction buying occurred, estimated at 49,000 BTC and 41,000 BTC, respectively.
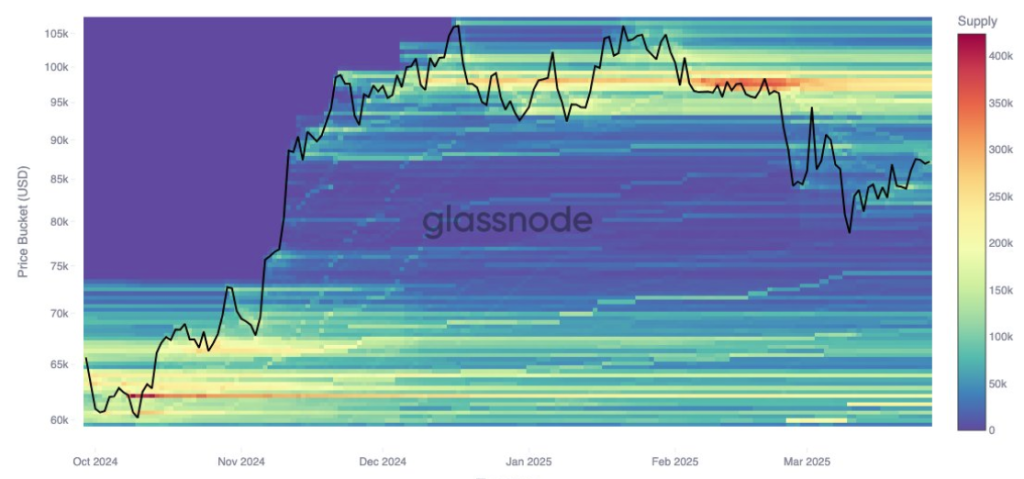
Image From X: Glassnode
$95,000 Cost Basis Cluster Grows With Cooling Demand
As support continues to climb gradually, resistance appears to be firming near the $95,000 mark. Investor cost basis data shows an increase of 12,000 BTC clustered at this level since March 24.
This implies that some investors now anticipate a top forming around $95,000, and selling activity could become more pronounced if prices approach that zone. This resistance, alongside the support levels, could see Bitcoin confined within a narrowing range in the short term.
Related Reading
Glassnode data confirms that long-term holders (addresses holding Bitcoin for more than 150 days) have been the primary source of profit-taking for a while. Long-term holders’ profit-taking is now nearly matched by the losses endured by short-term traders who have been holding Bitcoin for less than 155 days.
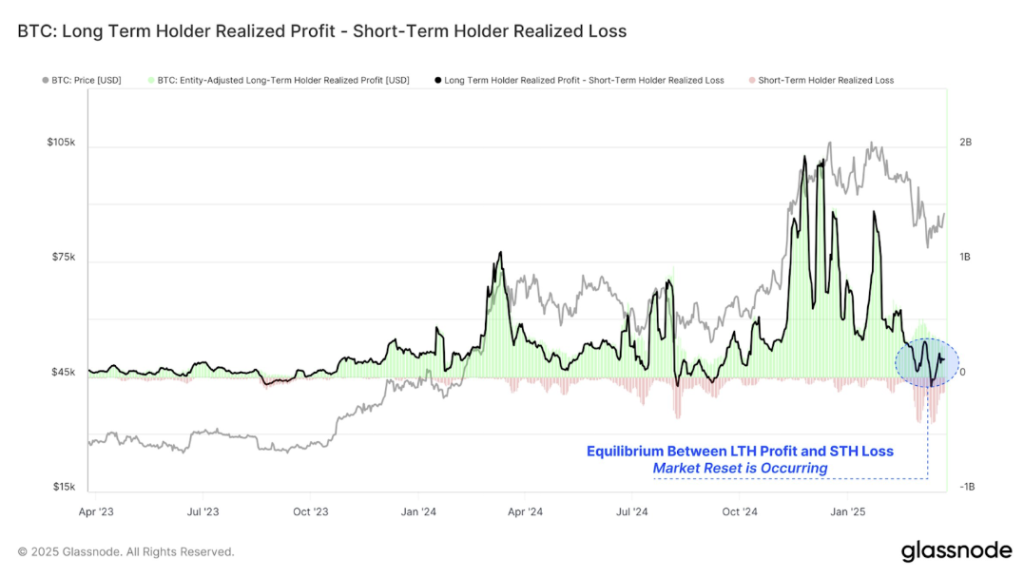
Image From X: Glassnode
Featured image from Tech Research Online, chart from TradingView
Source link

Reason to trust
![]()
Strict editorial policy that focuses on accuracy, relevance, and impartiality
Created by industry experts and meticulously reviewed
The highest standards in reporting and publishing
Strict editorial policy that focuses on accuracy, relevance, and impartiality
Morbi pretium leo et nisl aliquam mollis. Quisque arcu lorem, ultricies quis pellentesque nec, ullamcorper eu odio.
Bitcoin (BTC) is steadily approaching the highly anticipated Chicago Mercantile Exchange (CME) gap close, with price action aligning with analyst’s expectations of a move toward $83,000. As Bitcoin corrects from recent highs, a crypto analyst expects a rebound to come next. However, if key support fails, the possibility of further downside remains.
Bitcoin To Drop To CME Gap Close
Bitcoin has been on a rollercoaster this year, skyrocketing to new ATHs and experiencing major price breakdowns that pushed it to new lows. Recently the cryptocurrency saw a surge toward $89,000 but faced a rejection. Now the top crypto is pulling back again, with crypto analyst Astronomer on X (formerly Twitter) pinpointing the $83,000 – $84,000 low range as its next critical support level.
Related Reading
This crucial support zone in the price chart aligns with the CME gap close, a common phenomenon in the BTC Futures market. BTC revisits price gaps left when the CME price closes over the weekend and opens on Sundays.
Astronomer has outlined his long-term trading plan for Bitcoin, expecting the cryptocurrency to consolidate around the support level before bouncing. He believes that the CME gap close is a significant technical development that could determine Bitcoin’s price movements.
Supporting the expectations of a short-term pullback, historically, a bearish close on Friday often leads to red Mondays or Tuesdays for Bitcoin. Moreover, the analyst highlights that the market is still in the pre-New York Open (NYO) phase, leaving room for an intraday reversal.
However, he anticipates a late-night drop during the NYO trading session due to the lack of liquidations and untested support levels. He also mentions that combined with these factors, Bitcoin’s recent pullback from $89,000 is a strong indication that its price may not be bullish locally.
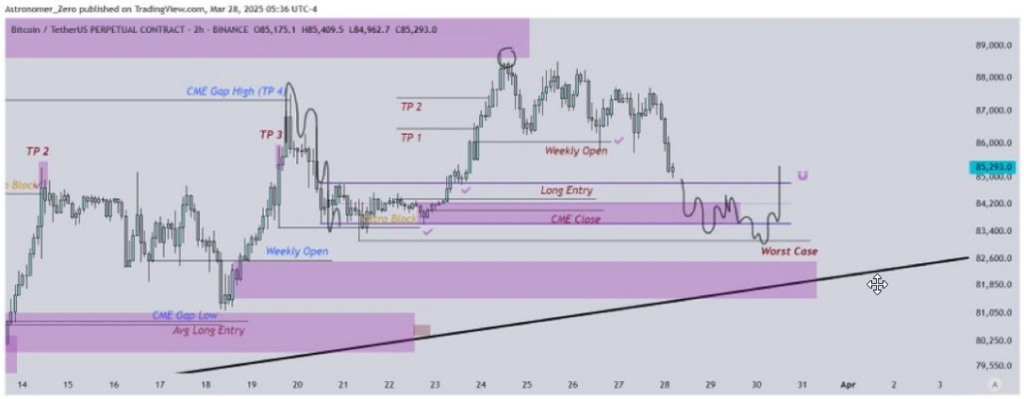
Based on his Bitcoin price chart, Astronomer considers the $81,400 – $82,400 range the worst-case support zone. Bitcoin is expected to revisit this target zone before any attempt at a potential reversal.
Can Bitcoin Rebound? Take Profit Levels To Watch
While Bitcoin’s short-term price action appears bearish, its macro trend remains somewhat stable, according to Astronomer’s analysis. The analyst has marked a “long entry” zone in the chart, suggesting that the $83,000 – $84,000 zone was a potential buying opportunity if Bitcoin finds support there.
Related Reading
The analyst predicts that if Bitcoin can successfully hold the CME gap close, a bounce toward the weekly open price at $86,000 could be its first step toward a much-anticipated recovery. Beyond this, the analyst has pinpointed key take profit levels marked from TP1 – TP4 on the price chart. These levels suggest that Bitcoin could surge higher to reach a target of $87,000 – $88,000.
However, a break below the worst-case support zone could trigger a bearish shift in sentiment, potentially leading to a deeper price correction for Bitcoin.
Featured image from Gemini Imagen, chart from TradingView
Source link

Dogecoin rallied nearly 10% this week, resilient in the face of the U.S. President Donald Trump’s tariff war and macroeconomic developments. Most altcoins have suffered the negative impact of Trump’s announcements, DOGE continues to gain, back above $0.2058 for the first time in nearly two weeks.
Dogecoin rallies in double-digits, what to expect from DOGE price?
Dogecoin (DOGE) hit a near two-week peak at $0.20585 on Wednesday, March 26. In the past seven days, DOGE rallied nearly 10%, even as altcoins struggled with recovery in the ongoing macroeconomic developments in the U.S.
The largest meme coin in the crypto market could continue its climb, extending gains by nearly 11%, and testing resistance at the lower boundary of the imbalance zone between $0.24040 and $0.21465.
The upper boundary of the zone at $0.24040 is the next key resistance for DOGE, nearly 24% above the current price.
Two key momentum indicators, the RSI and MACD support a bullish thesis for Dogecoin. RSI is 52, above the neutral level. MACD flashes green histogram bars above the neutral line, meaning there is an underlying positive momentum in Dogecoin price trend.

Dogecoin on-chain analysis
On-chain analysis of the largest meme coin shows that the number of holders of DOGE is on the rise. If Dogecoin’s number of holders keep climbing or steady in the coming week, the meme coin could remain relevant among traders.
The network realized profit/loss metric shows that DOGE holders have realized profits on a small scale. Typically, large scale profit-taking increases selling pressure on the meme coin and could negatively impact price.
The metric supports a bullish thesis for DOGE in the coming week. Dogecoin’s active address count has been steady since mid-March, another sign of the meme coin’s resilience.

DOGE derivatives analysis and price forecast
The analysis of Dogecoin derivatives positions across exchanges shows that open interest is recovering from its March 12 low. Open Interest is $1.98 billion, as Dogecoin trades at $0.19. Coinglass data shows a steady climb in OI in the chart below.

The total liquidations data shows $4.29 million in long positions were liquidated on March 27. Sidelined buyers need to watch liquidations data and prices closely before adding to their derivatives position.
The long/short ratio on top exchanges, Binance and OKX exceeds 1, meaning derivatives traders are betting on an increase in DOGE price.

When technical analysis and derivatives data is combined, it is likely Dogecoin price could test resistance at $0.21465 next week, if spot prices follow the cue of derivatives traders.
What to expect from DOGE
Dogecoin wallets holding between 1 million and 10 million DOGE tokens added to their portfolio consistently between March 10 and 27, while the other two categories, holding between 10 million and 100 million DOGE and 100 million and 1 billion DOGE tokens held nearly steady in the same timeframe.
The data from Santiment shows that DOGE’s traders holding between 1 million and 10 million tokens are rapidly accumulating, even as the token’s price rises. This supports demand for DOGE and a bullish thesis for the meme coin.

Dogecoin ETF and DOGE catalysts
DOGE holders are closely watching developments in Bitwise’s Dogecoin ETF filing with the SEC. The ETF filing is an effort to legitimize the meme coin as an investment category for institutional investors, as DOGE price holds steady among altcoins rapidly eroding in value.
Bitcoin flashcrashes dragged Dogecoin down with it, to a small extent, however the meme token recovered each time and consistent gains could signal an end to DOGE’s multi-month downward trend.
Other key catalysts for Dogecoin are positive updates in crypto regulation, passage of the stablecoin bill in the Congress, and demand for DOGE among whales and large wallet investors.
Disclosure: This article does not represent investment advice. The content and materials featured on this page are for educational purposes only.
Source link

MELANIA Insider Hayden Davis Selling Millions of Dollars Worth of Memecoin Amid 95% Drop: On-Chain Data

Toulouse starts to accept crypto for public transport

Bitcoin, Crypto Prices Slide as Trade Tensions, Inflation Risks Rattle Markets

Will BlackRock Investors Stay Bullish?

Bitcoin Could Appear on 25% of S&P 500 Balance Sheets by 2030, Analyst Says

Centralization and the dark side of asset tokenization — MEXC exec

Bitcoin Support Thins Below $78,000 As Cost Basis Clusters Shift Toward $95,000

Cryptocurrencies to watch this week: Solana, Cronos, DOT

EU Regulator Pushes for New Capital Rules for European Insurers Holding Crypto Assets

Japan Set To Classify Cryptocurrencies As Financial Products, Here’s All

This Week in Crypto Games: ‘Off the Grid’ Token, GameStop Goes Bitcoin, SEC Clears Immutable

Binance debuts centralized exchange to decentralized exchange trades

Why Is the Crypto Market Down Today? Bitcoin Drops to $82K as Traders Flee Risk Assets Amid Macro Worries

BTCFi: From passive asset to financial powerhouse?

Hyperliquid Delists $JELLY, Potentially Causing $900K in Losses. Here’s Why Best Wallet Token Can 100x


 24/7 Cryptocurrency News5 months ago
Arthur Hayes, Murad’s Prediction For Meme Coins, AI & DeFi Coins For 2025

 Bitcoin2 months ago
Expert Sees Bitcoin Dipping To $50K While Bullish Signs Persist

 24/7 Cryptocurrency News3 months ago
Aptos Leverages Chainlink To Enhance Scalability and Data Access

 Bitcoin5 months ago
Bitcoin Could Rally to $80,000 on the Eve of US Elections

 Altcoins2 months ago
Sonic Now ‘Golden Standard’ of Layer-2s After Scaling Transactions to 16,000+ per Second, Says Andre Cronje

 Bitcoin5 months ago
Institutional Investors Go All In on Crypto as 57% Plan to Boost Allocations as Bull Run Heats Up, Sygnum Survey Reveals

 Opinion5 months ago
Crypto’s Big Trump Gamble Is Risky

 Price analysis5 months ago
Ripple-SEC Case Ends, But These 3 Rivals Could Jump 500x
