Altcoin
Dogecoin To $1.35? Analyst Predicts Milestone ‘Within 70 Days’
Published
2 months agoon
By
admin
Analysts predict a large price gain for Dogecoin (DOGE) in the upcoming months, putting the meme coin back in the spotlight. Some analysts believe DOGE will reach $1.35 by mid-April, a significant rise from its current price of about $0.27, as the cryptocurrency market recovers. The popular meme crypto will rise by about 400% and reach new heights if this prediction comes to fruition.
Market Vigor Feeds DOGE Optimism
As Bitcoin leads the push above $57,000, the broader market for cryptocurrencies has been heating up. Historically, meme cryptos like Dogecoin have benefited from Bitcoin’s ascent; typically matching its speed with steady but notable increases.
Given the daily transactions of about $1.5 billion, the recent increase in DOGE trading volume points to significant investor demand. This increase in activity is evidence of traders preparing for a major breakout.
Past Patterns Point To A Bullish Cycle
Following the halving events of Bitcoin, Dogecoin has a history of dramatically climbing during bull markets. Celebrity sponsorships and social media buzz drove DOGE from $0.05 to $0.74 in a few months in 2021. Though the current cycle may not follow that same path, past numbers indicate that, in favorable market conditions, the meme coin has the capacity to recover rather dramatically.
Cryptocurrency analyst Master Kenobi predicts that Dogecoin might reach $1.35 “within 70 days” from the February 3rd lows. This forecast is in line with mid-April, a crucial time frame that falls one year after the Bitcoin halving event.
The cryptocurrency market had a significant upswing during the previous halving cycle, and this might happen again, pushing Dogecoin to a market valuation of almost $200 billion.
#DOGE to $1.35 within 70 days from the February 3rd lows, if it follows the timing of the last cycle.
This aligns with mid-April. Do you remember? Exactly one year since the Bitcoin halving, just like it happened in the last cycle.
This means a market capitalization of… https://t.co/BOGD9AbFlK pic.twitter.com/DuOf9rLhNx— Master Kenobi (@btc_MasterPlan) February 15, 2025
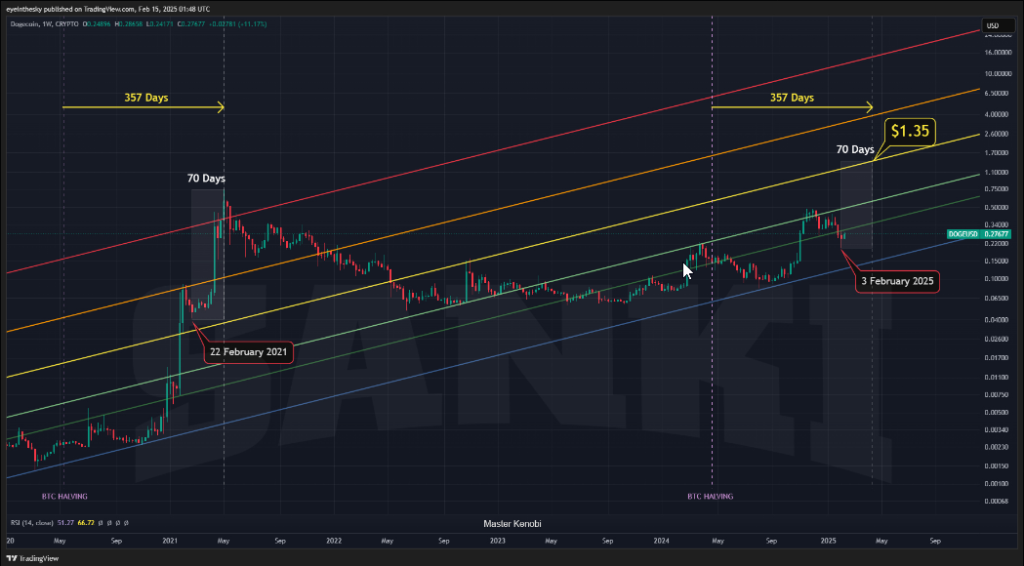
Important Levels Of Support, Resistance To Monitor
Before DOGE can hit $1.35, it needs to get past some strong resistance. Analysts see $0.30 and $0.45 as important levels to check before a big move toward $1. The support level at $0.20 is still strong on the downside, and it serves as a safety net in case there is a short drop. A steady rise to $1.35 could happen if people keep buying at these prices.
Weigh The Hype Carefully
Even though people are optimistic, buyers should be careful. The cryptocurrency market is still very unstable. Dogecoin has a strong community behind it, but it still lacks fundamental utility compared to other big cryptocurrencies.
Since speculation still influences its price, abrupt declines are always a possibility. For those hoping to profit from the possible rally, risk management is crucial.
Everyone will be keeping an eye on Dogecoin as April approaches to see if it can surprise them all once more. Regardless of whether DOGE reaches $1.35 or not, the future seems bright for both traders and holders.
Featured image from Pexels, chart from TradingView
Source link
You may like


XRP Price Reversal Toward $3.5 In The Works With Short And Long-Term Targets Revealed


Former New York governor advised OKX over $505M federal probe: Report


First Digital USD (FDUSD) Depegs After Justin Sun Alleges Firm Is ‘Insolvent’ and Not Fulfilling Redemptions


Gen Z’s Bitcoin Bet, The Largest Wealth Transfer In History?


Trump’s Crypto Conflicts Dominate Stablecoin Legislation Debate


First Digital denies allegations, threatens legal action
Accumulation Phase
XRP Price Reversal Toward $3.5 In The Works With Short And Long-Term Targets Revealed
Published
30 minutes agoon
April 3, 2025By
admin
Reason to trust

Strict editorial policy that focuses on accuracy, relevance, and impartiality
Created by industry experts and meticulously reviewed
The highest standards in reporting and publishing
Strict editorial policy that focuses on accuracy, relevance, and impartiality
Morbi pretium leo et nisl aliquam mollis. Quisque arcu lorem, ultricies quis pellentesque nec, ullamcorper eu odio.
The XRP price is showing signs of a strong bullish reversal, with a crypto analyst predicting a potential rebound toward $3.5 and even higher. After experiencing significant volatility and undergoing a consolidation due to recent price declines, technical indicators now show support for XRP’s bullish outlook. As a result, the analyst has provided a short—and long-term price target for the cryptocurrency.
XRP Price Projected To Reverse To $3.5
According to ‘Setupsfx’, a crypto analyst on TradingView, XRP is now in a bullish reversal phase, meaning its price is expected to break out of its recent downturn and rise to new highs. Based on the expert’s chart analysis of XRP, the cryptocurrency is predicted to see an explosive increase to $3.5 following the end of its consolidation phase.
Related Reading
The chart indicates that the price of XRP is expected to rise to $3.5 in the coming months. However, from a fundamental analysis perspective, the analyst believes XRP is not limited to this bullish price target and could potentially surpass it to exceed current all-time highs of $3.84.
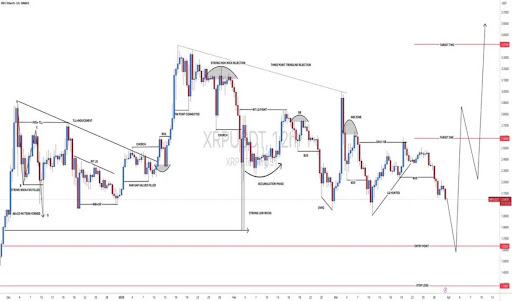
While the TradingView expert’s analysis of XRP maintains a neutral stance, implying uncertainty in the trend, he has also emphasized the cryptocurrency’s strong potential for growth. Hence, XRP could experience significant upward movement if market conditions align favorably and investor sentiment and confidence strengthen.
For his short-term price target, the crypto analyst forecasts that XRP could rally to a level above $3.5. He advises traders who intend to hold their positions for a short period to aim for this price level, as it could be a strategic exit point before a potential pullback.
Notably, the analyst’s long-term price target for XRP has been set at $4.0 or higher. Considering XRP’s price is currently trading at $2.09, a surge to $4 would represent an almost 100% increase in its price.
Technical Elements Supporting Bullish Reversal
In his chart analysis, Setupsfx highlights XRP’s price action in a 12-hour time frame, showcasing key movements, trends, and technical elements that support his bullish projection. These elements include liquidity and IMB zones, which are areas where price action is expected due to pending orders.
Related Reading
The analyst also highlights an accumulation phase, as XRP has been consolidating at lower levels, signaling the possibility of a potential breakout. The appearance of strong low wicks further indicates that buyers are regaining control of the market.
Finally, the TradingView analyst has indicated that the altcoin has already undergone a three-point trendline rejection, which means it has tested and rejected a resistance level multiple times. The expert’s price chart also provides an ideal entry point for both short and long-term traders, marked at $1.8. A stop loss has also been placed significantly lower around $1.2 to minimize potential losses.
Featured image from iStock, chart from Tradingview.com
Source link
adx
Bitcoin And Altcoins Fischer Transform Indicator Turn Bearish For The First Time Since 2021
Published
1 day agoon
April 1, 2025By
adminReason to trust

Strict editorial policy that focuses on accuracy, relevance, and impartiality
Created by industry experts and meticulously reviewed
The highest standards in reporting and publishing
Strict editorial policy that focuses on accuracy, relevance, and impartiality
Morbi pretium leo et nisl aliquam mollis. Quisque arcu lorem, ultricies quis pellentesque nec, ullamcorper eu odio.
Technical expert Tony Severino has warned that the Bitcoin and altcoins Fischer Transform indicator has flipped bearish for the first time since 2021. The analyst also revealed the implications of this development and how exactly it could impact these crypto assets.
Bitcoin And Altcoins Fischer Transform Indicator Turns Bearish
In an X post, Severino revealed that the total crypto market cap 12-week Fisher Transform has flipped bearish for the first time since December 2021. Before then, the indicator had flipped bearish in January 2018. In 2021 and 2018, the total crypto market cap dropped 66% and 82%, respectively. This provides a bearish outlook for Bitcoin and altcoins, suggesting they could suffer a massive crash soon enough.
Related Reading
In another X post, the technical expert revealed that Bitcoin’s 12-week Fischer Transform has also flipped bearish. Severino noted that this indicator converts prices into a Gaussian normal distribution to smooth out price data and filter out noise. In the process, it helps generate clear signals that help pinpoint major market turning points.
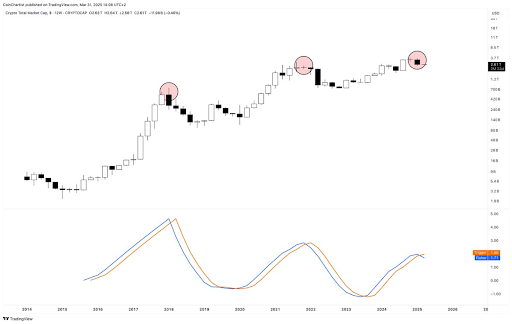
Severino asserted that this indicator on the 12-week timeframe has never missed a top or bottom call, indicating that Bitcoin and altcoins may have indeed topped out. The expert has been warning for a while now that the Bitcoin top might be in and that a massive crash could be on the horizon for the flagship crypto.
He recently alluded to the Elliott Wave Theory and market cycles to explain why he is no longer bullish on Bitcoin and altcoins. He also highlighted other indicators, such as the Parabolic SAR (Stop and Reverse) and Average Directional Index (ADX), to show that BTC’s bullish momentum is fading. The expert also warned that a sell signal could send BTC into a Supertrend DownTrend, with the flagship crypto dropping to as low as $22,000.
A Different Perspective For BTC
Crypto analyst Kevin Capital has provided a different perspective on Bitcoin’s price action. While noting that BTC is in a correctional phase, he affirmed that it will soon be over. Kevin Capital claimed that the question is not whether this phase will end. Instead, it is about how strong Bitcoin’s bounce will be and whether the flagship crypto will make new highs or record a lackluster lower high followed by a bear market.
Related Reading
The analyst added that Bitcoin’s price action when that time comes will also be trackable using other methods, such as money flow, macro fundamentals, and overall spot volume. The major focus is on the macro fundamentals as market participants look forward to Donald Trump’s much-anticipated reciprocal tariffs, which will be announced tomorrow.
At the time of writing, the Bitcoin price is trading at around $83,000, up around 1% in the last 24 hours, according to data from CoinMarketCap.
Featured image from Unsplash, chart from Tradingview.com
Source link
Altcoin
Cryptocurrencies to watch this week: Solana, Cronos, DOT
Published
3 days agoon
March 30, 2025By
admin
Cryptocurrencies will likely be volatile this week once President Donald Trump’s reciprocal tariffs go into effect and the U.S. publishes nonfarm payroll data.
The week started on a dull note, with most coins remaining in a bear market. At last check, Bitcoin (BTC) had dropped to $82,432.00.
The crypto fear and greed index has slumped to the fear zone 25. Some of the top cryptocurrencies to watch this week are Solana, Polkadot, and Cronos.
Solana
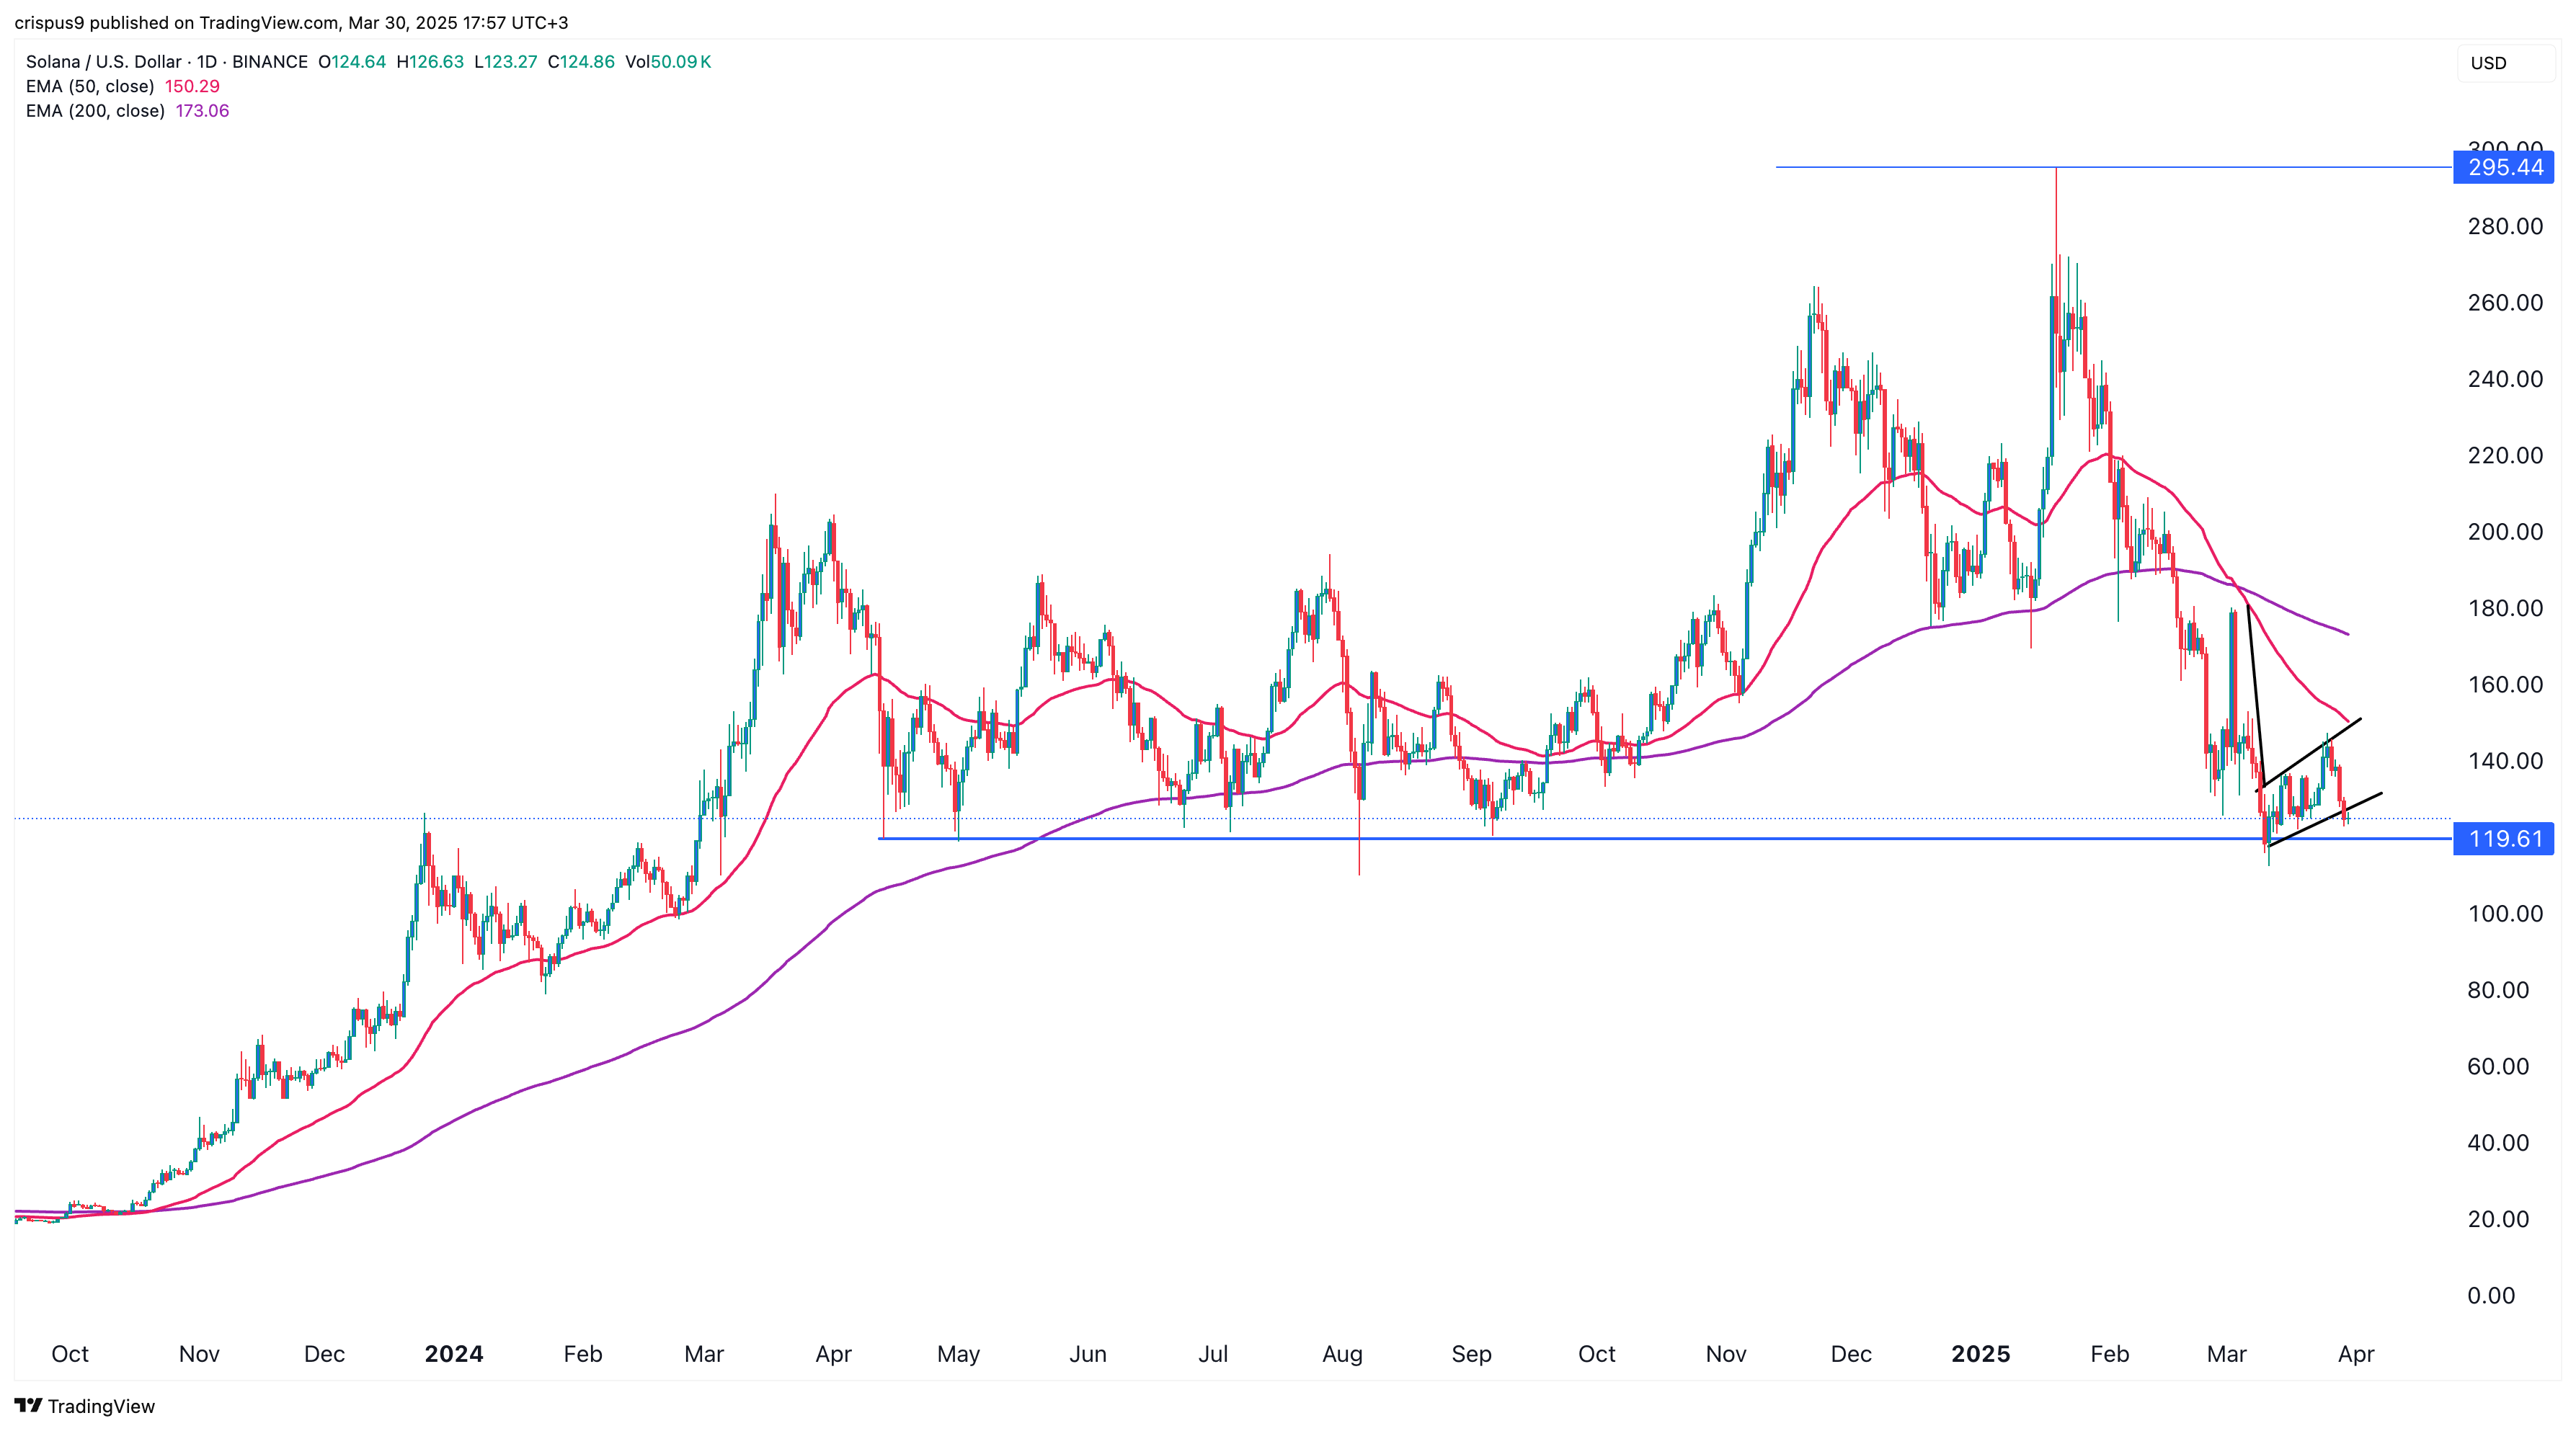
Solana (SOL), the popular layer-1 network, will be in the spotlight this week since its price is hovering above the key support level at $119.5. As shown above, it has failed to drop below this level several times since April last year, a sign that bears have been afraid of shorting below it.
Therefore, a drop below $119.5 will confirm a bearish breakdown and point to further downside. Besides, the Solana price formed a death cross pattern on March 3 as the 50-day and 200-day moving averages crossed each other.
A drop below $119.6 indicates a further drop to $100.
Cronos
Cronos, formerly Crypto.com, will be one of the top cryptocurrencies to watch this week because of its strong performance last week. It jumped by 30% in the last seven days, and by 54% from its lowest point this year.
Cronos price has bounced back after Crypto.com partnered with Donald Trump’s Trump Media to launch ETFs. It also rose after the community voted to allow the creation of another 70 billion CRO tokens, which will be used to create a Strategic Crypto Reserve.
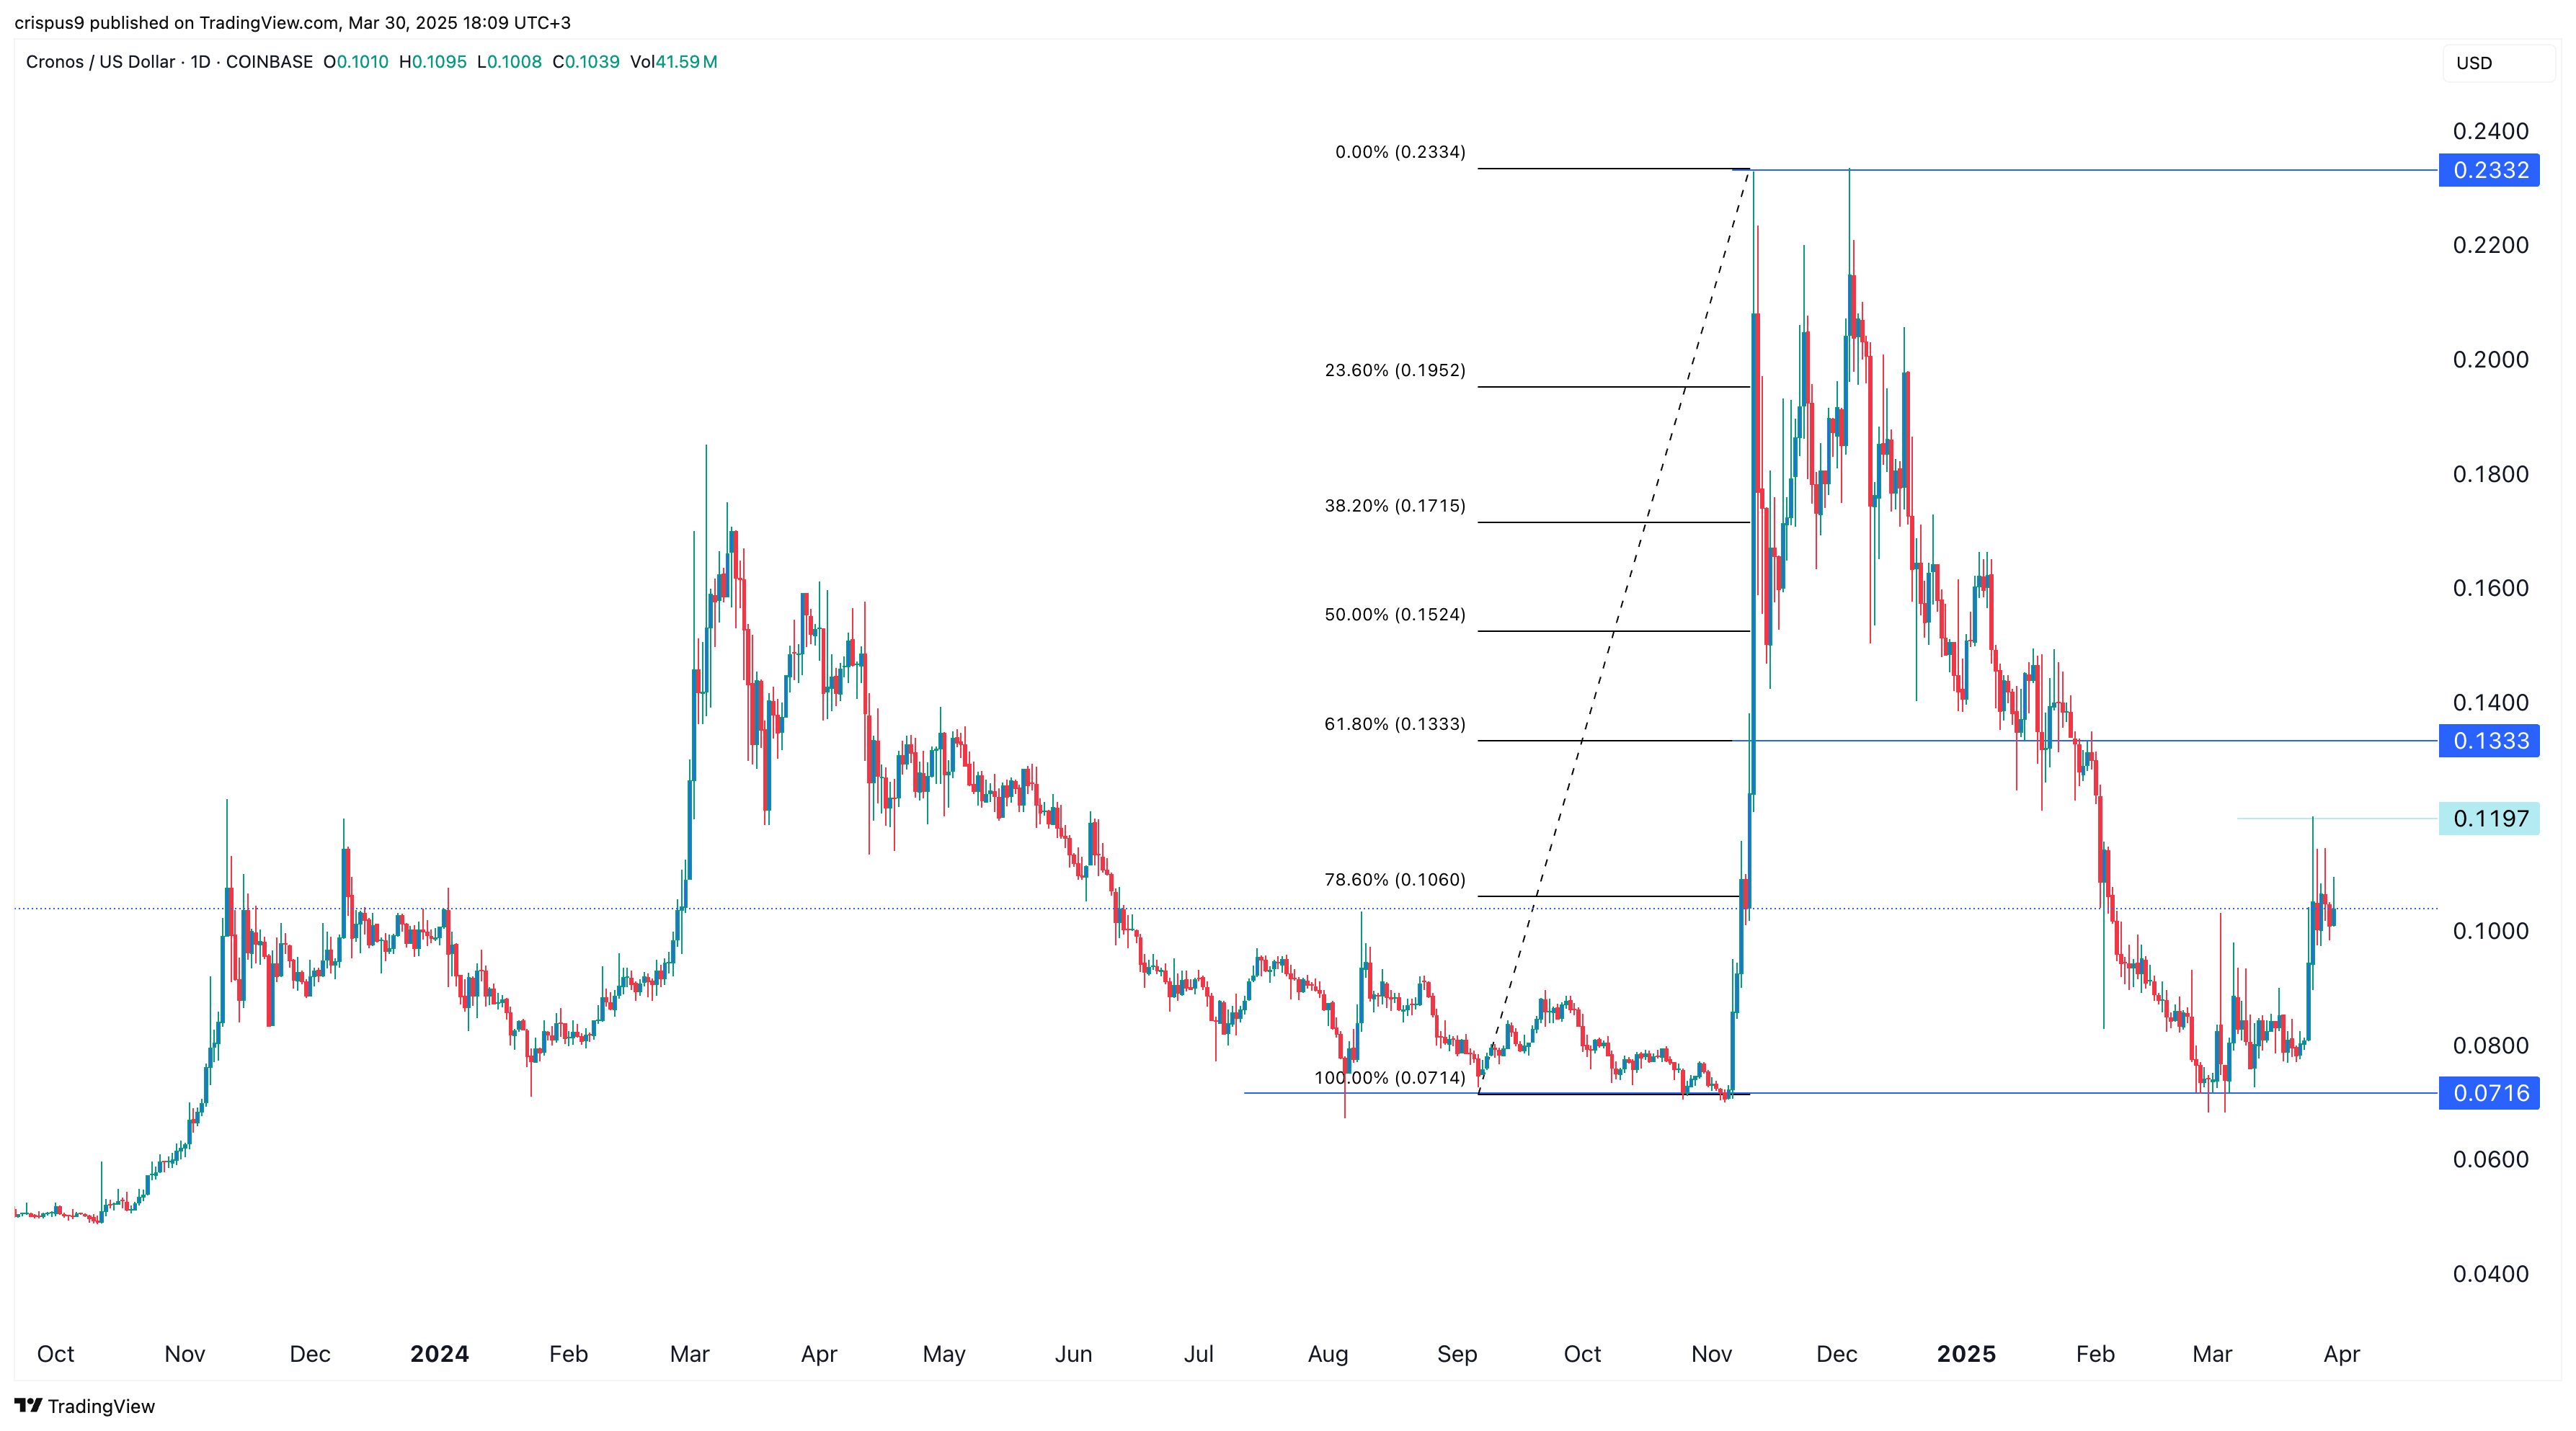
The community also voted to burn 50 million CRO tokens. The daily chart shows that the Cronos price rebounded after hitting the crucial support level at $0.0715, where it failed to drop below in August and November last year.
A breakout above this month’s high of $0.1197 will point to further gains, potentially to the 50% retracement level at $0.133.
Polkadot
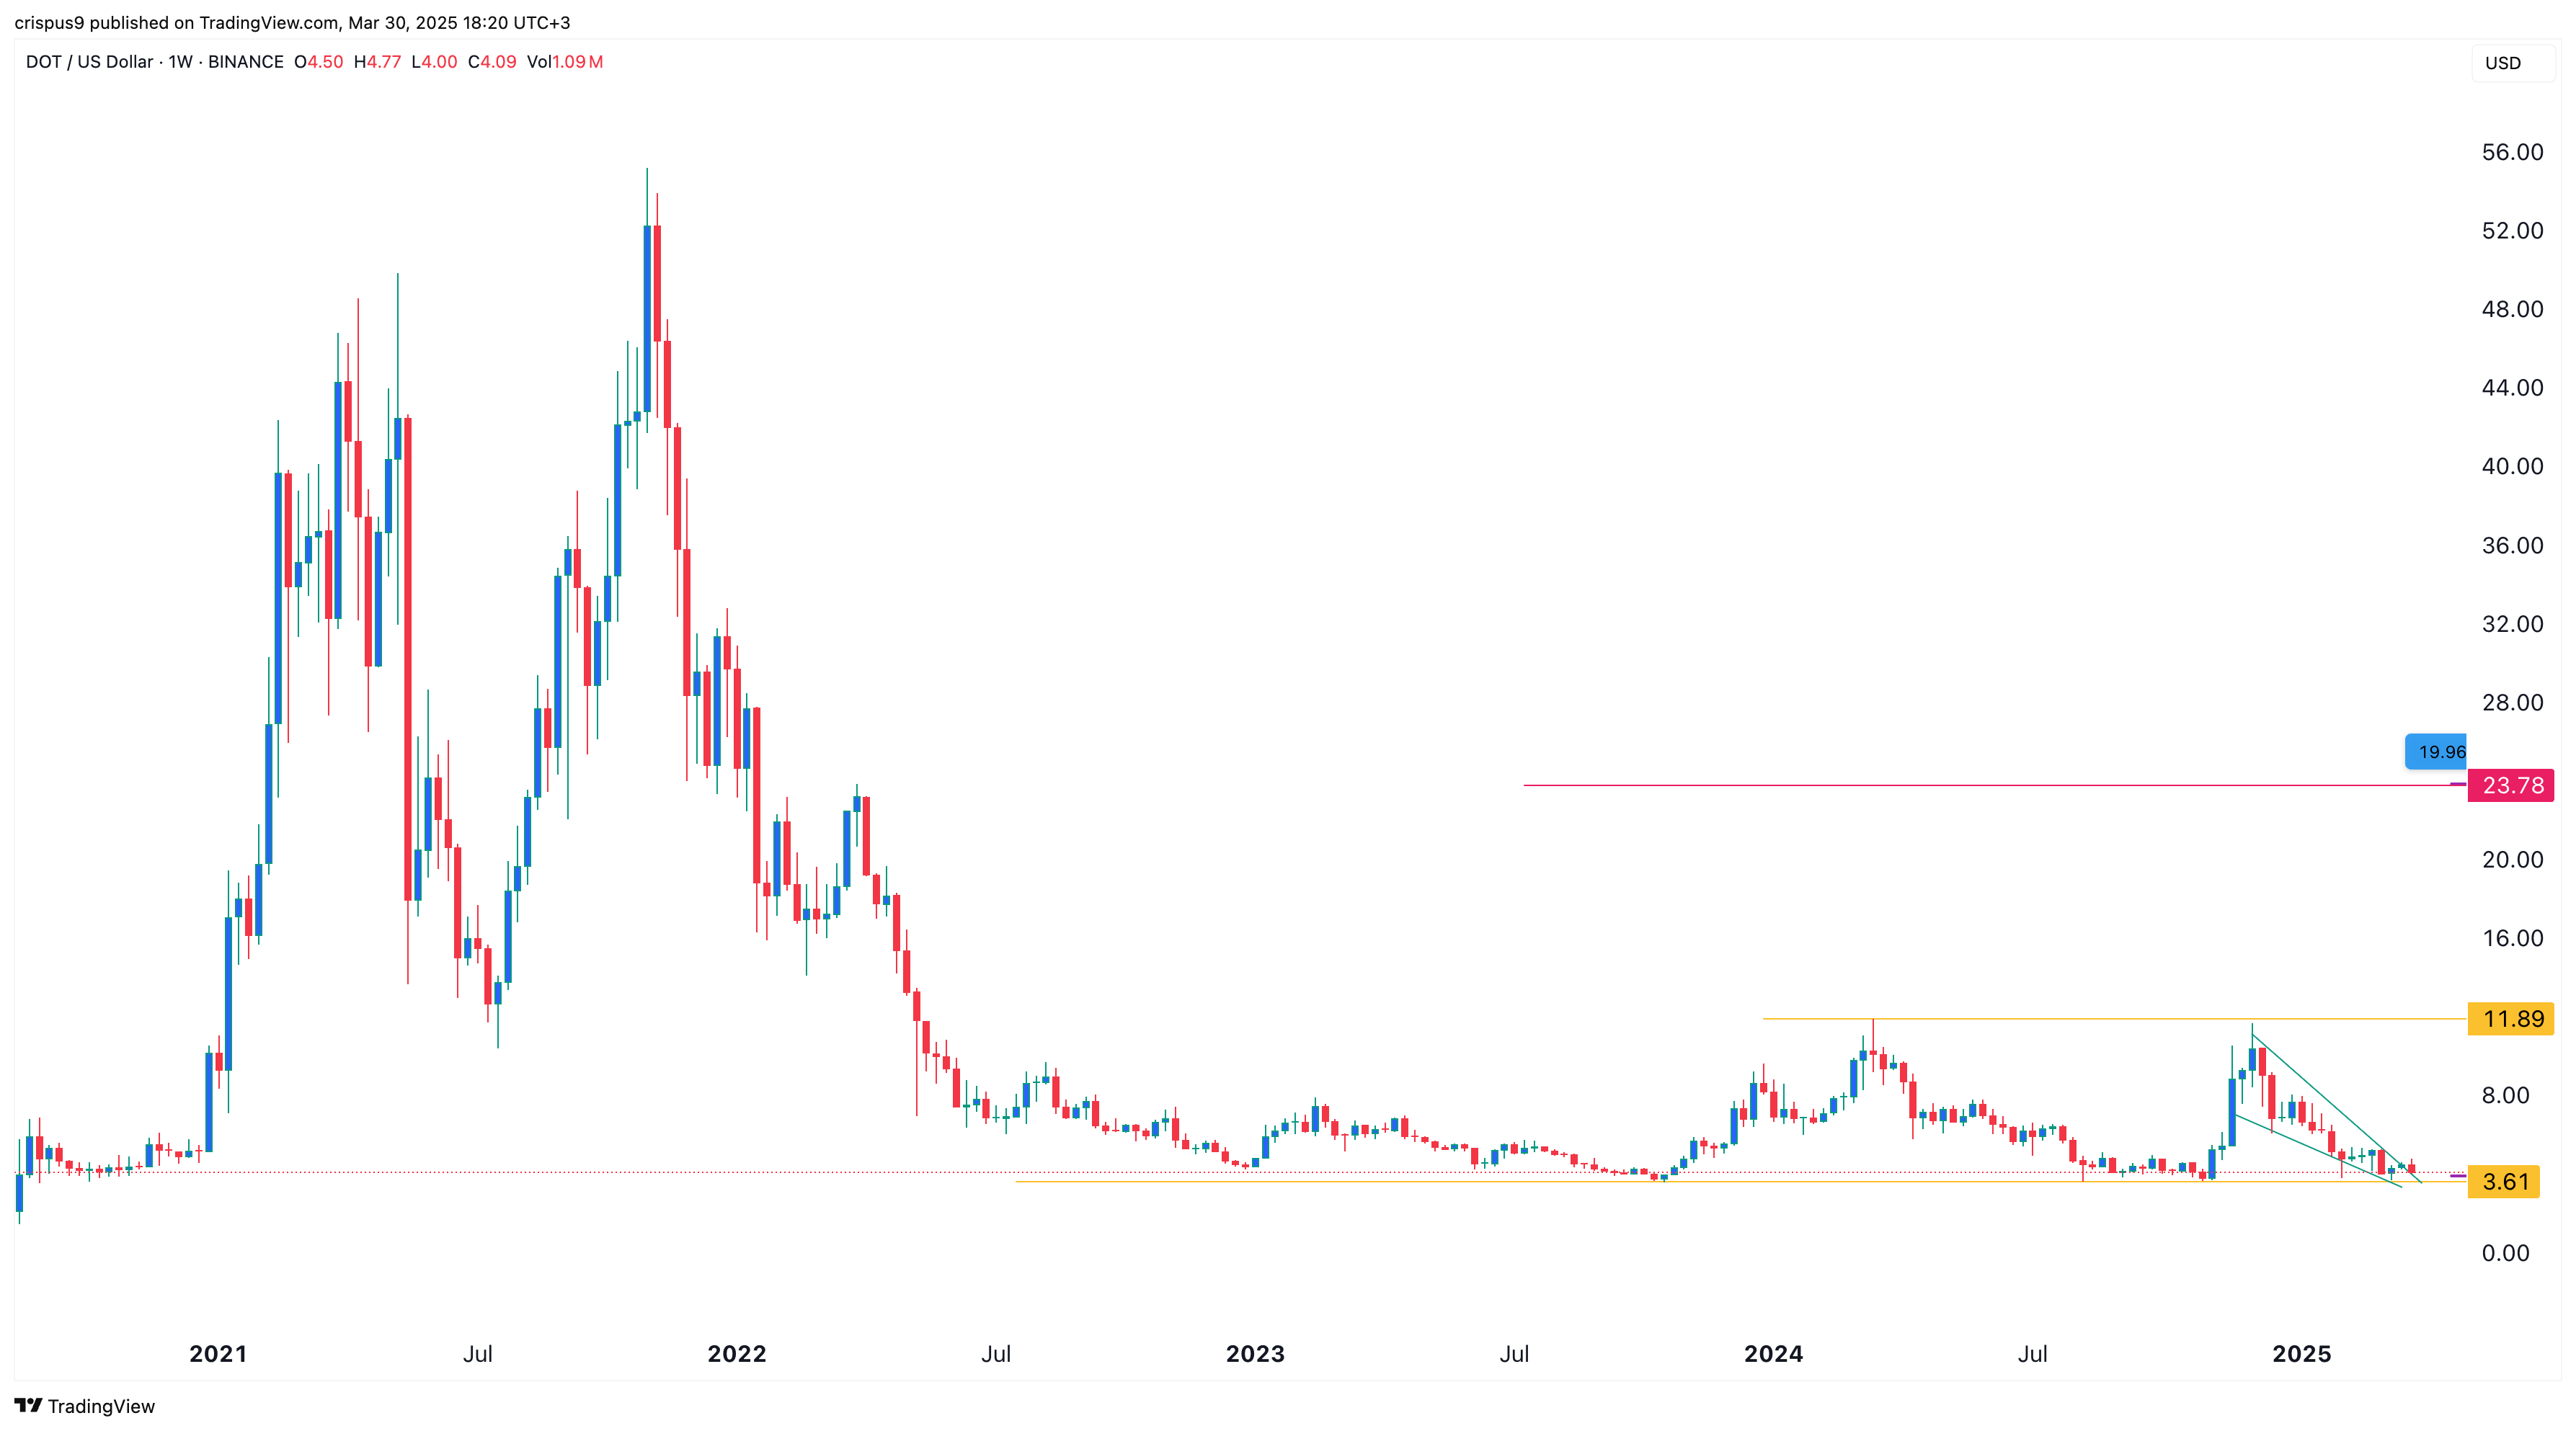
Polkadot (DOT) will be a top crypto to watch because its price is at a crucial support level. DOT was trading at $4.08, a few points above the key support point at $3.60.
This support is crucial since it failed to drop below it several times since 2022.
Polkadot price has also formed a falling wedge pattern, with the two lines nearing their confluence level. This price action points toward a strong bullish breakout in most periods, which may happen this week. Such a move would see DOT price jump to $12.
Source link

XRP Price Reversal Toward $3.5 In The Works With Short And Long-Term Targets Revealed

Former New York governor advised OKX over $505M federal probe: Report

First Digital USD (FDUSD) Depegs After Justin Sun Alleges Firm Is ‘Insolvent’ and Not Fulfilling Redemptions

Gen Z’s Bitcoin Bet, The Largest Wealth Transfer In History?

Trump’s Crypto Conflicts Dominate Stablecoin Legislation Debate

First Digital denies allegations, threatens legal action

Crypto Firm Galaxy Secures UK FCA Approval for License to Expand Derivatives Trading

Why Is The Bitcoin Price Surging Today?

Cardano Founder Reveals What Will Onboard 3 Billion New Users Into Crypto

Sentient open-source AI search outperforms GPT-4o and Perplexity

Memecoin Collapse Creates Perfect Moment for TradFi To Launch ‘Trusted Assets,’ According to Chris Burniske

Breez Announces Launch Of New Wallet, Misty Breez

Alabama, Minnesota Advance Bitcoin Reserve Plans With Companion Bills

Bitfarms secures $300m loan to fuel AI and data center growth

Crypto Hackers Stole $1.67B in Q1, a 300% Rise From Previous Quarter: CertiK

Arthur Hayes, Murad’s Prediction For Meme Coins, AI & DeFi Coins For 2025

Expert Sees Bitcoin Dipping To $50K While Bullish Signs Persist

Aptos Leverages Chainlink To Enhance Scalability and Data Access

Bitcoin Could Rally to $80,000 on the Eve of US Elections

Sonic Now ‘Golden Standard’ of Layer-2s After Scaling Transactions to 16,000+ per Second, Says Andre Cronje

Crypto’s Big Trump Gamble Is Risky

Institutional Investors Go All In on Crypto as 57% Plan to Boost Allocations as Bull Run Heats Up, Sygnum Survey Reveals

Ripple-SEC Case Ends, But These 3 Rivals Could Jump 500x

Has The Bitcoin Price Already Peaked?

A16z-backed Espresso announces mainnet launch of core product

Xmas Altcoin Rally Insights by BNM Agent I

Blockchain groups challenge new broker reporting rule

The Future of Bitcoin: Scaling, Institutional Adoption, and Strategic Reserves with Rich Rines

Trump’s Coin Is About As Revolutionary As OneCoin

Is $200,000 a Realistic Bitcoin Price Target for This Cycle?
Trending

 24/7 Cryptocurrency News5 months ago
Arthur Hayes, Murad’s Prediction For Meme Coins, AI & DeFi Coins For 2025

 Bitcoin3 months ago
Expert Sees Bitcoin Dipping To $50K While Bullish Signs Persist

 24/7 Cryptocurrency News3 months ago
Aptos Leverages Chainlink To Enhance Scalability and Data Access

 Bitcoin5 months ago
Bitcoin Could Rally to $80,000 on the Eve of US Elections

 Altcoins2 months ago
Sonic Now ‘Golden Standard’ of Layer-2s After Scaling Transactions to 16,000+ per Second, Says Andre Cronje

 Opinion5 months ago
Crypto’s Big Trump Gamble Is Risky

 Bitcoin5 months ago
Institutional Investors Go All In on Crypto as 57% Plan to Boost Allocations as Bull Run Heats Up, Sygnum Survey Reveals

 Price analysis5 months ago
Ripple-SEC Case Ends, But These 3 Rivals Could Jump 500x


