Price analysis
Here’s Why XRP Price Will Hit $20
Published
4 months agoon
By
admin
XRP price has remained within an upward trading range in recent weeks, reflecting strong bullish sentiment for the cryptocurrency. The recent price surge aligns with a broader market rally, signaling growing momentum in XRP’s favor. Analysts maintain a positive outlook, with some forecasting a potential breakout that could drive XRP to $20 levels.
Why XRP Price Will Trigger Exponential Rally to $20
XRP price has successfully ended a downtrend that persisted since 2018, signaling potential explosive price movements ahead. Analysts highlight this breakthrough as a significant moment, with Fibonacci extension levels indicating ambitious price targets.
Based on the analysis, the first target lies at the 161.8% Fibonacci extension level, marking $1.88. Following this, higher projections include the 261.8% level at $5.85 and the 361.8% extension at $18.22. This suggests a potential surge in XRP’s valuation as it enters uncharted territory.


3 Reasons Why Ripple Will Hit $20
Gary Gensler, Chair of the U.S. Securities and Exchange Commission (SEC), has announced plans to resign effective January 20, 2025, the day after President-elect Donald Trump’s inauguration.
Gensler, who has served since April 2021, will leave the SEC entirely. Aggressive enforcement has defined his leadership, particularly in the cryptocurrency sector, drawing significant attention from industry stakeholders.
Ripple’s potential to reach $20 has fueled excitement, especially with speculation about the next SEC Chair. Discussions on social media highlight Brian Brooks, former Binance CEO, and a Hedera Foundation board member, as a leading candidate to replace Gary Gensler.
Notably, Brooks is a strong advocate for blockchain innovation, including XRP. His appointment could signal regulatory shifts favoring cryptocurrencies. This possibility has driven optimism in the Ripple community, linking regulatory clarity with XRP’s market performance.
Ripple’s XRP has experienced a remarkable rally, surging 40% in the past week and 180% over the month. The cryptocurrency’s price climbed from $0.60 to over $1, signaling strong bullish momentum. This upward trend aligns with Bitcoin’s rise above $98,000, which has fueled optimism across the crypto market.
If the bullish pressure mounts, more pressure could propel top altcoin to new heights, potentially reaching $20 in this cycle. Market sentiment remains optimistic as Ripple’s consistent growth positions it as a key player in the ongoing crypto surge. At the time of writing, the price of XRP is trading at $1.48, with a strong surge of 2% in the past 24-hours.
XRP’s bullish momentum, regulatory optimism, and market alignment signal a potential surge to $20. With key resistance levels broken and favorable developments ahead, XRP is well-positioned for exponential growth, cementing its role in the evolving crypto landscape.
Frequently Asked Questions (FAQs)
XRP’s bullish breakout and market rally drive its price surge.
Analysts predict a potential rise to $20 in this cycle.
Fibonacci levels at $1.88, $5.85, and $18.22 indicate targets.
Coingape Staff
CoinGape comprises an experienced team of native content writers and editors working round the clock to cover news globally and present news as a fact rather than an opinion. CoinGape writers and reporters contributed to this article.
Disclaimer: The presented content may include the personal opinion of the author and is subject to market condition. Do your market research before investing in cryptocurrencies. The author or the publication does not hold any responsibility for your personal financial loss.
Source link
You may like


‘Positive But Cautious’ Investors Pour Capital Into Ethereum, Solana, XRP and Sui: CoinShares


Bitcoin As The Global Denominator Of Capital


Trump’s Crypto Dealings Are Making Regulation ‘More Complicated’: House Financial Services Chair


Pontus-X taps Oasis for private, cross-border data sharing in E.U.


Elon Musk, Dogecoin Proponent and U.S. Agency Figurehead, Says ‘No DOGE in D.O.G.E.’


Crypto Investor’s Brave Yet Hilarious Prediction Speculates If XRP Price Will Hit $3,000 This Cycle
Price analysis
Crypto Investor’s Brave Yet Hilarious Prediction Speculates If XRP Price Will Hit $3,000 This Cycle
Published
15 hours agoon
March 31, 2025By
admin
A renowned crypto investor has outlined a brave XRP price prediction saying that Ripple might rally to $3,000 this cycle. The analyst’s bullish forecast comes at a time when bearish headwinds are causing a downturn across the broader crypto market as XRP struggles to sustain levels above the crucial support of $2.
Crypto Investor Shares Brave XRP Price Prediction
Crypto investor Random Crypto Pal has shared a bold XRP price prediction and likened the 2017 XRP price rally to the 2025 price movement. He noted that in 2017, Ripple climbed from $0.003 to $3.31, which was an over 110,000% price gain, If it repeats this pattern, XRP could reach $3,000.
Pal’s bullish prediction has attracted criticism from other crypto investors. In response to his X post, one user noted that in 2017, XRP only needed billions of dollars to achieve the $3.31 price within months. However, for an upswing to $3,000, Ripple needed trillions of dollars in buying demand, which was not feasible.
More importantly, at a price of $3,000 and a circulating supply of $58 billion, XRP would have a $174 trillion market cap. This is more than six times higher than the annual US GDP. It would also be three times bigger than the entire US stock market, which has a market cap of $69 trillion.
This massive market cap valuation shows why a $3,000 XRP price prediction is hilarious. Ripple is unlikely to reach this level with the current amount of token supply.
Ripple Technical Analysis As Another Crash Looms
XRP price today trades at $2.09 with a 3.6% decline in 24 hours. Ripple is on the verge of another crash and might drop below $2 as investors flee from risk assets amid fears of President Trump’s tariffs and reduced odds that the Federal Reserve will trim interest rates.
On the one-day price chart, XRP had formed a rounding top pattern, which signals that the current trend might change to bearish. The height of this rounding top pattern indicates that Ripple could plunge by 17.45% from its current price level of $1.76.
Technical indicators support the bearish setup depicted by the rounding top pattern. The RSI is leaning towards being oversold and depicts bearish momentum while the ADX lime is also tipping north, another sign that the downtrend is strong.


As a recent Coingape article reported, if the XRP price drops below $1.90. It might crash to $1. Given that XRP has already dropped below the neckline of the rounding top, a crash is likely to happen in the near term.
XRP’s Liquidation Heatmap Supports Bearish Outlook
Besides the rounding top pattern, the liquidation heatmap supports the bearish outlook for XRP. Data from Coinglass shows that there is a hot liquidation zone at $2.05, where many long traders are at risk of being liquidated.


These liquidation zones tend to act as a magnet that pulls the price down. Moreover, the closure of long positions increases selling activity around an asset. This hints towards more bearish trends facing Ripple.
Frequently Asked Questions (FAQs)
According to crypto investor Pal, XRP can reach $3,000 if it repeats the 2017 cycle. However, this price target is unrealistic as it would need Ripple to add more than $173 trillion to its market cap.
Ripple has formed a rounding top pattern on the 1-day chart suggesting that the price might drop by 17% from the current price to $1.76.
XRP’s liquidation heatmap shows a strong magnet zone below the current price. XRP might drop to this level and trigger long liquidations that will push the price lower.
muthoni
Muthoni Mary is a seasoned crypto market analyst and writer with over three years of experience dissecting blockchain trends, price movements, and market dynamics. With a sharp eye for technical analysis and an in-depth understanding of on-chain metrics, she delivers insightful, data-driven content that helps investors navigate the fast-paced world of digital assets.
Disclaimer: The presented content may include the personal opinion of the author and is subject to market condition. Do your market research before investing in cryptocurrencies. The author or the publication does not hold any responsibility for your personal financial loss.
Source link
Bitcoin price is at a pivotal level as ETF flows offloaded $93 million on Friday, ending a 10-day buying spree. While BTC holds key support at $82,000, BlackRock investors disposition may signal optimism.
Bitcoin ETFs End 10-day Buying Spree, But BlackRock Investors Hold
Bitcoin ETFs drew media attention on Friday as net outflows reached $93 million, marking the end of a 10-day buying spree that added over $1.07 billion in BTC.
FairSide data reveals that all of the outflows came from Fidelity’s FBTC, while BlackRock’s IBIT and eight other U.S.-approved spot ETFs recorded neutral flows, signaling diverging institutional investor sentiment.


Despite the selling pressure, BTC price showed resilience, bouncing from a 10-day low of $82,000 to reclaim the $84,000 level over the weekend.
This suggests that while some institutional players have turned cautious, BTC continues to find buyers at the $82,000 mark, likely driven by macroeconomic hedging.
Why Are Bitcoin ETFs Taking a Neutral Outlook Despite Bearish Market Sentiment?
While Bitcoin’s brief dip below $82,000 coincided with renewed regulatory uncertainty—following U.S. Congress’ scrutiny of Paul Atkins, Trump’s crypto-friendly SEC pick—the decision by major ETFs like BlackRock’s IBIT to hold rather than sell suggests a more calculated approach among institutional investors.
One possible explanation is that institutional investors are weighing broader macroeconomic risks. With concerns mounting over Trump’s proposed trade policies and their potential impact on traditional stock markets, Bitcoin remains an attractive hedge due to its independence from traditional financial structures. This could explain why ETF outflows have been concentrated in specific funds like FBTC rather than across the board.
- Large Un-realized Profits
Prior to the $93 million sell-off observed on Friday, Bitcoin ETFs had acquired over $1.07 billion in the previous 10-days. This sheer volume of Bitcoin accumulated by ETFs in recent weeks means that short-term supply is limited.
It also hints that majority on investors who began buying when BTC prices plunged below $77,000 over the past week are still in profit, hence the reluctance to sell.


This key dynamics may have contributed to Bitcoin price holding key support levels above $82,000. Notably, while BTC price rebounded, leading altcoins like Ethereum (ETH), Solana (SOL), and Ripple (XRP) have lagged behind, further reinforcing the narrative that institutional capital remains primarily focused on BTC.
What’s Next for Bitcoin ETFs and Institutional Demand?
The coming weeks will be crucial in determining whether Bitcoin ETFs resume their accumulation trend or if further outflows signal a shift in sentiment. Investors will closely watch developments in U.S. regulatory policy and broader market conditions to assess whether Bitcoin’s status as a safe-haven asset remains intact.
If the macroeconomic environment continues to favor Bitcoin as a non-correlated asset, ETF inflows could resume, pushing BTC to new highs. However, prolonged uncertainty or negative regulatory developments could trigger deeper corrections.
For now, BlackRock and other major institutional players appear to be maintaining their positions, indicating confidence in Bitcoin’s long-term trajectory.
Bitcoin Price Forecast: BTC Faces Critical Resistance at $84,400 Amid Bearish Pennant Formation
Bitcoin price forecast signals remains uncertain as BTC trades at $82,363, hovering near key support levels. The Bollinger Bands show tightening volatility, with resistance at $84,412 and $88,215. The Parabolic SAR at $80,237 suggests a continuation of the downtrend unless BTC breaks above the mid-range resistance.


A bearish pennant formation signals potential downside risk. If BTC fails to reclaim $84,400, selling pressure could drive the price towards $80,600 or even the lower Bollinger Band at $80,237. The volume delta reveals declining buying momentum, supporting the bearish case.
However, a bullish scenario emerges if BTC can hold above $82,000 and break past $84,400 with strong volume. This could lead to a rally toward $88,215, negating the bearish pennant. With key resistance intact, Bitcoin’s trajectory depends on its next move at this crucial level.
Frequently Asked Questions (FAQs)
Bitcoin price is declining due to ETF outflows, regulatory uncertainty, and shifting investor sentiment favoring safer assets like gold and cash.
Yes, if institutional demand returns, macroeconomic conditions improve, and key support levels hold, Bitcoin could regain bullish momentum.
Bitcoin ETFs drive large-scale buying and selling, influencing price volatility and overall market liquidity depending on institutional investor behavior.
ibrahim
Crypto analyst covering derivatives markets, macro trends, technical analysis, and DeFi. His works feature in-depth market insights, price forecasts, and institutional-grade research on digital assets.
Disclaimer: The presented content may include the personal opinion of the author and is subject to market condition. Do your market research before investing in cryptocurrencies. The author or the publication does not hold any responsibility for your personal financial loss.
Source link
Altcoin
Cryptocurrencies to watch this week: Solana, Cronos, DOT
Published
1 day agoon
March 30, 2025By
admin
Cryptocurrencies will likely be volatile this week once President Donald Trump’s reciprocal tariffs go into effect and the U.S. publishes nonfarm payroll data.
The week started on a dull note, with most coins remaining in a bear market. At last check, Bitcoin (BTC) had dropped to $82,432.00.
The crypto fear and greed index has slumped to the fear zone 25. Some of the top cryptocurrencies to watch this week are Solana, Polkadot, and Cronos.
Solana
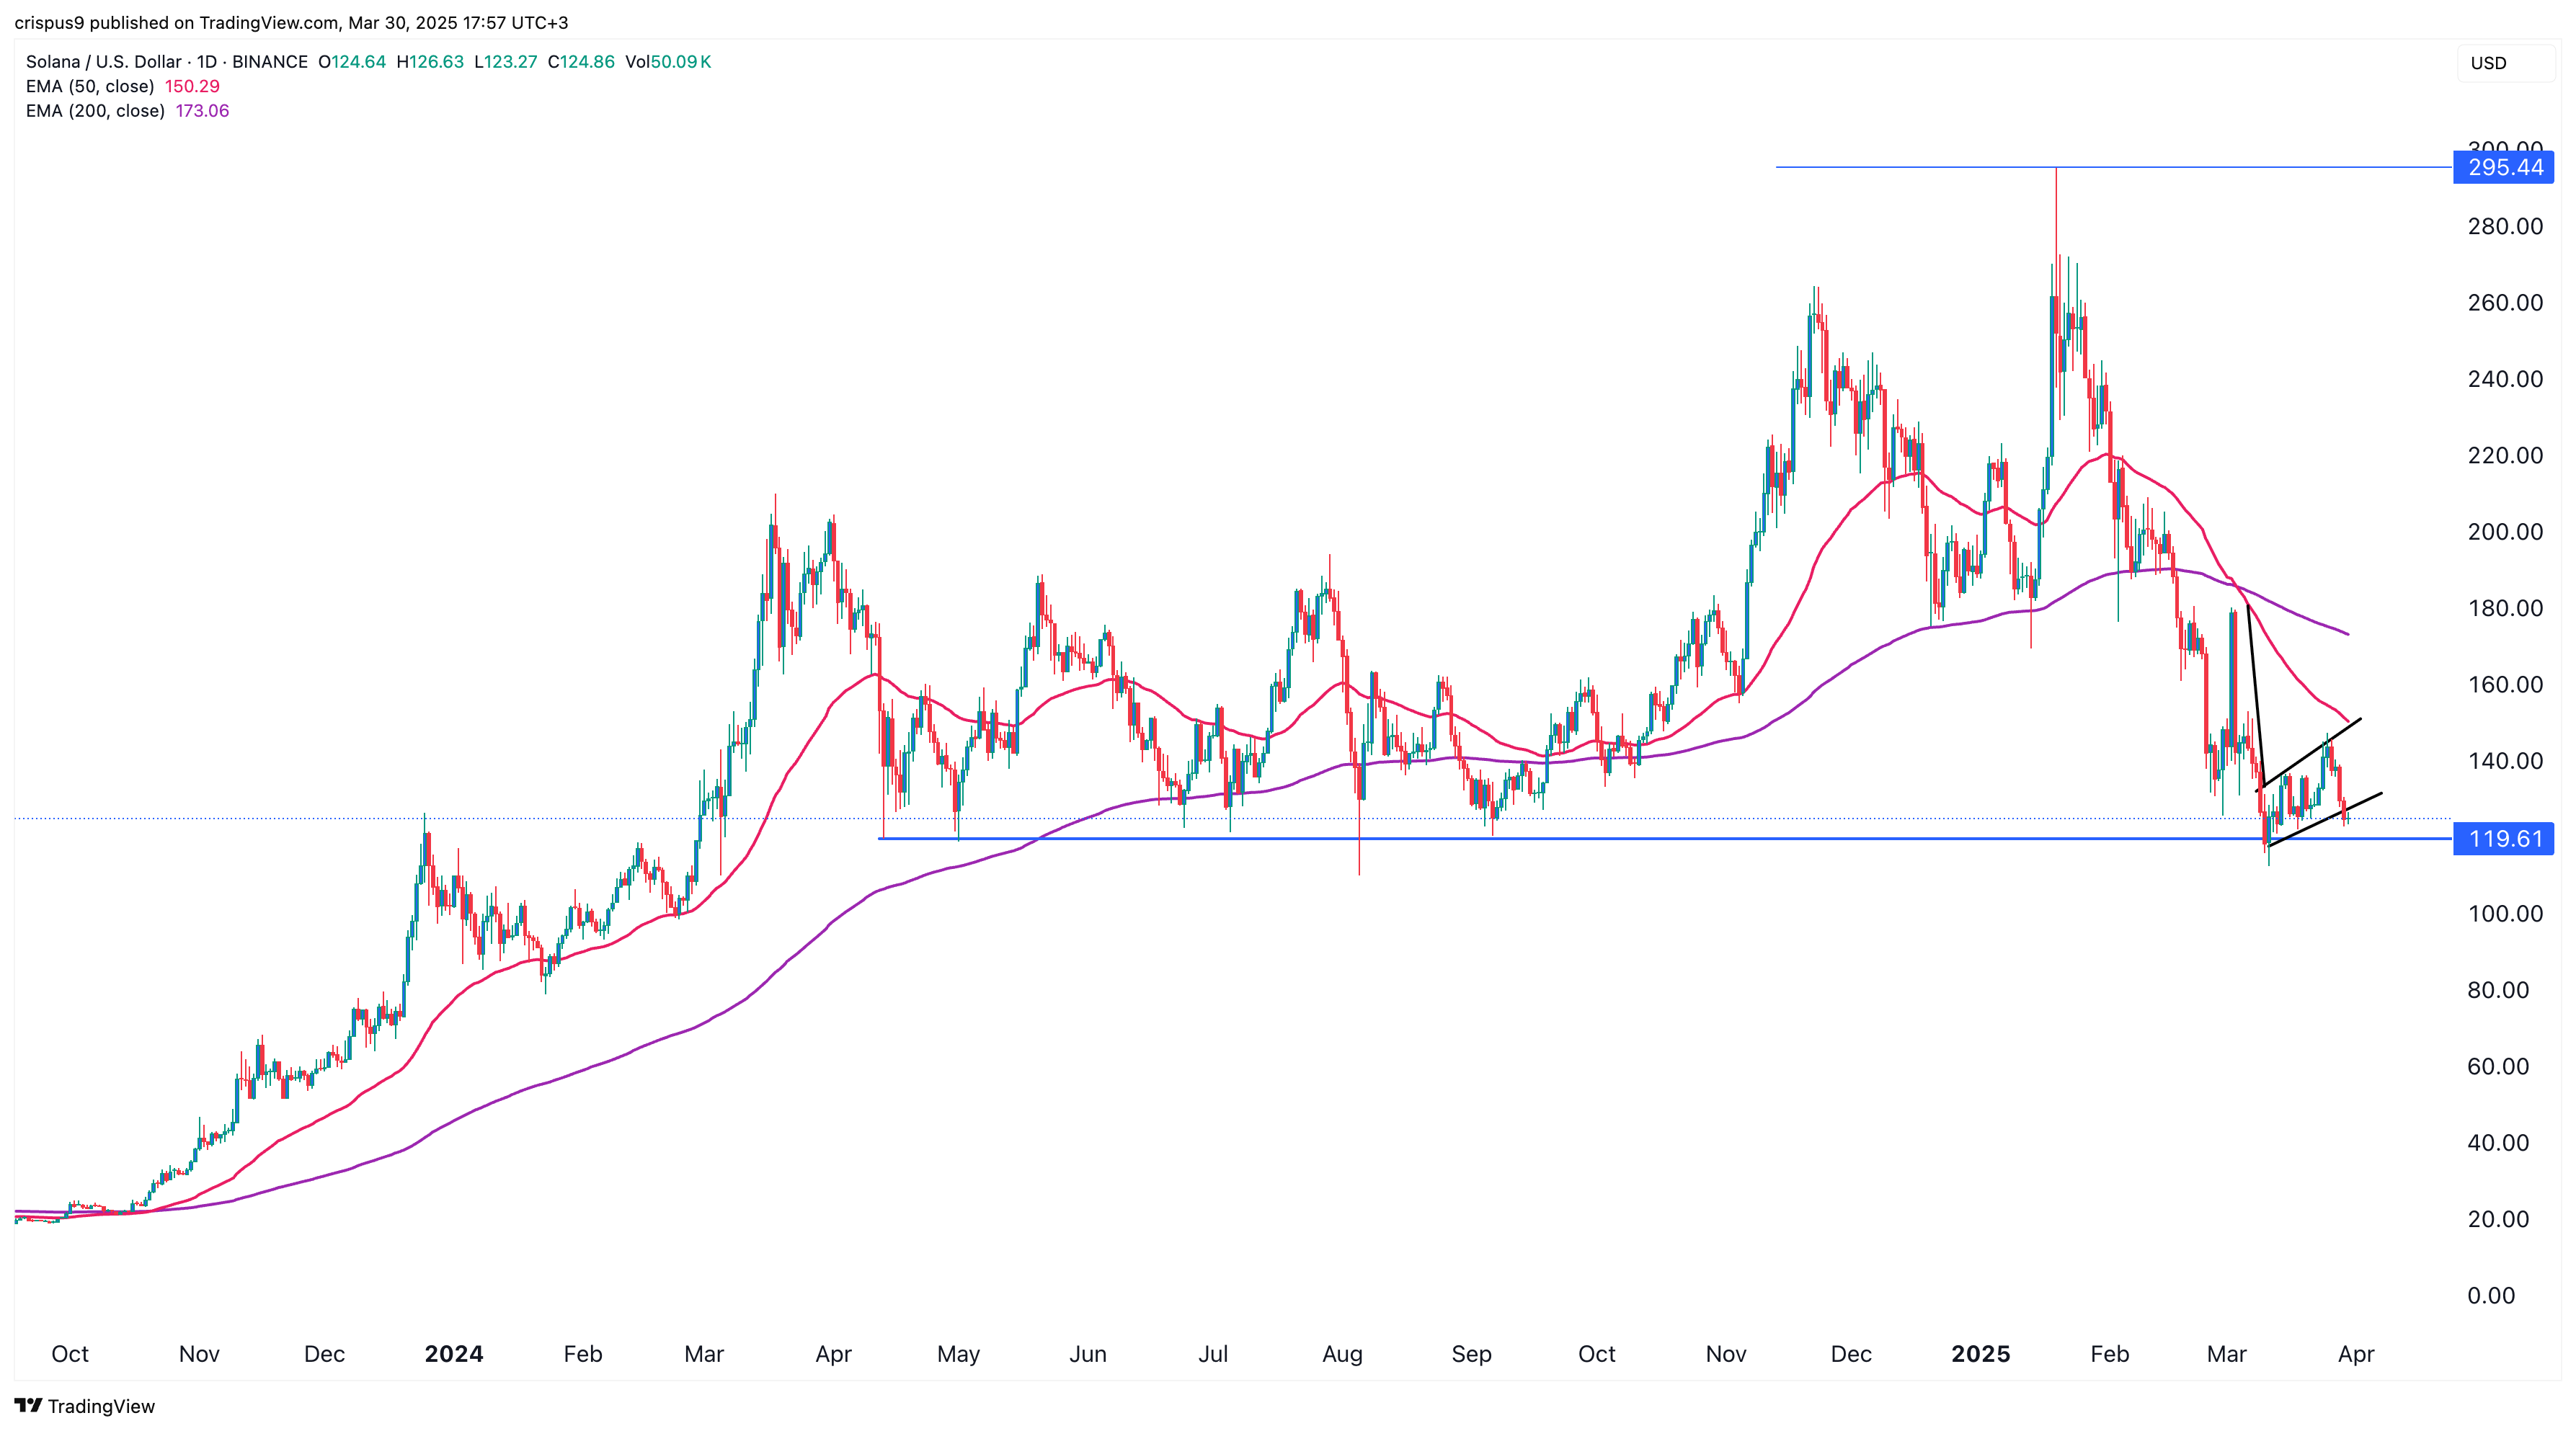
Solana (SOL), the popular layer-1 network, will be in the spotlight this week since its price is hovering above the key support level at $119.5. As shown above, it has failed to drop below this level several times since April last year, a sign that bears have been afraid of shorting below it.
Therefore, a drop below $119.5 will confirm a bearish breakdown and point to further downside. Besides, the Solana price formed a death cross pattern on March 3 as the 50-day and 200-day moving averages crossed each other.
A drop below $119.6 indicates a further drop to $100.
Cronos
Cronos, formerly Crypto.com, will be one of the top cryptocurrencies to watch this week because of its strong performance last week. It jumped by 30% in the last seven days, and by 54% from its lowest point this year.
Cronos price has bounced back after Crypto.com partnered with Donald Trump’s Trump Media to launch ETFs. It also rose after the community voted to allow the creation of another 70 billion CRO tokens, which will be used to create a Strategic Crypto Reserve.
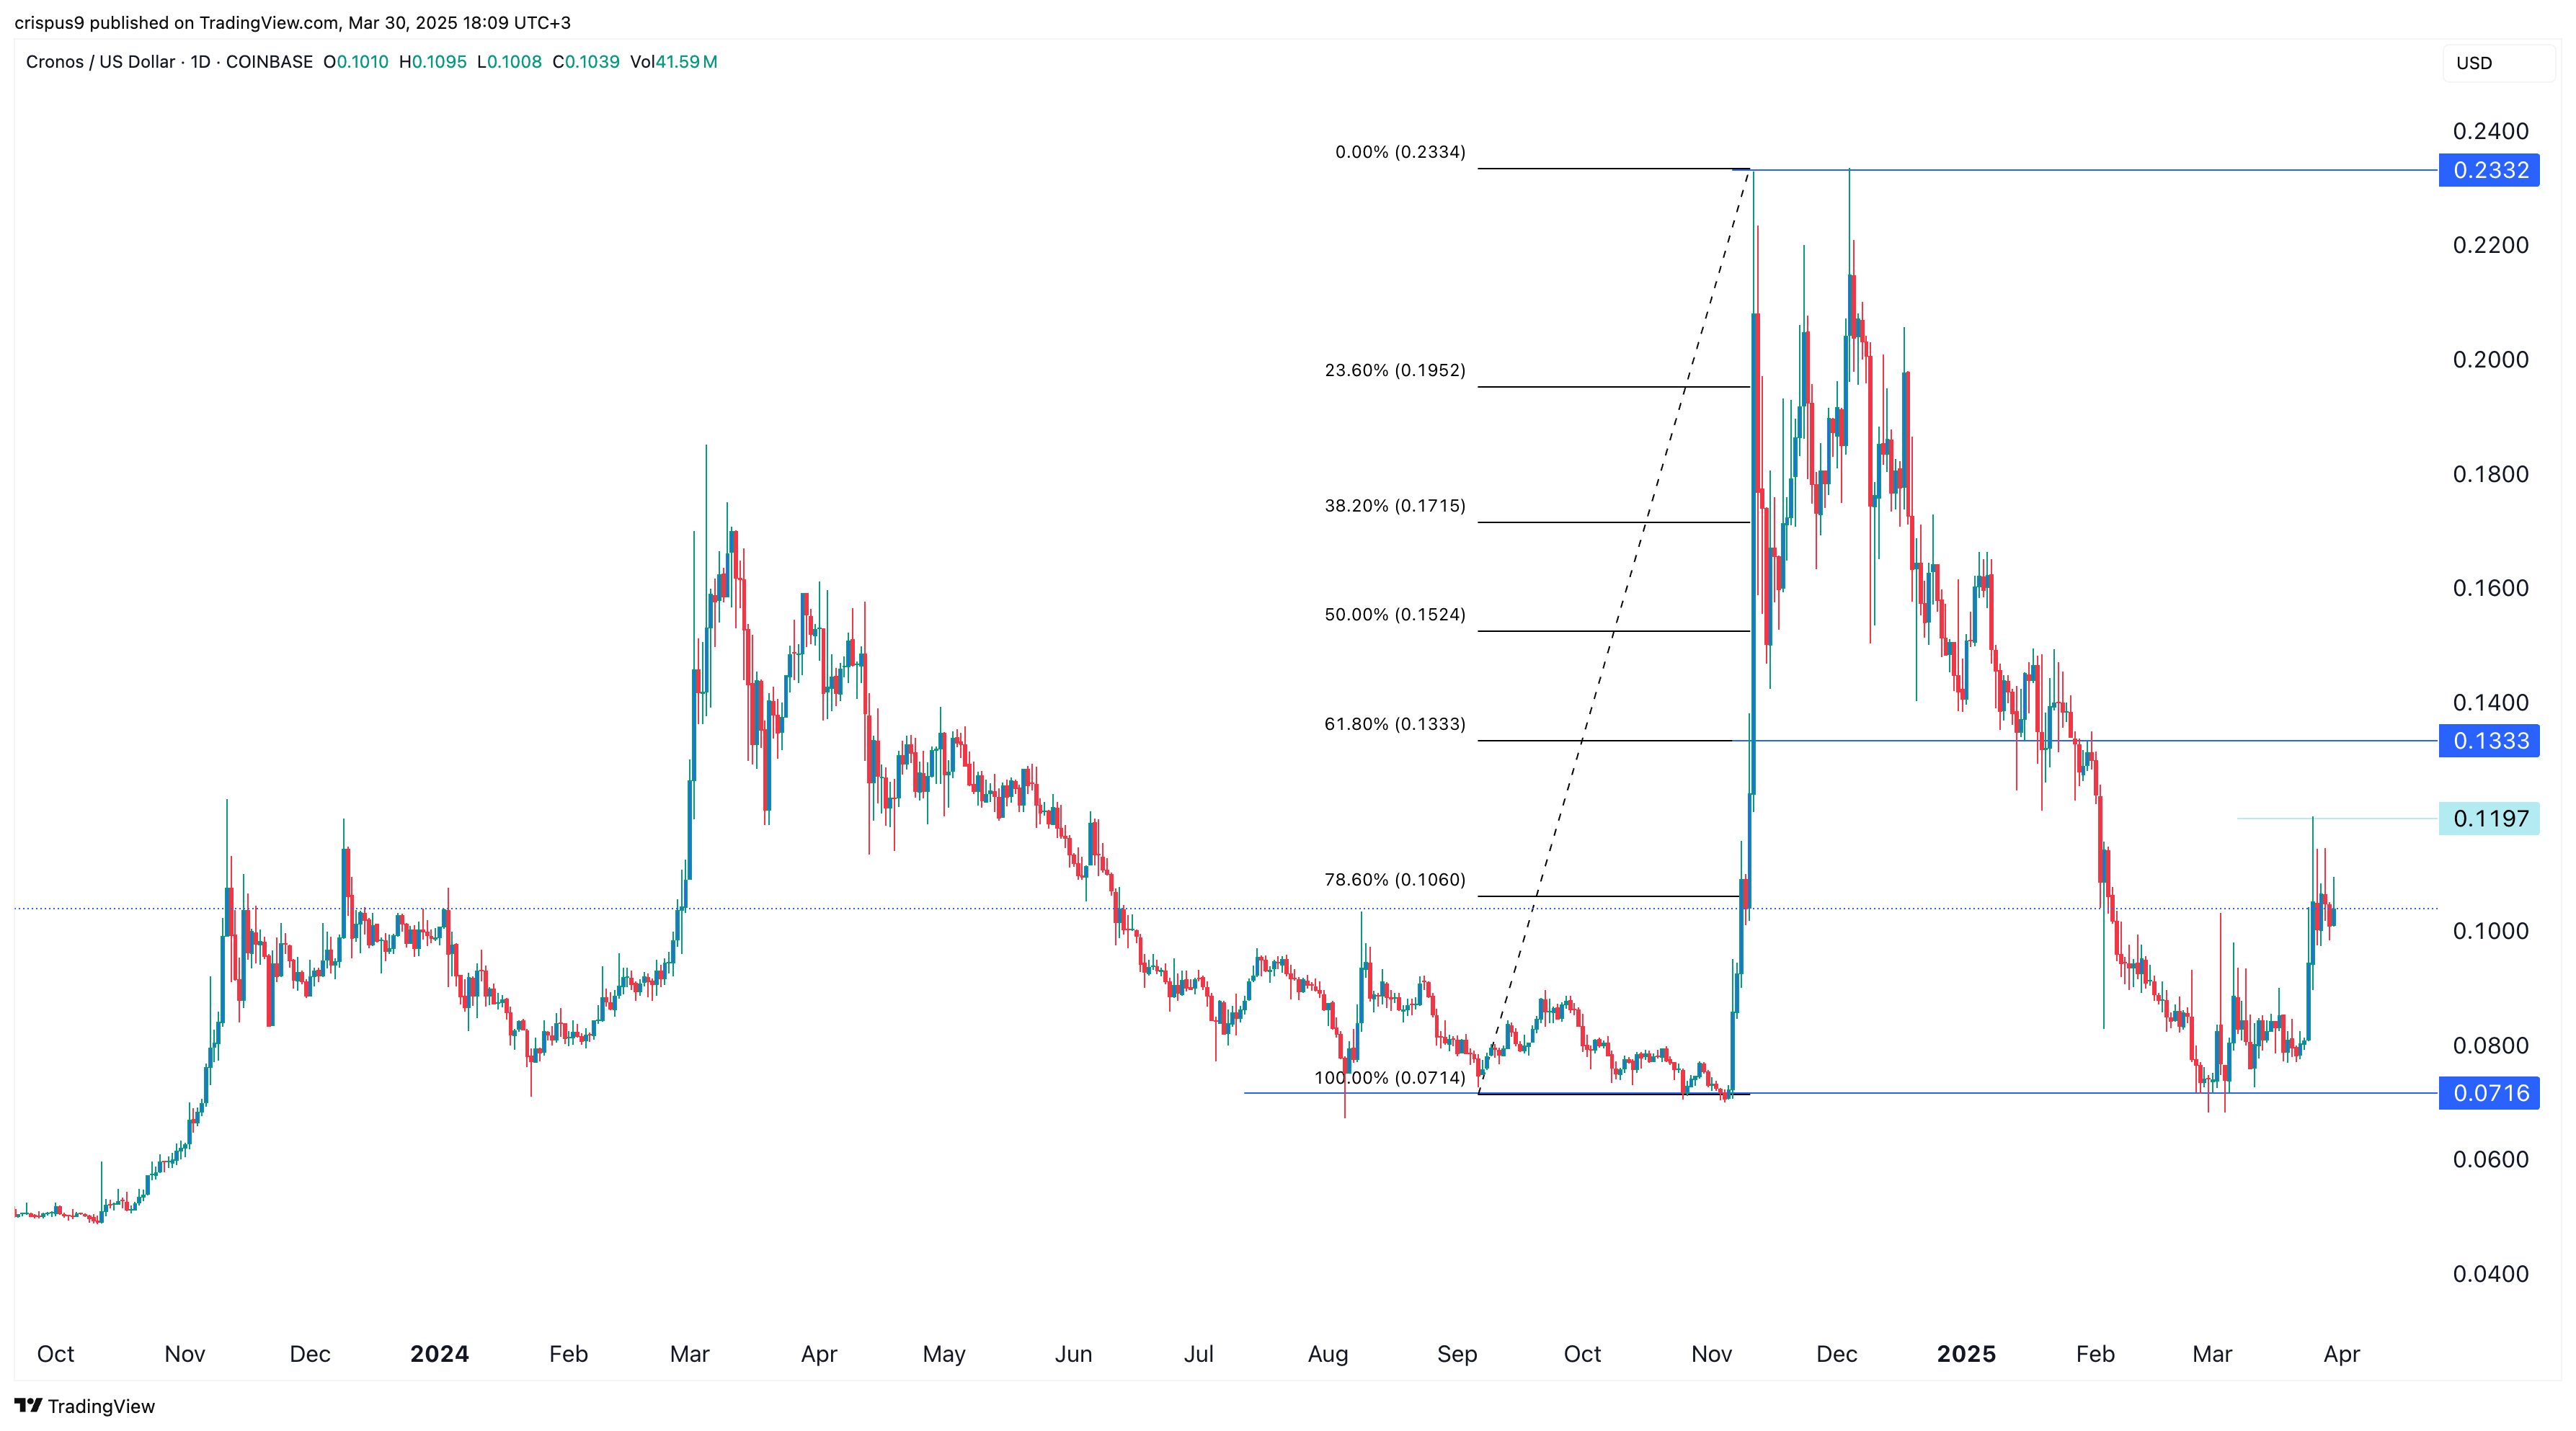
The community also voted to burn 50 million CRO tokens. The daily chart shows that the Cronos price rebounded after hitting the crucial support level at $0.0715, where it failed to drop below in August and November last year.
A breakout above this month’s high of $0.1197 will point to further gains, potentially to the 50% retracement level at $0.133.
Polkadot
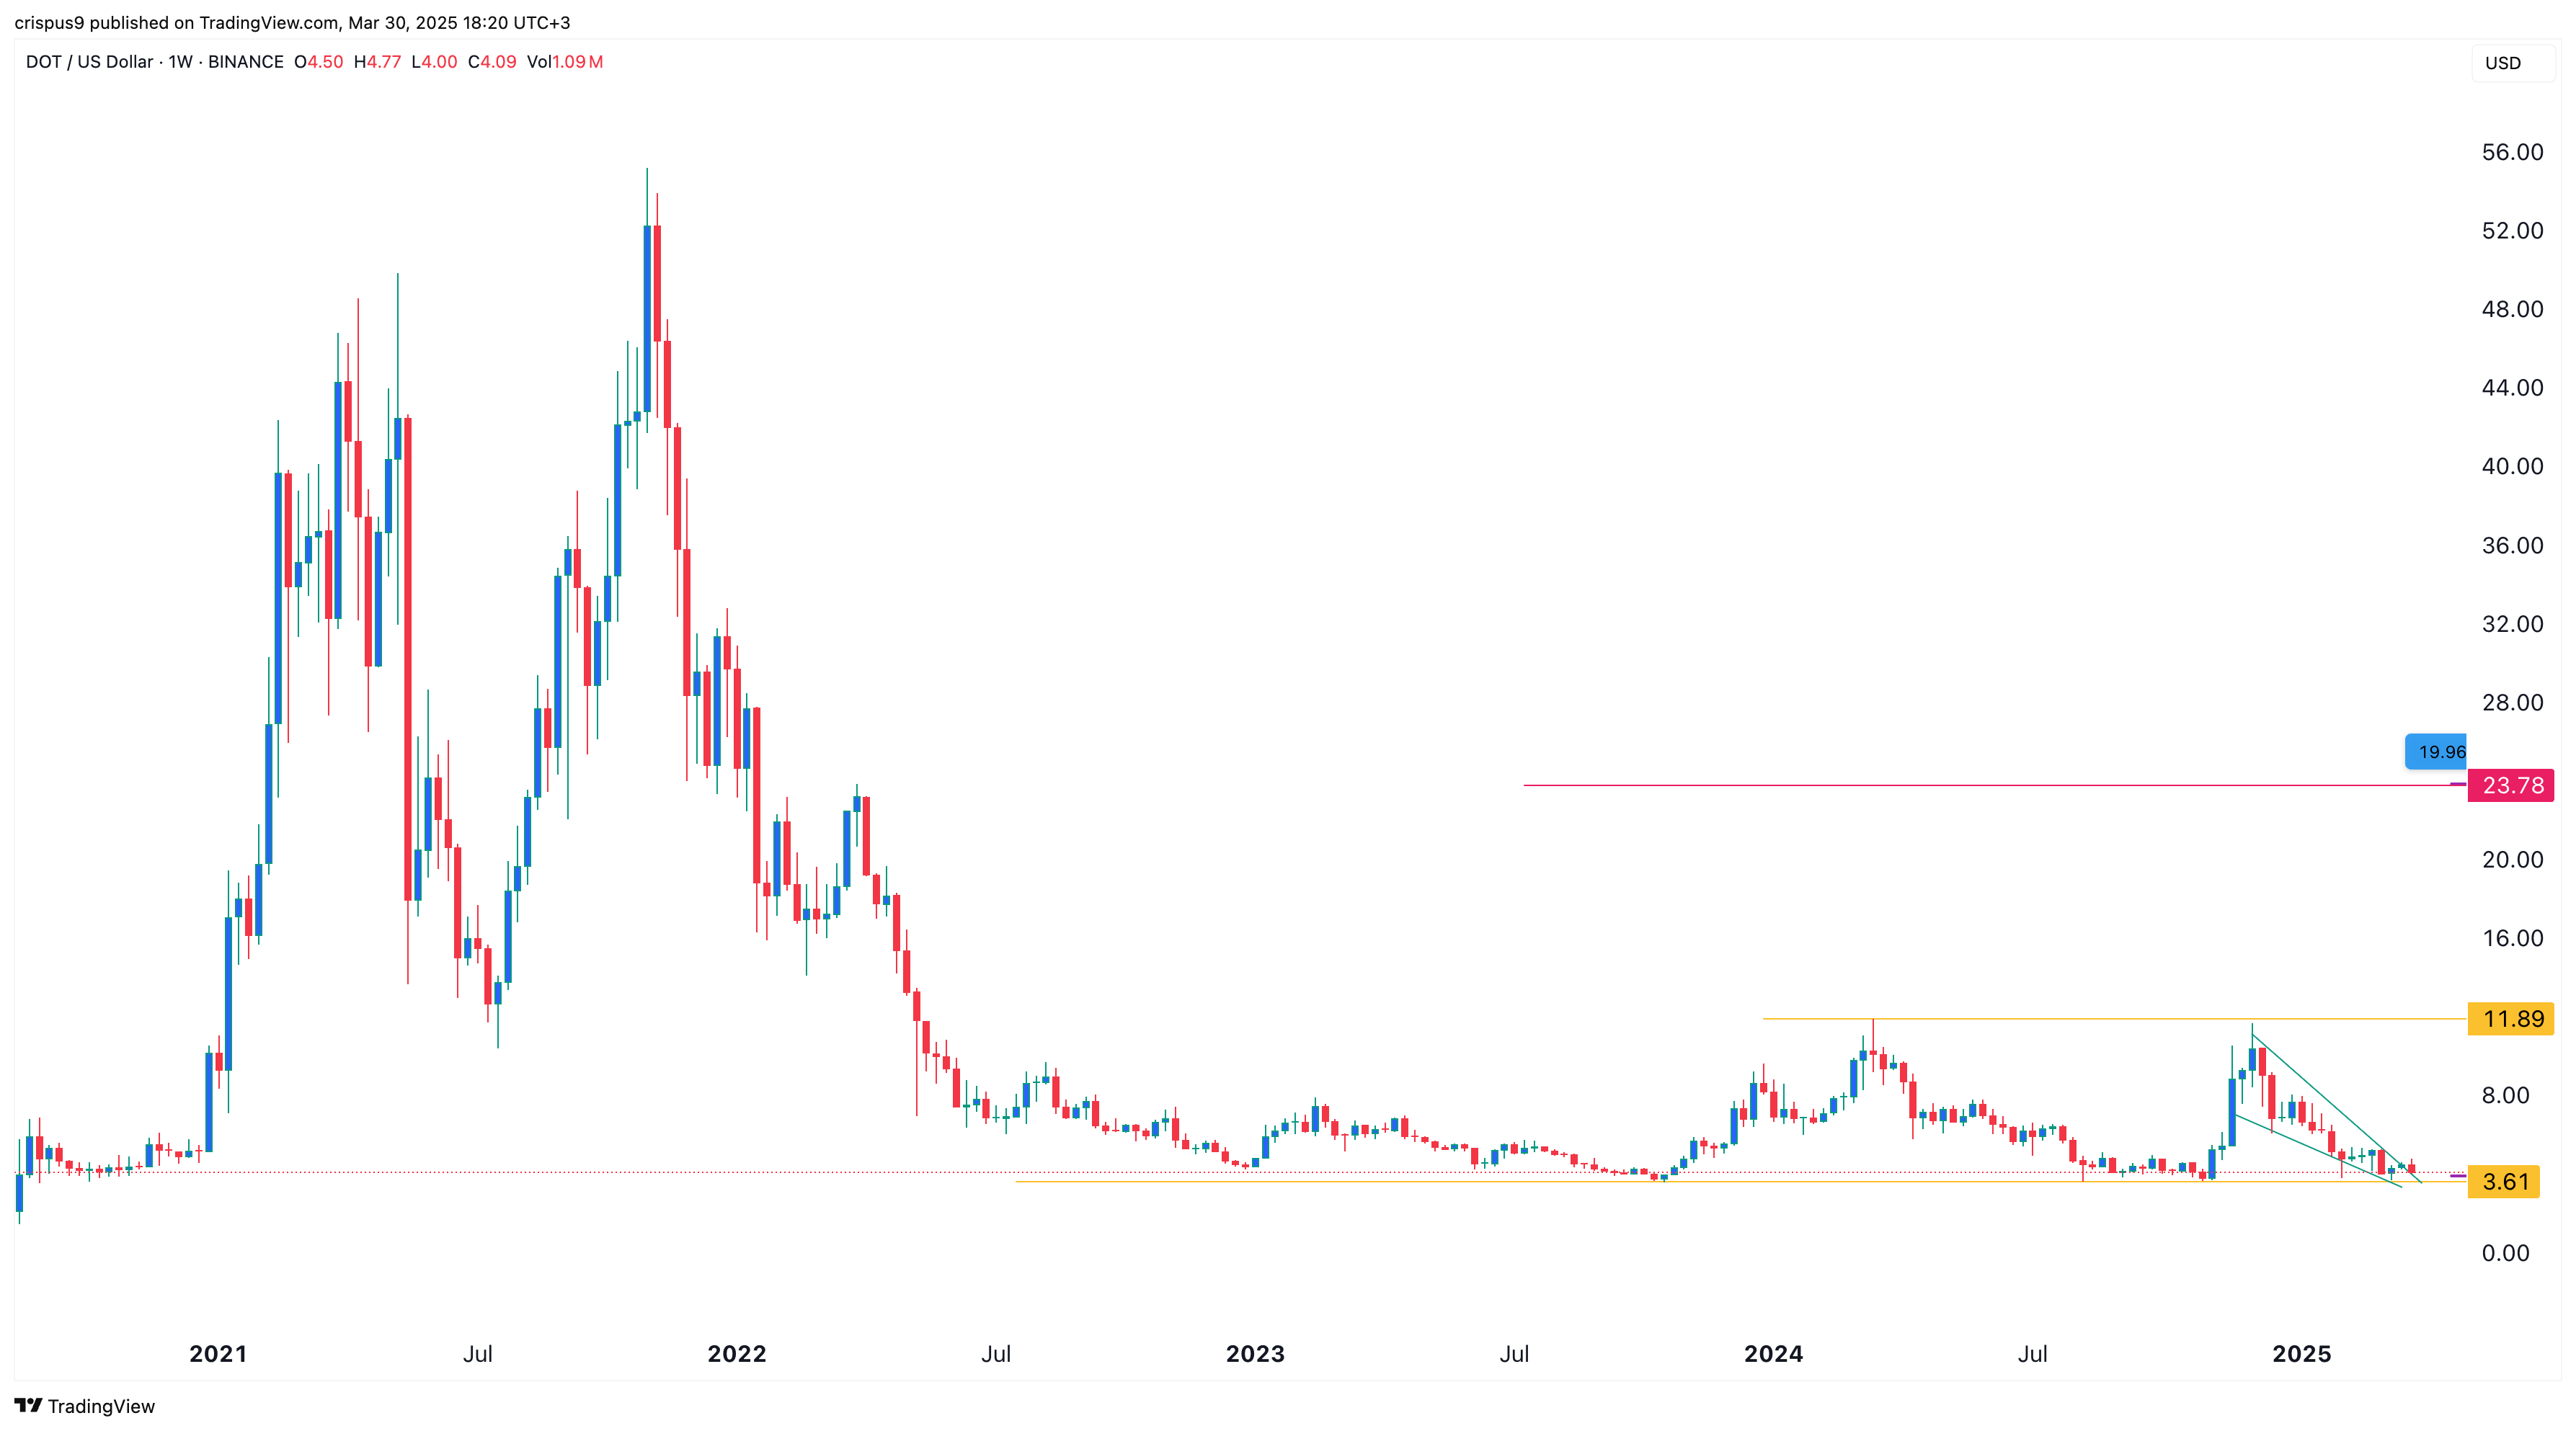
Polkadot (DOT) will be a top crypto to watch because its price is at a crucial support level. DOT was trading at $4.08, a few points above the key support point at $3.60.
This support is crucial since it failed to drop below it several times since 2022.
Polkadot price has also formed a falling wedge pattern, with the two lines nearing their confluence level. This price action points toward a strong bullish breakout in most periods, which may happen this week. Such a move would see DOT price jump to $12.
Source link

‘Positive But Cautious’ Investors Pour Capital Into Ethereum, Solana, XRP and Sui: CoinShares

Bitcoin As The Global Denominator Of Capital

Trump’s Crypto Dealings Are Making Regulation ‘More Complicated’: House Financial Services Chair

Pontus-X taps Oasis for private, cross-border data sharing in E.U.

Elon Musk, Dogecoin Proponent and U.S. Agency Figurehead, Says ‘No DOGE in D.O.G.E.’

Crypto Investor’s Brave Yet Hilarious Prediction Speculates If XRP Price Will Hit $3,000 This Cycle

Dogecoin (DOGE) Bulls In Trouble—Can They Prevent a Drop Below $0.15?

California introduces ’Bitcoin rights’ in amended digital assets bill

MELANIA Insider Hayden Davis Selling Millions of Dollars Worth of Memecoin Amid 95% Drop: On-Chain Data

Toulouse starts to accept crypto for public transport

Bitcoin, Crypto Prices Slide as Trade Tensions, Inflation Risks Rattle Markets

Will BlackRock Investors Stay Bullish?

Bitcoin Could Appear on 25% of S&P 500 Balance Sheets by 2030, Analyst Says

Centralization and the dark side of asset tokenization — MEXC exec

Bitcoin Support Thins Below $78,000 As Cost Basis Clusters Shift Toward $95,000

Arthur Hayes, Murad’s Prediction For Meme Coins, AI & DeFi Coins For 2025

Expert Sees Bitcoin Dipping To $50K While Bullish Signs Persist

Aptos Leverages Chainlink To Enhance Scalability and Data Access

Bitcoin Could Rally to $80,000 on the Eve of US Elections

Sonic Now ‘Golden Standard’ of Layer-2s After Scaling Transactions to 16,000+ per Second, Says Andre Cronje

Institutional Investors Go All In on Crypto as 57% Plan to Boost Allocations as Bull Run Heats Up, Sygnum Survey Reveals

Crypto’s Big Trump Gamble Is Risky

Ripple-SEC Case Ends, But These 3 Rivals Could Jump 500x

Has The Bitcoin Price Already Peaked?

A16z-backed Espresso announces mainnet launch of core product

Xmas Altcoin Rally Insights by BNM Agent I

Blockchain groups challenge new broker reporting rule

The Future of Bitcoin: Scaling, Institutional Adoption, and Strategic Reserves with Rich Rines

Trump’s Coin Is About As Revolutionary As OneCoin

Is $200,000 a Realistic Bitcoin Price Target for This Cycle?
Trending

 24/7 Cryptocurrency News5 months ago
Arthur Hayes, Murad’s Prediction For Meme Coins, AI & DeFi Coins For 2025

 Bitcoin2 months ago
Expert Sees Bitcoin Dipping To $50K While Bullish Signs Persist

 24/7 Cryptocurrency News3 months ago
Aptos Leverages Chainlink To Enhance Scalability and Data Access

 Bitcoin5 months ago
Bitcoin Could Rally to $80,000 on the Eve of US Elections

 Altcoins2 months ago
Sonic Now ‘Golden Standard’ of Layer-2s After Scaling Transactions to 16,000+ per Second, Says Andre Cronje

 Bitcoin5 months ago
Institutional Investors Go All In on Crypto as 57% Plan to Boost Allocations as Bull Run Heats Up, Sygnum Survey Reveals

 Opinion5 months ago
Crypto’s Big Trump Gamble Is Risky

 Price analysis5 months ago
Ripple-SEC Case Ends, But These 3 Rivals Could Jump 500x


✓ Share: