
bull market
Low Ethereum gas fees signal bullish mid-term sentiment

Ethereum gas fees have dropped significantly, with the average cost of a transfer now at just $0.41, far below the $15.21 peak seen in the past two years.
According to on-chain analytics firm Santiment, low gas fees often suggest a network that isn’t overly congested, which can be a bullish signal for Ethereum’s (ETH) mid-to-long-term price outlook.
The average fee of an Ethereum transfer currently sits at just $0.41, in contrast to the $15.21 high point of the past 2 years. When Ethereum transaction fees are low, it usually means the network is not overly crowded. When users are not paying high prices to move their ETH… pic.twitter.com/G22qd3eTl8
— Santiment (@santimentfeed) February 19, 2025
It is easier for new buyers to enter the market when there are lower transaction costs, which usually occur during times of price stagnation or negative sentiment. However, as traders and users scramble to transact, high fees typically signal soaring demand, which frequently results in temporary corrections.
In another development that could further lower transaction fees, the Ethereum network recently approved a vote to raise its gas limit to more than 30 million. Gas limit refers to the maximum amount of gas, or computational resources, that can be consumed by all transactions in a block
A higher gas limit means the network will be able to process more transactions per block, potentially reducing congestion and lowering fees.. Gas limit has reached 35.9 million in the past 24 hours, according to data from gaslimit.pics.
Ethereum is now trading at roughly $2,674 after falling 2% over the past day. Trading volume has increased by 10% despite the drop, indicating rising investor interest. Ethereum has been consolidating between $2,565 and $2,800 for the last two weeks, but the most recent drop to the lower end of this range suggests that there may be more declines to come.

Over $60 million worth of ETH has moved off of exchanges in the last day, according to Coinglass data, which raises the possibility that investors are accumulating ETH. Because they suggest long-term holding and lessen selling pressure, exchange outflows are frequently interpreted as optimistic indicators.
However, with $121 million in short positions at $2,650 and $90 million in long positions at $2,605, intraday traders are still being cautious. This points to a greater level of short-term bearish sentiment.
The SEC’s ruling on spot Ethereum ETFs with staking integration continues to be the largest possible bullish catalyst for ETH. Some analysts believe the lack of staking yield has limited demand for these ETFs, but approval could drive institutional inflows. As of Feb 18., total cumulative ETH ETF inflows have risen to $3.16 billion, according to data from SoSoValue.
Meanwhile, ETH’s decentralized exchange activity has surged. DefiLlama data shows that Ethereum-based protocols handled $2.62 billion in 24-hour trading volume up from $1.1 billion on Feb. 16. Ethereum is closing in on Solana, which continues to face criticism over recent meme coin rug pulls.
Source link


Following a sharp multi-week selloff that dragged Bitcoin from above $100,000 to below $80,000, the recent price bounce has traders debating whether the Bitcoin bull market is truly back on track or if this is merely a bear market rally before the next macro leg higher.
Bitcoin’s Local Bottom or Bull Market Pause?
Bitcoin’s latest correction was deep enough to rattle confidence, but shallow enough to maintain macro trend structure. Price seems to have set a local bottom between $76K–$77K, and several reliable metrics are beginning to solidify the local lows and point towards further upside.
The Net Unrealized Profit and Loss (NUPL) is one of the most reliable sentiment gauges across Bitcoin cycles. As price fell, NUPL dropped into “Anxiety” territory, but following the rebound, NUPL has now reclaimed the “Belief” zone, a critical sentiment transition historically seen at macro higher lows.

The Value Days Destroyed (VDD) Multiple weighs BTC spending by both coin age and transaction size, and compares the data to a previous yearly average, giving insight into long term holder behavior. Current readings have reset to low levels, suggesting that large, aged coins are not being moved. This is a clear signal of conviction from smart money. Similar dynamics preceded major price rallies in both the 2016/17 and 2020/21 bull cycles.

Bitcoin Long-Term Holders Boost Bull Market
We’re also now seeing the Long Term Holder Supply beginning to climb. After profit-taking above $100K, long-term participants are now re-accumulating at lower levels. Historically, these phases of accumulation have set the foundation for supply squeezes and subsequent parabolic price action.

Bitcoin Hash Ribbons Signal Bull Market Cross
The Hash Ribbons Indicator has just completed a bullish crossover, where the short-term hash rate trend moves above the longer-term average. This signal has historically aligned with bottoms and trend reversals. Given that miner behavior tends to reflect profitability expectations, this cross suggests miners are now confident in higher prices ahead.

Bitcoin Bull Market Tied to Stocks
Despite bullish on-chain data, Bitcoin remains closely tied to macro liquidity trends and equity markets, particularly the S&P 500. As long as that correlation holds, BTC will be partially at the mercy of global monetary policy, risk sentiment, and liquidity flows. While rate cut expectations have helped risk assets bounce, any sharp reversal could cause renewed choppiness for Bitcoin.

Bitcoin Bull Market Outlook
From a data-driven perspective, Bitcoin looks increasingly well-positioned for a sustained continuation of its bull cycle. On-chain metrics paint a compelling picture of resilience for the Bitcoin bull market. The Net Unrealized Profit and Loss (NUPL) has shifted from “Anxiety” during the dip to the “Belief” zone after the rebound—a transition often seen at macro higher lows. Similarly, the Value Days Destroyed (VDD) Multiple has reset to levels signaling conviction among long-term holders, echoing patterns before Bitcoin’s rallies in 2016/17 and 2020/21. These metrics point to structural strength, bolstered by long-term holders aggressively accumulating supply below $80,000.
Further supporting this, the Hash Ribbons indicator’s recent bullish crossover reflects growing miner confidence in Bitcoin’s profitability, a reliable sign of trend reversals historically. This accumulation phase suggests the Bitcoin bull market may be gearing up for a supply squeeze, a dynamic that has fueled parabolic moves before. The data collectively highlights resilience, not weakness, as long-term holders seize the dip as an opportunity. Yet, this strength hinges on more than just on-chain signals—external factors will play a critical role in what comes next.
However, macro conditions still warrant caution, as the Bitcoin bull market doesn’t operate in isolation. Bull markets take time to build momentum, often needing steady accumulation and favorable conditions to ignite the next leg higher. While the local bottom between $76K–$77K seems to hold, the path forward won’t likely feature vertical candles of peak euphoria yet. Bitcoin’s tie to the S&P 500 and global liquidity trends means volatility could emerge from shifts in monetary policy or risk sentiment.
For example, while rate cut expectations have lifted risk assets, an abrupt reversal—perhaps from inflation spikes or geopolitical shocks—could test Bitcoin’s stability. Thus, even with on-chain data signaling a robust setup, the next phase of the Bitcoin bull market will likely unfold in measured steps. Traders anticipating a return to six-figure prices will need patience as the market builds its foundation.
If you’re interested in more in-depth analysis and real-time data, consider checking out Bitcoin Magazine Pro for valuable insights into the Bitcoin market.
Disclaimer: This article is for informational purposes only and should not be considered financial advice. Always do your own research before making any investment decisions.
Source link
Bitcoin
Trader Predicts Crypto Rallies Amid Expectations of Fed Monetary Policy Shift – But There’s a Catch

A widely followed crypto analyst is predicting higher prices for crypto assets as he expects the Federal Reserve to end its anti-inflation monetary policies.
In a new thread, the pseudonymous crypto analyst Pentoshi tells his 861,300 followers on the social media platform X that we are close to seeing the end of quantitative tightening (QT), which are policies that reduce the Fed’s balance sheet and lowers the supply of money in circulation.
The trader cites data from the decentralized prediction platform Polymarket, which shows that 100% of users believe that the Fed will end QT by May of this year.
The cessation of QT is typically seen as bullish for risk assets like Bitcoin (BTC) and altcoins as the move signals the end of tight monetary conditions.
However, Pentoshi warns investors to be “cautiously optimistic” as both the S&P 500 and top crypto assets have seen growth over the last few years that appears unsustainable.
“I think we are getting close to [the] end of QT with Polymarket now pricing in odds as a sure thing whereas before they were much lower odds. As previously stated, it does seem Trump would end up forcing it. I don’t think QT automatically means it’s easy mode.
I think that mode is clearly gone overall in the way people think about it (2017/2021). While prices are much lower, I think it’s best to be cautiously optimistic. Many things are down significantly and there hopefully will be some decent mean reversion. Markets in general have rallied hard. And assets were likely a bit overvalued before.
SPX going 25% back to back years was going to have low growth or negative this year as it wasn’t a sustainable pace. BTC went from $16,000 to $108,000, SOL [from] $8 to $300. Cautiously optimistic. [Be] patient for any time capitulation, as often, following big trends, we eventually get longer sideways periods and less volatility as the market finds balance.”
While Pentoshi is flipping tactically bullish on stocks and crypto, he warns investors that any rally will likely be short-lived.
“I think any up currently will be a lower high. People underestimate the time aspect.”
At time of writing, Bitcoin is trading for $83,248.
Follow us on X, Facebook and Telegram
Don’t Miss a Beat – Subscribe to get email alerts delivered directly to your inbox
Check Price Action
Surf The Daily Hodl Mix
 

Disclaimer: Opinions expressed at The Daily Hodl are not investment advice. Investors should do their due diligence before making any high-risk investments in Bitcoin, cryptocurrency or digital assets. Please be advised that your transfers and trades are at your own risk, and any losses you may incur are your responsibility. The Daily Hodl does not recommend the buying or selling of any cryptocurrencies or digital assets, nor is The Daily Hodl an investment advisor. Please note that The Daily Hodl participates in affiliate marketing.
Generated Image: Midjourney
Source link
XRP price prediction points to a 1,500% surge if the SEC approves an ETF. Could Ripple finally reach $27 and break resistance?
Ripple’s wild ride
Ripple (XRP) has experienced a rollercoaster ride in recent months, capturing the market’s attention with large price swings and major regulatory developments.
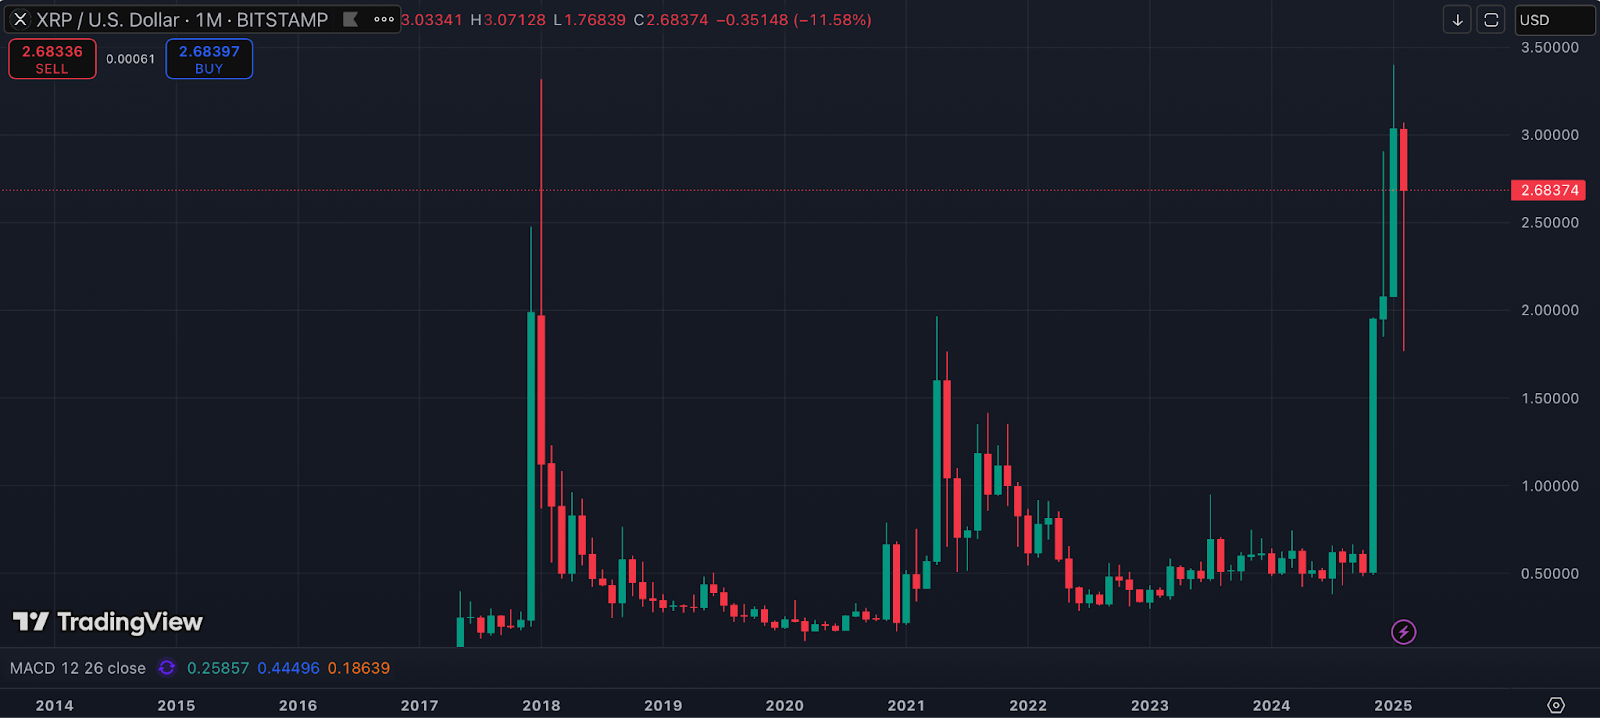
On Jan. 16, the token surged to a multi-year high of $3.39, fueled by strong market sentiment. However, the rally was short-lived.
As of Feb. 17, XRP has pulled back to $2.68, marking a 21% decline from its January peak. It remains approximately 31% below its all-time high of $3.89, which was reached in January 2018.
Despite this pullback, XRP remains one of the top-performing assets in the top 100, delivering an impressive 145% return over the past 90 days. This outpaces heavyweights like Ethereum (ETH) and Solana (SOL), both of which have lost value during the same period.
Amid these fluctuations, broader market forces are also at play. The election of President Donald Trump introduced a more crypto-friendly atmosphere in the U.S., with the Trump administration’s positive stance on digital assets boosting investor confidence. This, in turn, has contributed to the upward trajectory of crypto assets, including XRP.
Additionally, the resignation of SEC Chair Gary Gensler has further fueled optimism, as market participants anticipate a more accommodating regulatory environment under the new SEC leadership of acting chair Mark Uyeda.
With a mix of strong price action, regulatory intrigue, and shifting political winds, what can we expect from XRP? Let’s explore this further in our Ripple price prediction.
Is the XRP ETF finally coming?
Amid ongoing volatility and key developments, XRP has remained in the spotlight.
A major turning point came on Feb. 13, when the U.S. Securities and Exchange Commission formally acknowledged a filing from the New York Stock Exchange and Grayscale Investments for a spot XRP exchange-traded fund.
The proposal outlines a plan to convert Grayscale’s existing $16.1 million XRP Trust into a fully tradable ETF, with Coinbase Custody Trust Company acting as the custodian and BNY Mellon handling administrative duties.
The SEC’s acknowledgement means that the review process has officially begun, setting the stage for a potential approval or rejection within a 240-day window.
The first key deadline is set for mid-March, marking the start of a 45-day review period. After that, the SEC may either make a decision or extend the timeline, with a final decision expected by mid-October 2025.
But Grayscale isn’t the only firm pushing for an XRP ETF. The Chicago Board Options Exchange has also filed a 19b-4 application for Bitwise’s XRP ETF, with other firms also vying for approval. Unlike Grayscale, which seeks to convert an existing trust into an ETF, Bitwise is launching a completely new fund.
Matt Hougan, Bitwise’s Chief Investment Officer, recently discussed the challenges and progress of XRP ETF applications. He noted that while previous filings have seen starts and stops, with some firms withdrawing their applications, the fact that multiple issuers are now refiling suggests that the SEC is at least open to considering these ETFs.
Hougan remains cautiously optimistic, pointing out that while approval could take time, the SEC is becoming more willing to engage in discussions about these products.
He also highlighted a key difference between XRP and other commodity-based ETFs like Bitcoin and gold — those assets had regulated futures markets before their ETFs were approved, whereas XRP does not.
Although a futures market is not mandatory for XRP ETFs, it would play a key role in the approval process.
What makes these filings particularly striking is the ongoing legal battle between Ripple and the SEC. In December 2020, the SEC sued Ripple, arguing that XRP had been sold as an unregistered security.
Ripple scored a partial victory in August 2023 when a federal judge ruled that XRP is not a security when traded on secondary markets. However, regulatory uncertainty still persists, making the ETF approval process for XRP more complex compared to spot Bitcoin (BTC) or Ethereum ETFs.
Nate Geraci, president of the ETF Store, pointed out the irony — while the SEC remains in litigation with Ripple, it is simultaneously reviewing an ETF that would hold XRP. Geraci even called it an “enormous message,” suggesting that the SEC’s stance on XRP might be shifting.
Adding to the growing buzz, Bloomberg ETF analysts James Seyffart and Eric Balchunas have estimated a 65% probability of XRP ETF approval by the end of 2025.
XRP’s make-or-break moment looms
XRP is at a make-or-break moment, approaching a resistance level that has defined its fate for years.
Over the past two months, XRP has tested the $3.15 to $3.50 range, a zone that has consistently determined whether XRP breaks into a major rally or gets stuck in consolidation.
On Jan. 16, XRP reached a multi-year high of $3.39, but that attempt to push higher ultimately failed. Then, on Feb. 3, XRP plunged 43% to $1.94 as global markets were shaken by Trump’s tariff threats, causing a widespread selloff that led to one of the worst declines in crypto history.
Despite the chaos, XRP has since rebounded and is once again nearing the same resistance level, setting the stage for another potential breakout.
Beyond the short-term volatility, something even more significant is unfolding. XRP is nearing the completion of a rounding bottom pattern that has been forming since 2018, a structure that has taken nearly seven years to develop.
If XRP reaches its all-time high of $3.89, the pattern will officially complete, signalling the end of a prolonged accumulation phase. At that point, XRP would enter price discovery, meaning there would be no historical resistance left to hold it back.
The question now is what will provide the final push. Broader market conditions are not fully supportive yet, as Bitcoin hasn’t hit a new all-time high, and liquidity remains concentrated in just a few assets.
One of the biggest potential catalysts is ETF approval. If the SEC greenlights an XRP ETF, institutional demand could surge, driving prices past resistance with sheer volume.
Another key factor could be strategic adoption — if XRP is included in a financial system reserve or gains a major institutional use case, the surge in demand could propel it into uncharted territory.
The third wildcard is the SEC lawsuit appeal. If the appeal is dismissed, legal clarity alone could trigger a wave of buying.
Now, all eyes are on whether XRP can finally push through or if history will repeat itself once again. The next attempt to clear $3.50 may prove to be the most significant in its history.
XRP price prediction: Could history repeat itself?
XRP’s 2017 bull run remains a key reference point, with several indicators suggesting that XRP is now mirroring the setup that led to its parabolic rise.
One of the bullish arguments comes from Egrag Crypto, which points to the Bull Market Support Band (BMSB), a technical indicator used to determine whether an asset is in a bullish or bearish phase.
#XRP – Double Digits – 1500% Pump
:
Let’s break down what’s happening with #XRP:
Bull Market Support Band (BMSB): This is our key indicator for determining whether we’re in a #BullRun or a #BearMarket. Currently, we’re positioned above the BMSB. I mentioned in a previous… pic.twitter.com/PNB4OmuCN8
— EGRAG CRYPTO (@egragcrypto) February 6, 2025
“Currently, we’re positioned above the BMSB,” he explains, noting that he had predicted XRP would revisit this level, even when the price was at $3.40. A successful retest of this support could signal that the market is gathering strength for the next move.
Egrag draws parallels to 2017 when XRP followed a nearly identical pattern. He notes that back then, XRP nearly hit the BMSB, which preceded a 1,500% surge in just four weeks, targeting the Fib 1.618 level.
Fibonacci levels are widely used in technical analysis to predict price movements, and in 2017, XRP’s breakout followed this exact pattern. If history repeats itself, Egrag suggests a 1,500% surge to $27.
Javon Marks takes this further, highlighting how XRP’s recent price action mirrors its 2017 breakout. Prices recently tested the all-time high as resistance, just as they did in 2017 before surging beyond it. Marks’ new second target is at $99, an astonishing 3,900% increase from current levels.
$XRP to $99+
:
The truth is, most of what we have to connect dots with on XRP is its past price performance and man oh man is this breakout and run shaping up extremely similar to 2017.
Prices recently met the All Time High, using it as a resistance, just as it did in 2017… https://t.co/gjFsTxYSwG pic.twitter.com/F0wVWE8v0z
— JAVON
MARKS (@JavonTM1) February 7, 2025
Beyond Fibonacci extensions, Elliott Wave theory also points to significant potential for XRP. Dark Defender has been tracking XRP’s wave structure since July 2023, when the price was around 40 to 50 cents.
According to his analysis, XRP is currently in Wave 4 of the Intermediate Cycle, with Wave 5 targeting $5.85. His Primary Cycle Waves, which track long-term movements, suggest a major upside target of $18.22.
“I’ve used the same structure since July 2023, and we are following it as the Northern Star,” Dark Defender explains, suggesting XRP has consistently respected this pattern. If his wave count holds, XRP could be on the verge of completing a major cycle.
However, big breakouts don’t happen in isolation. XRP still faces its biggest resistance zone between $3.15 and $3.50, which requires a major catalyst to break through.
For traders looking to take advantage of this setup, risk management is key. Placing stop-loss orders can help minimize losses in case of rejection, and avoiding over-leveraging is crucial, as sudden pullbacks could lead to liquidation.
However, nothing in the crypto market is guaranteed. The same indicators that suggest explosive upside potential can also fail under changing market conditions. Trade wisely, manage risk, and never invest more than you can afford to lose.
Disclosure: This article does not represent investment advice. The content and materials featured on this page are for educational purposes only.
Source link
Bitcoin Plunges Below $84K as Crypto Sell-Off Wipes Out Weekly Gains

Top 4 Crypto to Buy Now as XRP Price Struggles above $2
Ethereum Price Hits 300-Week MA For The Second Time Ever, Here’s What Happened In 2022

US regulators FDIC and CFTC ease crypto restrictions for banks, derivatives

US Authorities Seize $201,400 Worth of USDT Held in Crypto Wallets Allegedly Intended to Support Hamas

Is Bitcoin’s Bull Market Truly Back?

Stablecoin Bills Unfairly Box Out Foreign Issuers Like Tether, Says House Majority Whip

THORChain price prediction | Is THORChain a good investment?

Strategy (MSTR) Holders Might be at Risk From Michael Saylor’s Financial Wizardry

3 Altcoins to Sell Before March 31 to Prepare for Crypto Bull Market

A Big Idea Whose Time Has Finally Come

XRP price may drop another 40% as Trump tariffs spook risk traders

Trader Says Ethereum-Based Altcoin Primed for 240%+ Rally if Major Resistance Level Breaks, Updates XRP Outlook

Congressman Ro Khanna Says Democrats Are Changing Their Tune On Bitcoin

France’s Public Investment Bank Bpifrance to Invest $27 Million in Crypto


 24/7 Cryptocurrency News5 months ago
Arthur Hayes, Murad’s Prediction For Meme Coins, AI & DeFi Coins For 2025

 Bitcoin2 months ago
Expert Sees Bitcoin Dipping To $50K While Bullish Signs Persist

 24/7 Cryptocurrency News3 months ago
Aptos Leverages Chainlink To Enhance Scalability and Data Access

 Bitcoin5 months ago
Bitcoin Could Rally to $80,000 on the Eve of US Elections

 Altcoins2 months ago
Sonic Now ‘Golden Standard’ of Layer-2s After Scaling Transactions to 16,000+ per Second, Says Andre Cronje

 Bitcoin4 months ago
Institutional Investors Go All In on Crypto as 57% Plan to Boost Allocations as Bull Run Heats Up, Sygnum Survey Reveals

 Opinion5 months ago
Crypto’s Big Trump Gamble Is Risky

 Price analysis5 months ago
Ripple-SEC Case Ends, But These 3 Rivals Could Jump 500x
