Altcoins
XRP Price Hits 3-Year High At $1.6
Published
4 months agoon
By
admin
The XRP price recently surged to a three-year high of $1.6, marking a significant milestone in the cryptocurrency’s recent bullish rally. This remarkable price movement has garnered the attention of many analysts as investors continue to project the trajectory of the price.
Related Reading
There are basically two ways the XRP price can go from here: either a continued move upwards or a notable correction. An in-between is a consolidation pattern.
CrediBULL Crypto shared his insights on the potential paths the altcoin might take next. Using the Elliott Wave Theory, he highlighted two scenarios that could shape XRP’s near-term future.
What’s The Next Path For XRP Price?
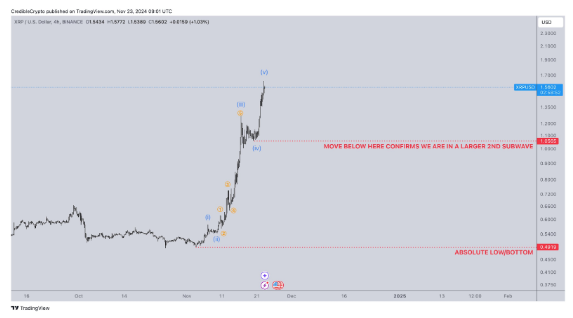
According to CrediBULL Crypto, XRP’s recent rally exhibits a textbook example of a five-wave impulsive move, complete with clearly identifiable subwaves. This pattern confirms that the cryptocurrency has likely reached its absolute bottom at the November low of $0.49, which is a strong foundation for its current upward trend.
The impulsive wave structure suggests that the crypto is at a pivotal juncture, and its future trajectory hinges on whether it sustains specific price levels.
The first possibility centers on XRP failing to maintain its position above $1.05, which is the origin of the fifth subwave in the current impulsive structure. Should this level break, it would confirm that the XRP price is in a larger Wave 2 correction.
According to the Elliot Waves Theory, Waves 2 and 4 are corrective waves, while Waves 1, 3, and 5 are the main bullish waves. before This correction, while bearish in the short term, would lay the groundwork for an even stronger Wave 3 rally in the future.
CrediBULL Crypto predicts a very different outcome if the XRP price manages to hold above the $1.05 level. Holding above the $1.05 level would indicate that the fifth subwave is extending. In this case, the analyst predicted that the XRP price will surpass the $2 mark before experiencing any substantial pullback.

The Road Ahead For XRP
XRP, which had lingered below the $1 threshold for the past three years, has now firmly established itself above this pivotal mark. The recent XRP price surge to $1.6 suggests that the cryptocurrency is in a stronger position to target the $2 milestone rather than retreat into a significant correction. This bullish sentiment is bolstered by speculation around SEC Chairman Gary Gensler’s anticipated resignation in January 2025.
Related Reading
The XRP price climb to $1.6 reflects its growing strength in the market. Nonetheless, the next phase of its journey depends on key support and resistance levels. At the time of writing, the XRP price is trading at $1.46, having corrected by about 8.5% in the past 24 hours. However, the XRP price is still up by 175% in the past 30 days.
Featured image from Pexels, chart from TradingView
Source link
You may like


‘Positive But Cautious’ Investors Pour Capital Into Ethereum, Solana, XRP and Sui: CoinShares


Bitcoin As The Global Denominator Of Capital


Trump’s Crypto Dealings Are Making Regulation ‘More Complicated’: House Financial Services Chair


Pontus-X taps Oasis for private, cross-border data sharing in E.U.


Elon Musk, Dogecoin Proponent and U.S. Agency Figurehead, Says ‘No DOGE in D.O.G.E.’


Crypto Investor’s Brave Yet Hilarious Prediction Speculates If XRP Price Will Hit $3,000 This Cycle
Altcoins
‘Positive But Cautious’ Investors Pour Capital Into Ethereum, Solana, XRP and Sui: CoinShares
Published
10 minutes agoon
March 31, 2025By
admin
Crypto asset manager and research firm CoinShares says institutional investors poured millions of dollars into altcoin digital asset investment products last week.
In its latest Digital Asset Fund Flows Weekly Report, CoinShares says crypto products enjoyed inflows last week after record-setting levels of outflows.
“Digital asset investment products saw US$226m of inflows last week suggesting a positive but cautious investor. Following the largest outflows on record, ETPs have seen 9 consecutive trading days of inflows.
Last Friday was the exception, seeing minor outflows totaling US$74m, likely in reaction to core personal consumption expenditure in the US coming in above expectations, implying the US Federal Reserve is likely to remain hawkish despite recent data alluding to weak growth.”

Bitcoin (BTC) products, as usual, led the charge with $195 million in inflows. The king crypto was followed by altcoins, which broke a month-long streak of outflows. Leading inflows were Ethereum (ETH), Solana (SOL), XRP and Sui (SUI).
“Altcoins in aggregate saw their first week of inflows totaling US$33m, following 4 consecutive weeks of outflows totaling US$1.7bn. The key beneficiaries being Ethereum, Solana, XRP and Sui, with inflows of US$14.5m, US$7.8m, US$4.8m and US$4.0m respectively.”
Regionally, the US led the world with $204 million in inflows. Switzerland and Germany also pitched in $14.7 and $9.2 million in inflows, respectively.
Follow us on X, Facebook and Telegram
Don’t Miss a Beat – Subscribe to get email alerts delivered directly to your inbox
Check Price Action
Surf The Daily Hodl Mix
 

Disclaimer: Opinions expressed at The Daily Hodl are not investment advice. Investors should do their due diligence before making any high-risk investments in Bitcoin, cryptocurrency or digital assets. Please be advised that your transfers and trades are at your own risk, and any losses you may incur are your responsibility. The Daily Hodl does not recommend the buying or selling of any cryptocurrencies or digital assets, nor is The Daily Hodl an investment advisor. Please note that The Daily Hodl participates in affiliate marketing.
Generated Image: DALLE3
Source link
Altcoins
MELANIA Insider Hayden Davis Selling Millions of Dollars Worth of Memecoin Amid 95% Drop: On-Chain Data
Published
19 hours agoon
March 31, 2025By
admin
A memecoin creator notorious for being involved with several controversial projects is continuing to dump his coins even after a 95% drop.
New data from the blockchain tracking firm Bubblemaps is shedding light on on-chain activity of Hayden Davis, who admitted to having a role in both Libra (LIBRA), a memecoin originally backed by Argentinian President Javier Milei before he quickly disavowed it, and Melania Meme (MELANIA), a coin inspired by Melania Trump.
MELANIA began a steep descent the very day it was launched in January and is now down 95.3%.
Says Bubblemaps,
“Hayden Davis is STILL selling MELANIA
He recently sent $1 million to exchanges and extracted over $2 million from the liquidity pools…
For weeks, his MELANIA wallets were inactive – until now…
In total, Hayden sent $1,065,153 worth of MELANIA to centralized exchanges and extracted $2,050,666 from the liquidity pool over the last 14 days.
And many wallets haven’t sold yet.
Why act now?
Hayden may have seen the recent drop in attention as a window to quietly move funds while fewer people were watching
We’ll keep monitoring for further activity.”
At time of writing, MELANIA is trading for $0.615.
Argentinian authorities are reportedly attempting to have Davis arrested by Interpol for his role in LIBRA.
Says prosecutor Gregorio Dalbón,
“I’m here to request the immediate detention of Hayden Mark Davis, a citizen of the United States, who is accused of being one of the principal actors behind the launch of the cryptocurrency LIBRA…
The possibility that Davis will abandon his country of residence or hide to avoid answering for his alleged acts appears to be aggravated by the economic resources he possesses, which he can use to move or remain in hiding, hindering our investigation.”
President Milei quickly disavowed LIBRA, claiming that he was tricked into supporting its launch.
Said Milei in Spanish,
“I was not aware of the details of the project and after having become aware of it I decided not to continue spreading the word (that is why I deleted the tweet).
To the filthy rats of the political caste who want to take advantage of this situation to do harm, I want to say that every day they confirm how vile politicians are, and they increase our conviction to kick them in the a**.”
Follow us on X, Facebook and Telegram
Don’t Miss a Beat – Subscribe to get email alerts delivered directly to your inbox
Check Price Action
Surf The Daily Hodl Mix
 

Disclaimer: Opinions expressed at The Daily Hodl are not investment advice. Investors should do their due diligence before making any high-risk investments in Bitcoin, cryptocurrency or digital assets. Please be advised that your transfers and trades are at your own risk, and any losses you may incur are your responsibility. The Daily Hodl does not recommend the buying or selling of any cryptocurrencies or digital assets, nor is The Daily Hodl an investment advisor. Please note that The Daily Hodl participates in affiliate marketing.
Generated Image: DALLE3
Source link
Altcoins
Nasdaq Files To Launch a New Grayscale Avalanche (AVAX) Exchange-Traded Fund
Published
2 days agoon
March 30, 2025By
admin
Digital asset management giant Grayscale hopes to launch an Avalanche (AVAX) exchange-traded fund (ETF) in the US.
The Nasdaq Stock Market submitted a proposal this week to the U.S. Securities and Exchange Commission (SEC) to list and trade shares of Grayscale Avalanche Trust, which would be entirely tied to the price of the layer-1 project’s native asset, AVAX.
Grayscale isn’t the first financial giant to file for an Avalanche ETF. Documents submitted to the state of Delaware earlier this month suggest VanEck also hopes to launch a fund tied to the Ethereum (ETH) rival.
Coinbase Custody will serve as the custodian for Grayscale’s Avalanche ETF if it’s approved. The crypto asset manager also hopes to launch funds tied to Cardano (ADA), Solana (SOL), XRP and Hedera (HBAR).
The SEC greenlit the first spot market Bitcoin (BTC) ETFs in January 2024, bringing in billions of dollars worth of inflows to the top digital asset by market cap. The regulator subsequently approved Ethereum ETFs for trading last July.
Two financial firms, Franklin Templeton and Hashdex, also launched joint BTC-ETH ETFs earlier this year.
AVAX is trading at $20.36 at time of writing. The 17th-ranked crypto asset by market cap is down nearly 8% in the past 24 hours.
Follow us on X, Facebook and Telegram
Don’t Miss a Beat – Subscribe to get email alerts delivered directly to your inbox
Check Price Action
Surf The Daily Hodl Mix
 

Disclaimer: Opinions expressed at The Daily Hodl are not investment advice. Investors should do their due diligence before making any high-risk investments in Bitcoin, cryptocurrency or digital assets. Please be advised that your transfers and trades are at your own risk, and any losses you may incur are your responsibility. The Daily Hodl does not recommend the buying or selling of any cryptocurrencies or digital assets, nor is The Daily Hodl an investment advisor. Please note that The Daily Hodl participates in affiliate marketing.
Generated Image: Midjourney
Source link

‘Positive But Cautious’ Investors Pour Capital Into Ethereum, Solana, XRP and Sui: CoinShares

Bitcoin As The Global Denominator Of Capital

Trump’s Crypto Dealings Are Making Regulation ‘More Complicated’: House Financial Services Chair

Pontus-X taps Oasis for private, cross-border data sharing in E.U.

Elon Musk, Dogecoin Proponent and U.S. Agency Figurehead, Says ‘No DOGE in D.O.G.E.’

Crypto Investor’s Brave Yet Hilarious Prediction Speculates If XRP Price Will Hit $3,000 This Cycle

Dogecoin (DOGE) Bulls In Trouble—Can They Prevent a Drop Below $0.15?

California introduces ’Bitcoin rights’ in amended digital assets bill

MELANIA Insider Hayden Davis Selling Millions of Dollars Worth of Memecoin Amid 95% Drop: On-Chain Data

Toulouse starts to accept crypto for public transport

Bitcoin, Crypto Prices Slide as Trade Tensions, Inflation Risks Rattle Markets

Will BlackRock Investors Stay Bullish?

Bitcoin Could Appear on 25% of S&P 500 Balance Sheets by 2030, Analyst Says

Centralization and the dark side of asset tokenization — MEXC exec

Bitcoin Support Thins Below $78,000 As Cost Basis Clusters Shift Toward $95,000

Arthur Hayes, Murad’s Prediction For Meme Coins, AI & DeFi Coins For 2025

Expert Sees Bitcoin Dipping To $50K While Bullish Signs Persist

Aptos Leverages Chainlink To Enhance Scalability and Data Access

Bitcoin Could Rally to $80,000 on the Eve of US Elections

Sonic Now ‘Golden Standard’ of Layer-2s After Scaling Transactions to 16,000+ per Second, Says Andre Cronje

Institutional Investors Go All In on Crypto as 57% Plan to Boost Allocations as Bull Run Heats Up, Sygnum Survey Reveals

Crypto’s Big Trump Gamble Is Risky

Ripple-SEC Case Ends, But These 3 Rivals Could Jump 500x

Has The Bitcoin Price Already Peaked?

A16z-backed Espresso announces mainnet launch of core product

Xmas Altcoin Rally Insights by BNM Agent I

Blockchain groups challenge new broker reporting rule

The Future of Bitcoin: Scaling, Institutional Adoption, and Strategic Reserves with Rich Rines

Trump’s Coin Is About As Revolutionary As OneCoin

Is $200,000 a Realistic Bitcoin Price Target for This Cycle?
Trending

 24/7 Cryptocurrency News5 months ago
Arthur Hayes, Murad’s Prediction For Meme Coins, AI & DeFi Coins For 2025

 Bitcoin2 months ago
Expert Sees Bitcoin Dipping To $50K While Bullish Signs Persist

 24/7 Cryptocurrency News3 months ago
Aptos Leverages Chainlink To Enhance Scalability and Data Access

 Bitcoin5 months ago
Bitcoin Could Rally to $80,000 on the Eve of US Elections

 Altcoins2 months ago
Sonic Now ‘Golden Standard’ of Layer-2s After Scaling Transactions to 16,000+ per Second, Says Andre Cronje

 Bitcoin5 months ago
Institutional Investors Go All In on Crypto as 57% Plan to Boost Allocations as Bull Run Heats Up, Sygnum Survey Reveals

 Opinion5 months ago
Crypto’s Big Trump Gamble Is Risky

 Price analysis5 months ago
Ripple-SEC Case Ends, But These 3 Rivals Could Jump 500x


