
Altcoins
CurveDAO (CRV) Nears All-Time Low Following Whale Deposit to Binance: On-Chain Data

CRV, the native token of stablecoin lending platform CurveDAO, is close to all-time lows again as the ecosystem attempts a recovery from a large liquidation event this month.
Blockchain tracking firm Lookonchain reports that a whale deposited over $6 million worth of CRV to Binance, presumably to sell at a loss.
“The 22 million CRV was bought after the CRV liquidation, with a buying price of ~$0.33.
Selling now will result in a loss of ~$1 million.”
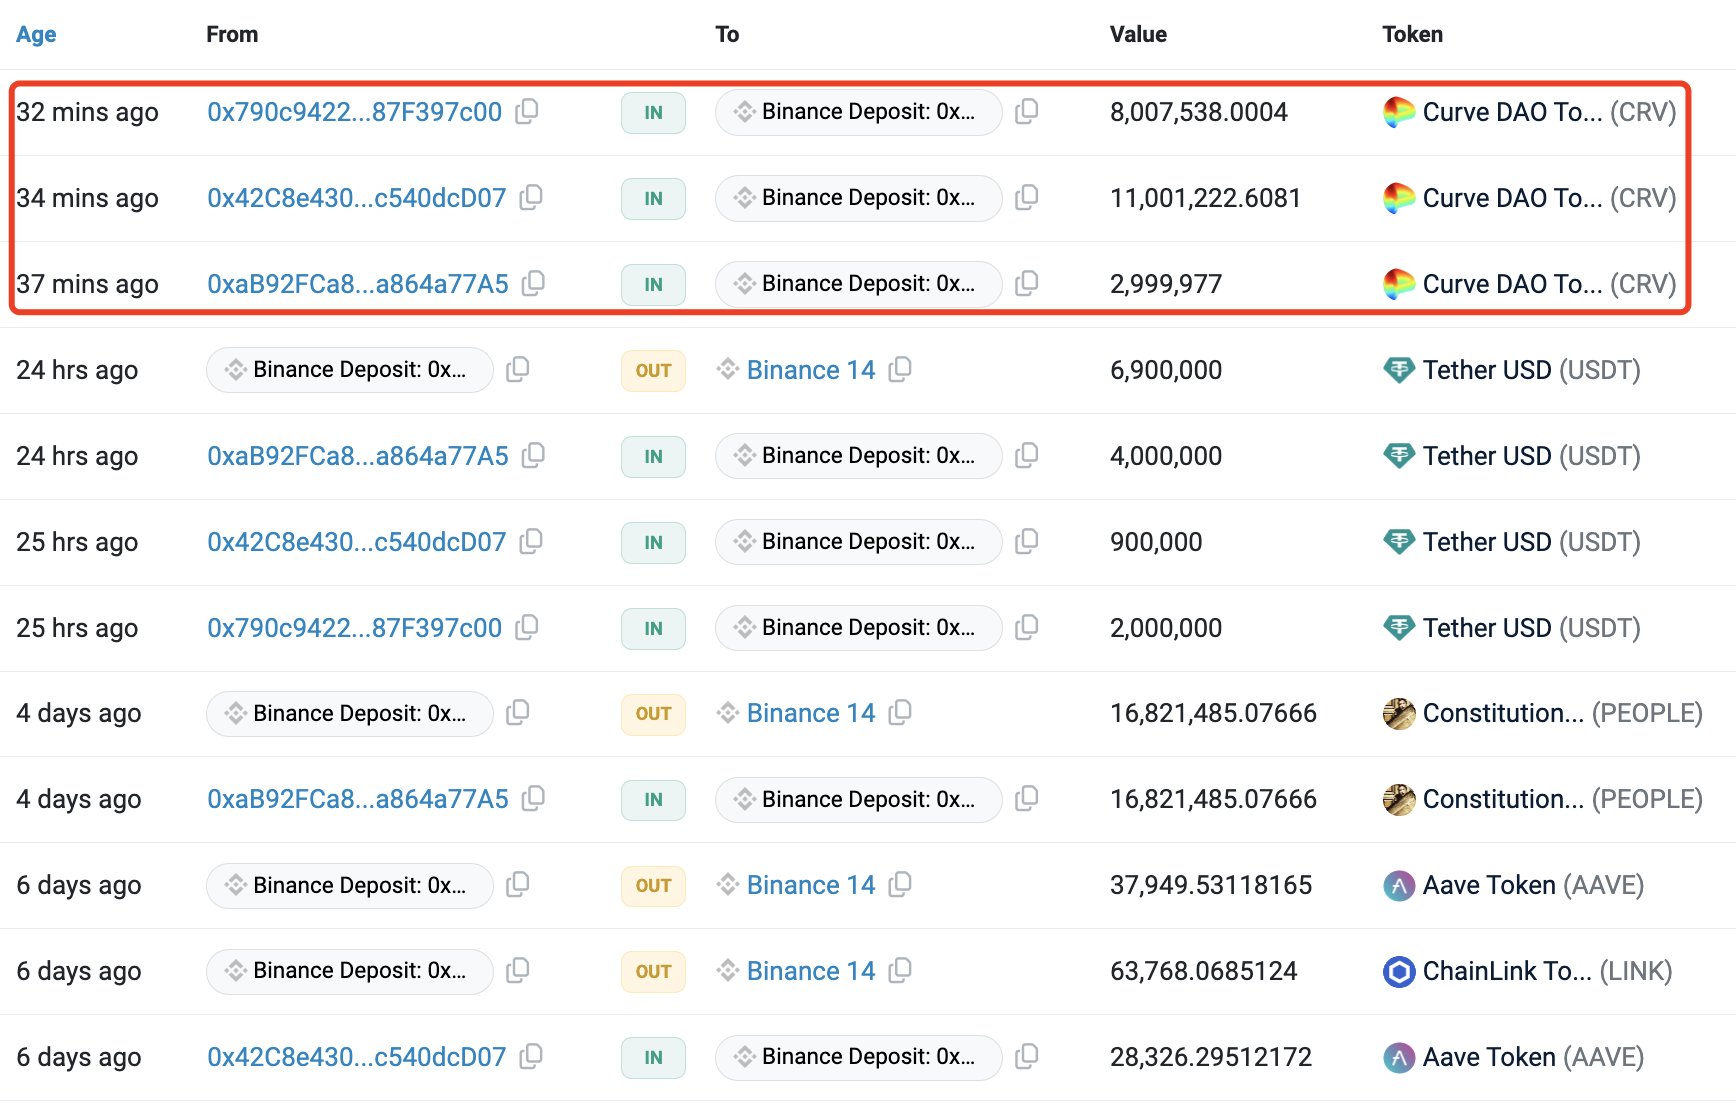
On June 13th, Curve founder Michael Egorov announced that all of his loans, reportedly worth roughly $156 million, were liquidated. He also said that he sold millions of CRV tokens in an organized transaction to one of the partners of crypto asset investment firm NextGen Digital Venture.
“The amount of CRV liquidations was very large for the market to handle in half an hour (1/3 of circulating supply or so), so to prevent any bad debt, I sold 30 million of my not yet vested CRV to @Christianeth on June 13th . Those 30 million CRV are being received by him in chunks by mid-August.
If you see CRV transactions from my wallet to christian2022.eth, they are related to that deal…”
On the same day of Egorov’s liquidation, CRV dropped to an all-time low of $0.239. Currently, CRV is trading at $0.28 and is now 98.3% down from its all-time high of $15.37.
Don’t Miss a Beat – Subscribe to get email alerts delivered directly to your inbox
Check Price Action
Follow us on X, Facebook and Telegram
Surf The Daily Hodl Mix
 

Disclaimer: Opinions expressed at The Daily Hodl are not investment advice. Investors should do their due diligence before making any high-risk investments in Bitcoin, cryptocurrency or digital assets. Please be advised that your transfers and trades are at your own risk, and any losses you may incur are your responsibility. The Daily Hodl does not recommend the buying or selling of any cryptocurrencies or digital assets, nor is The Daily Hodl an investment advisor. Please note that The Daily Hodl participates in affiliate marketing.
Generated Image: Midjourney
Source link


The winds of change are swirling around Polkadot (DOT). After a month-long slump that mirrored a broader cryptocurrency market downturn, DOT finds itself at a critical juncture.

Technical indicators hint at a bullish reversal, with some analysts predicting a significant price surge for the interoperable blockchain darling. However, a recent spending spree by the Polkadot Foundation has cast a shadow of doubt, leaving the community divided.
Falling Wedge Hints At Breakout, Analysts Eye $9 Target
As technical analysis presents a potentially hopeful picture, DOT holders’ hope wavers. On the daily chart, a “falling wedge” pattern—historically a bullish indication—has been observed. This pattern suggests a price squeeze between converging trendlines, often culminating in a sharp breakout.
Related Reading
Renowned analyst Jonathan Carter pinpoints $6.50 as the key resistance level. A decisive break above this point could trigger a surge in buying pressure, propelling DOT towards his projected profit targets of $7.75 and even $9.00.
Polkadot forming falling wedge on daily timeframe💁♂️
Key resistance at $6.5 – need to break for bullish structure☝️
Consider setting profit targets at $7.75 and $9.00 levels🎯 pic.twitter.com/OwPVFaPZyD
— Jonathan Carter (@JohncyCrypto) July 3, 2024
The falling wedge pattern and increasing trading volume suggest a potential breakout is imminent. A successful breach of the $6.50 resistance could signal a significant shift in market sentiment, paving the way for a substantial price increase.
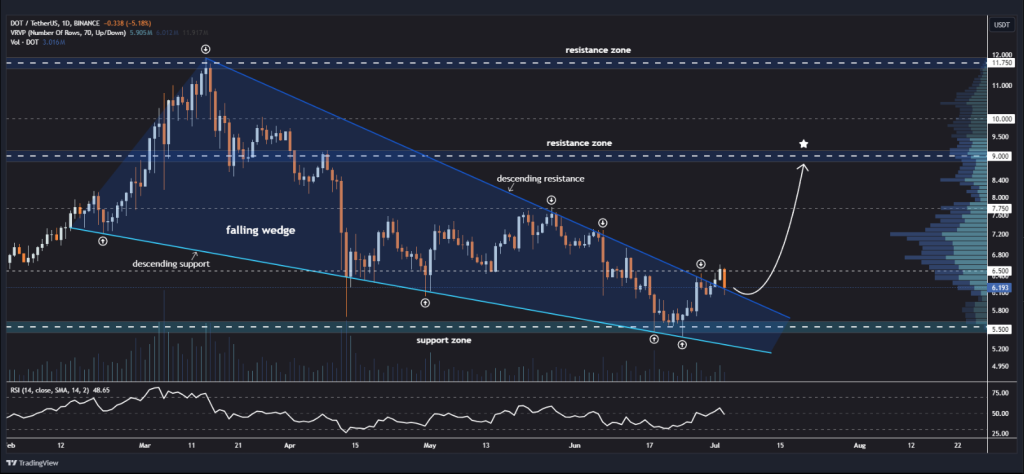
Buoying this optimism is the Relative Strength Index (RSI), currently hovering around 48.65. This neutral level indicates that DOT is neither overbought nor oversold, leaving room for further upward momentum.
Polkadot Foundation’s Spending Spree
However, a recent spending spree by the Polkadot Foundation has injected a dose of skepticism into the bullish narrative. Earlier this year, the Foundation burned through a staggering $87 million, leaving its coffers with a significantly reduced balance.
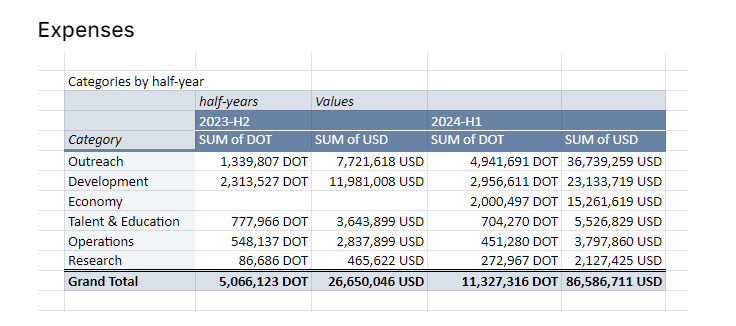
The breakdown reveals $36.7 million allocated for advertising and events, $15 million for trading platform incentives, and $23 million for development. While the Foundation maintains these investments are crucial for boosting network visibility and adoption, community members are not convinced.
Many point out that despite the hefty spending, Polkadot continues to lag behind competitors like Ethereum and Solana in key metrics like network activity, developer engagement, and total value locked (TVL).
Related Reading
The spending seems excessive, especially considering the lack of tangible results, some community members on the Polkadot forum said. The blockchain needs to see a better return on investment before the Foundation throws more money at marketing campaigns, they said.
Will Spending Concerns Spook Investors?
The coming days will be crucial for DOT. If the technical indicators hold true and the price breaks above $6.50, a significant rally could be in the cards.
However, the community’s concerns about the Foundation’s spending habits cannot be ignored. If these concerns translate into a broader sell-off, the potential breakout might fizzle.
Featured image from Shutterstock, chart from TradingView
Source link
A closely followed crypto strategist and trader is revealing his price targets for Bitcoin (BTC) and two altcoin projects.
In a new strategy session, analyst Jason Pizzino tells his 329,000 YouTube subscribers that based on the average true range (ATR) indicator Bitcoin could soon break through key price target resistance levels.
The ATR indicator measures volatility by showing an asset’s trading range over a specified period.
“You can see the dying off here of the average true range of the bar. Previous cycles, look what happened. Average true range picks up, dies off, dies off, dies off, and then you start to get a higher low form and by that stage, you’re really a decent way from the stealth zone.”
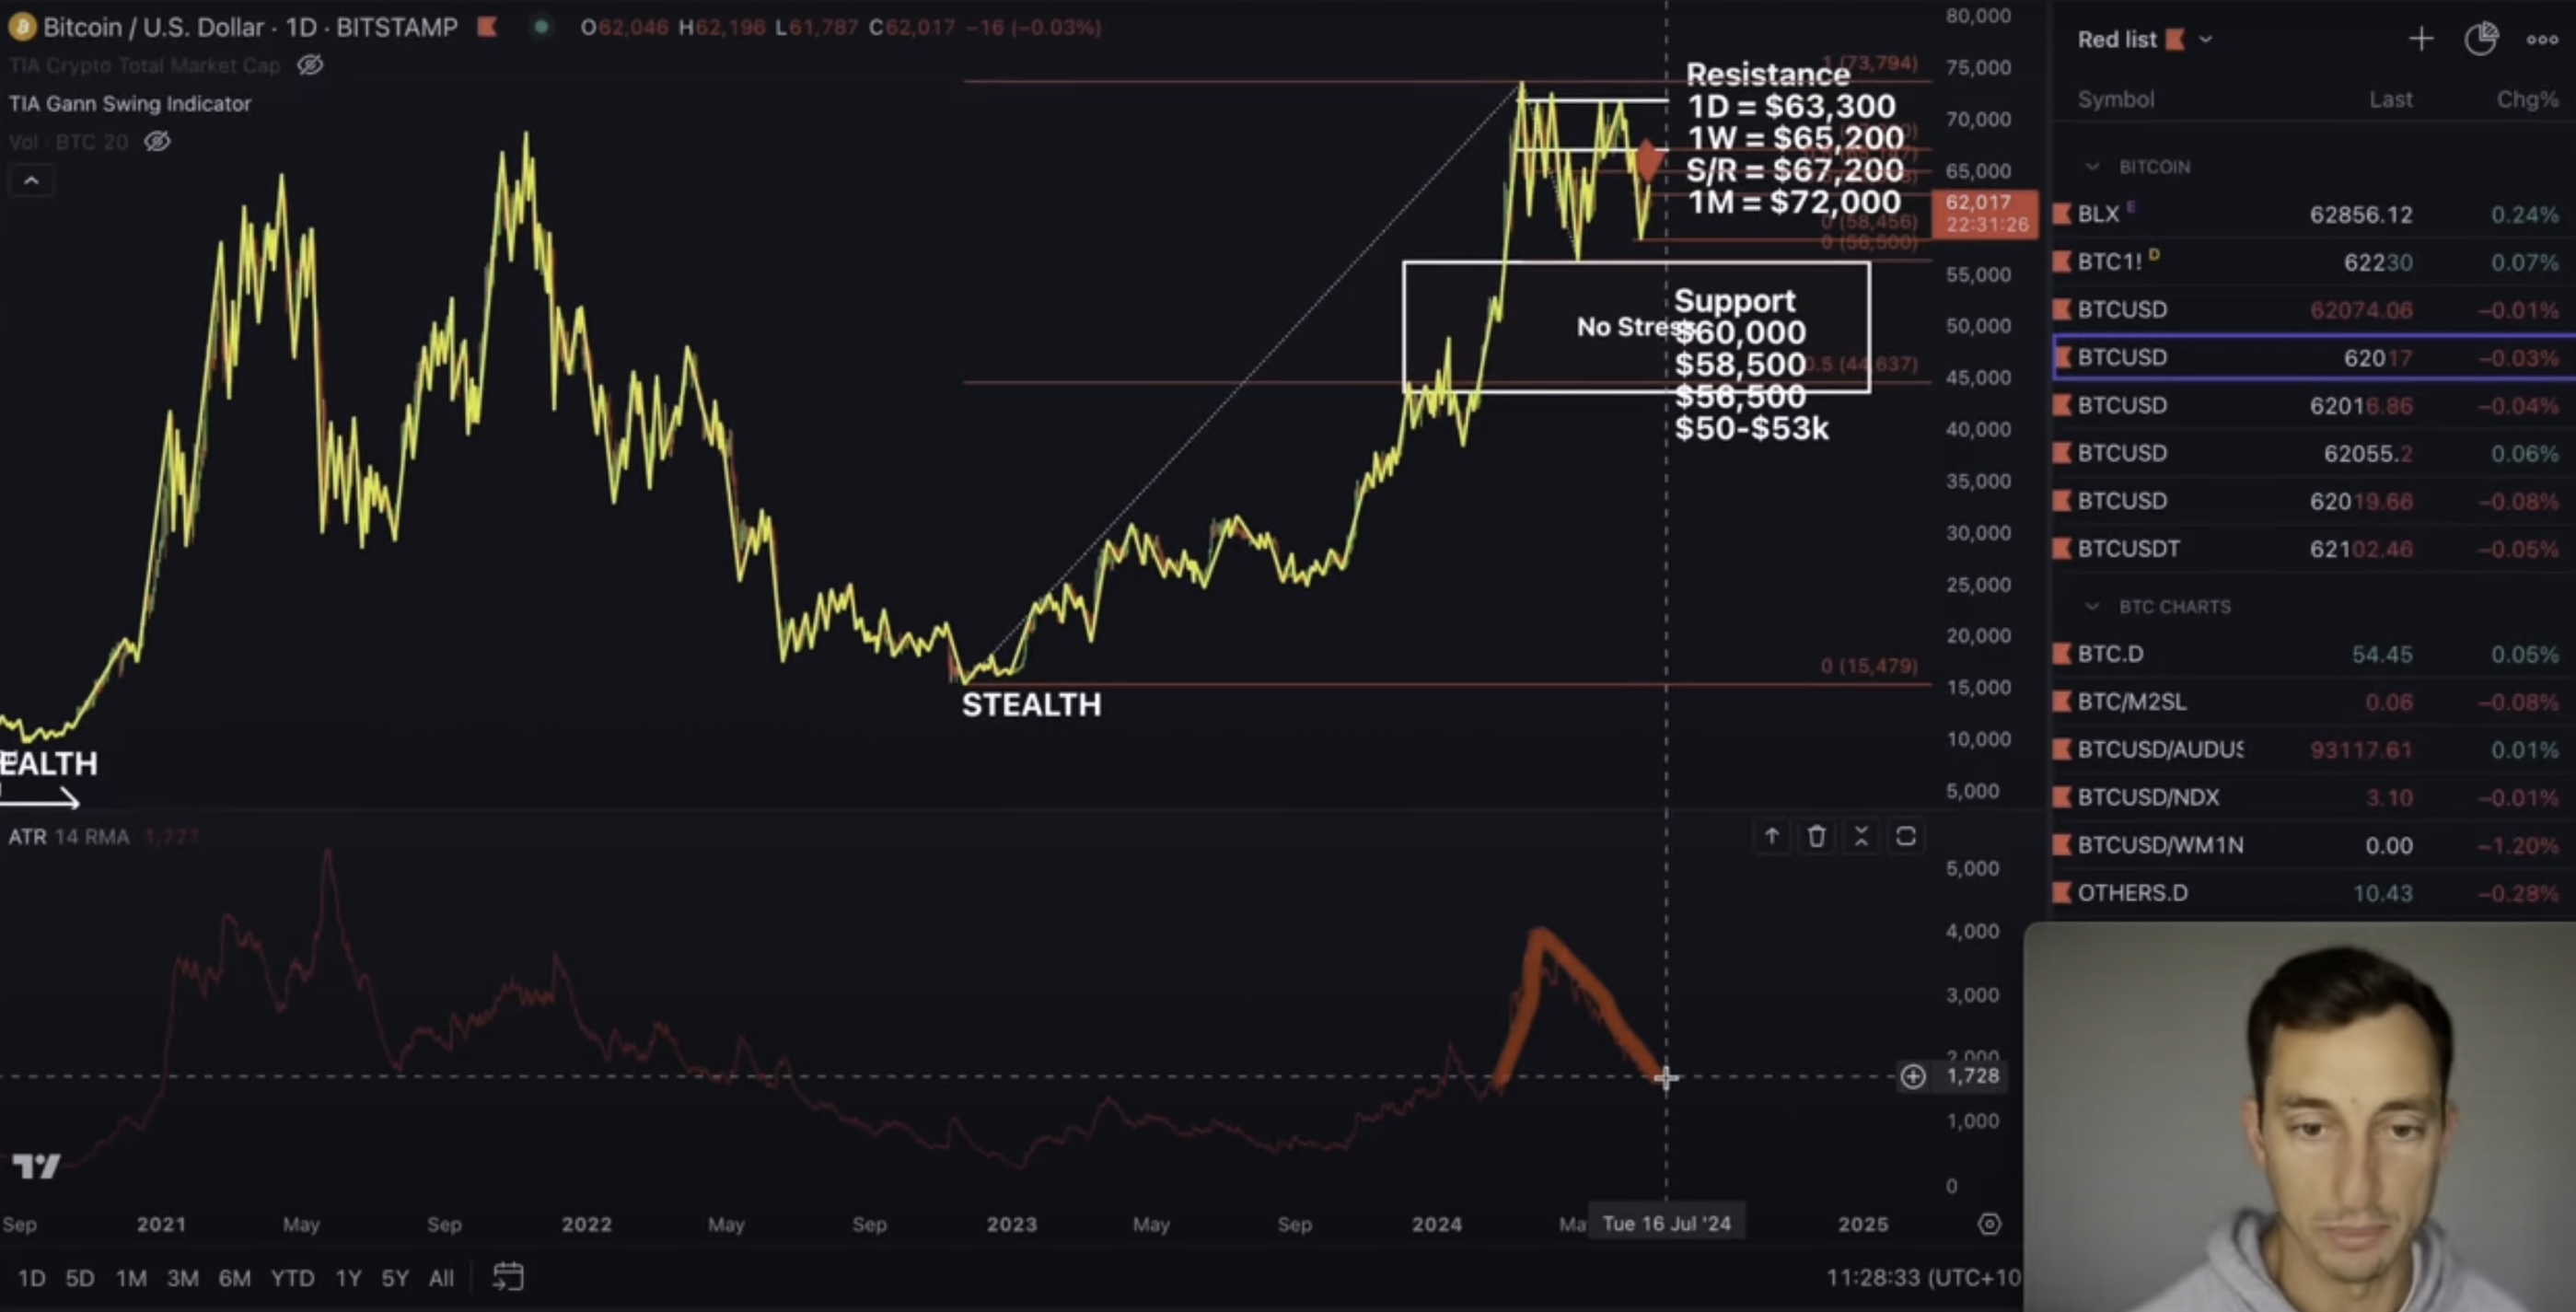
According to the analyst, Bitcoin has historically made “stealth moves” to the upside when the ATR indicator reaches a local low and price continues to consolidate or puts in higher lows.
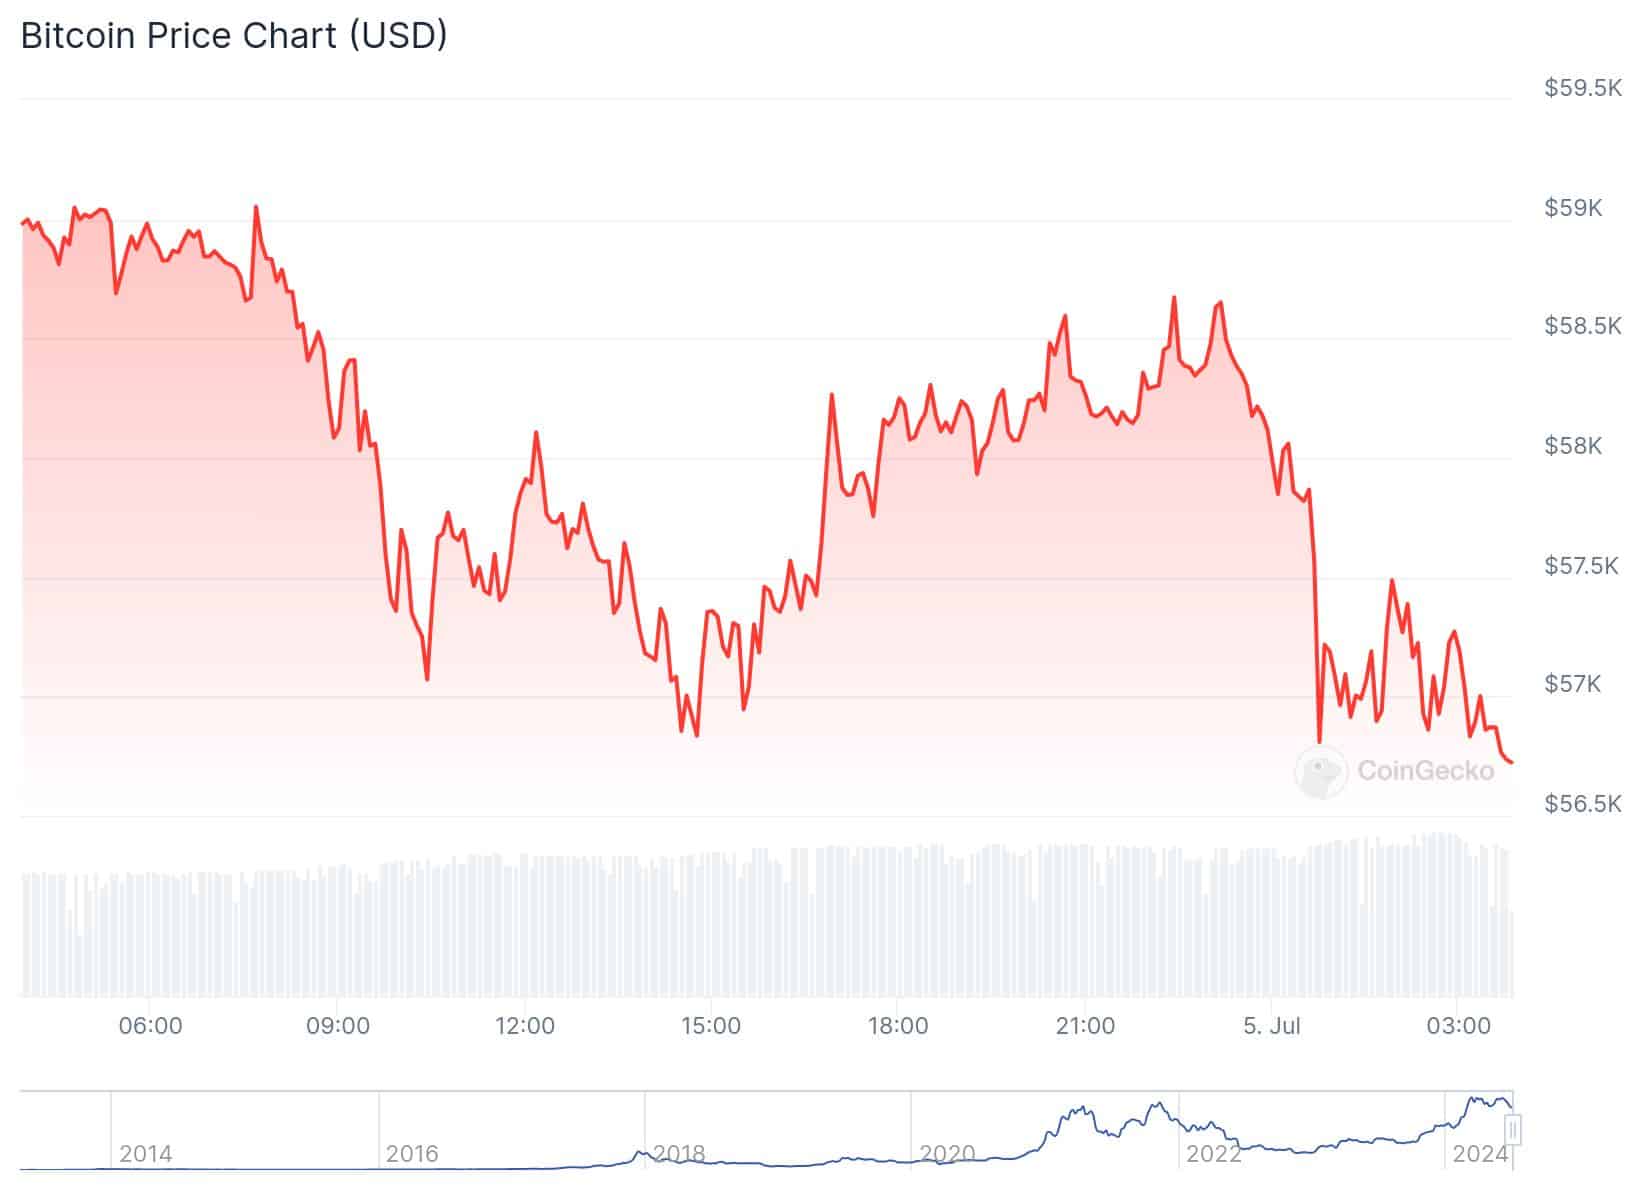
The analyst’s key price targets to the upside include $63,300 on the daily chart, $65,200 on the weekly chart and $72,000 on the monthly chart.
Bitcoin is trading for $60,176 at time of writing, down nearly 3% in the last 24 hours.
Next up, the analyst believes that Ethereum (ETH) competitor Solana (SOL) will move toward its current cycle top.
“With the higher lows and now trying to push higher above the 50% at $137. Next target on the weekly chart is $165. And then we go towards $190, $210. So $190 is above these tops. Then $210 is the current top for Solana. So it’s on its way. It hasn’t got those longer-term time frames confirmed yet, and those longer terms are the weeklies.”
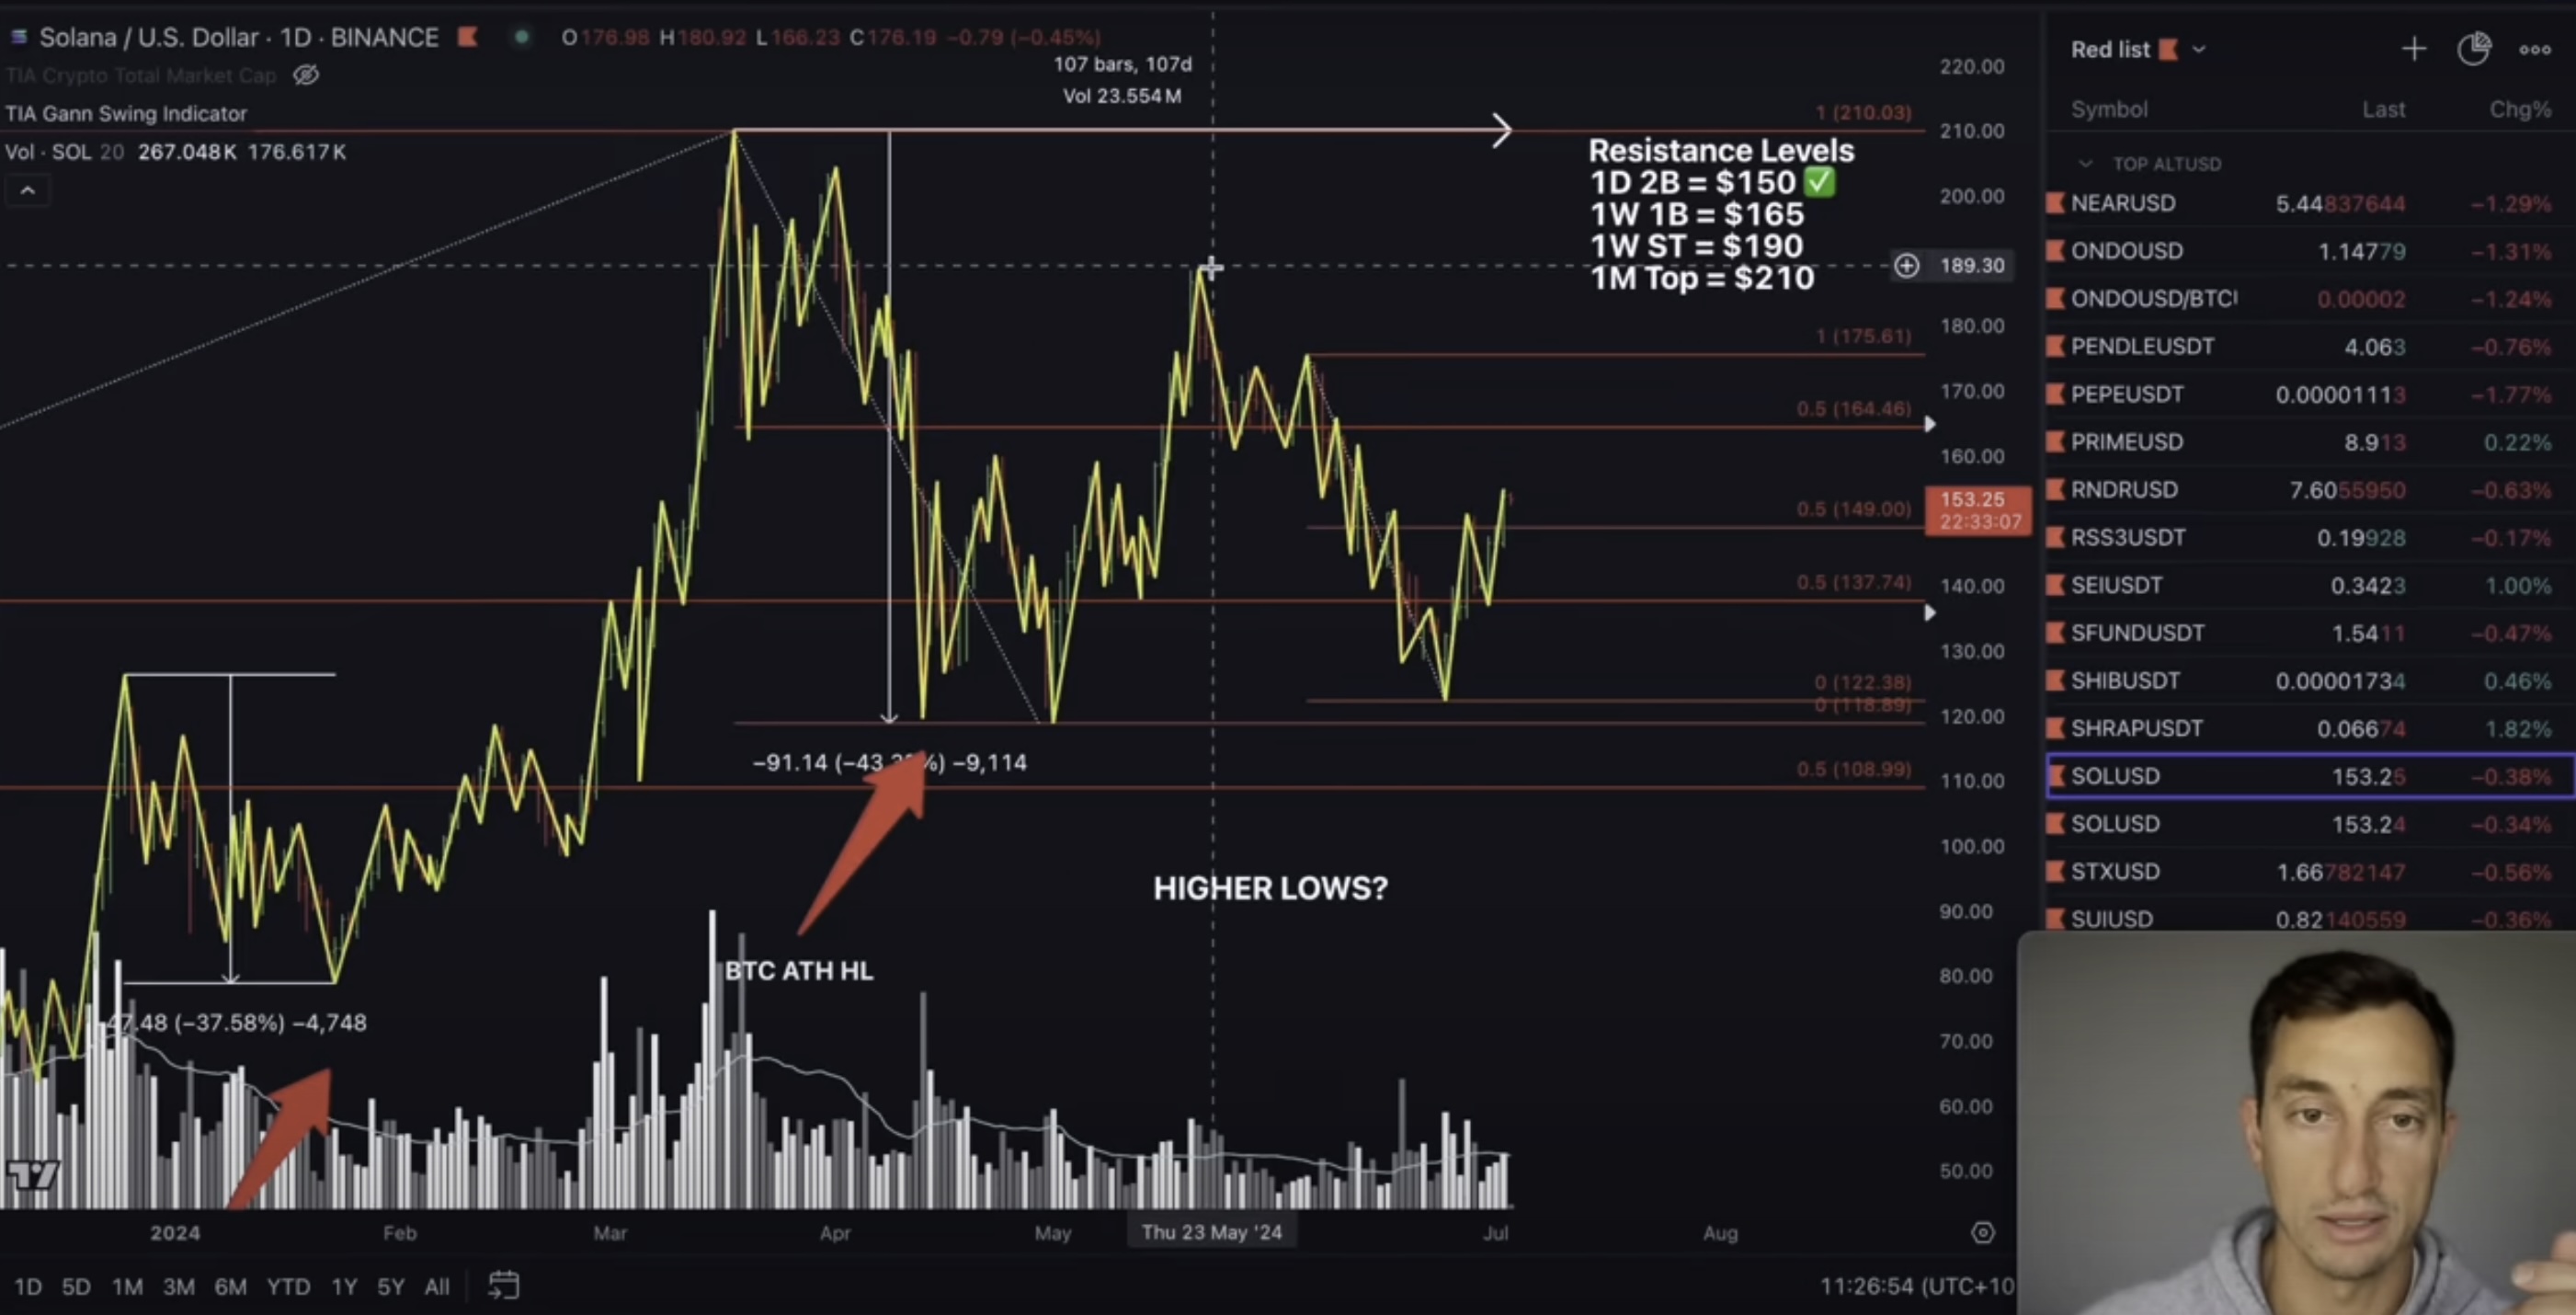
Solana is trading for $141 at time of writing, down more than 8% in the last 24 hours.
Lastly, the analyst predicts that Render (RNDR), the graphics processing unit (GPU) rendering blockchain, will reclaim a double-digit value.
“Now, what do we need to see until it gets there? Obviously higher lows, and that would happen throughout this next couple of months, maybe even up to four months as we get to that [US presidential] election… If I keep seeing higher lows, it’s not going to stop me from getting into the market if it breaks out through that period.”
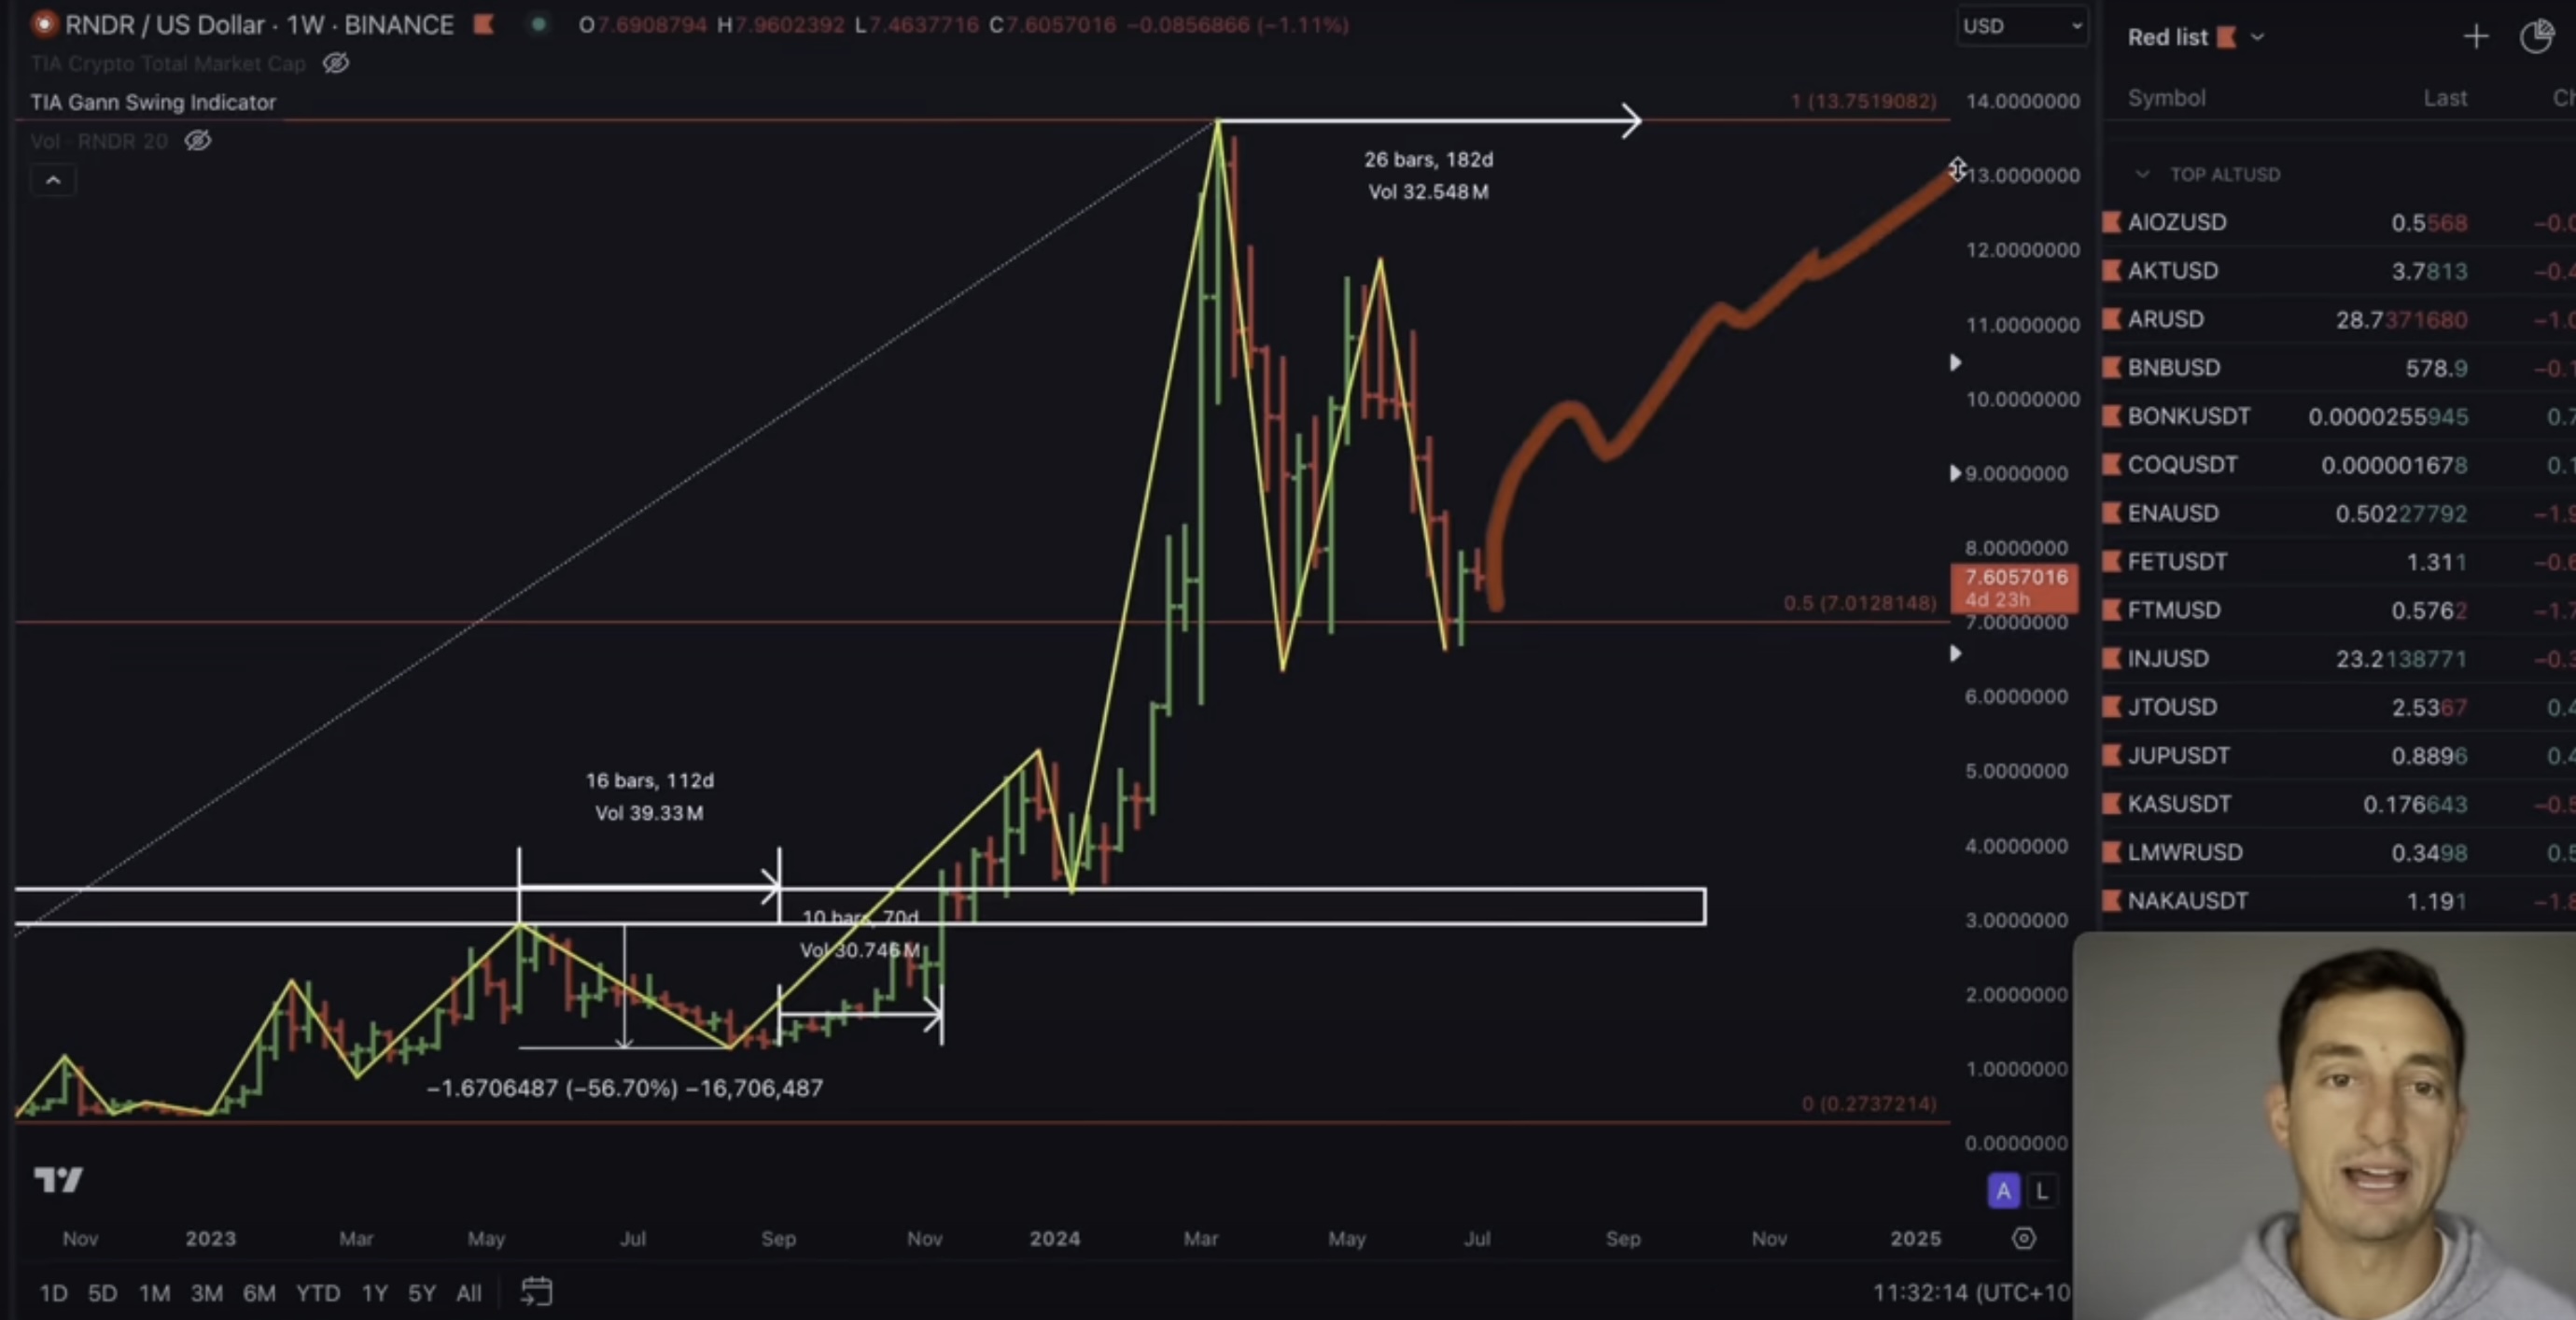
Render is trading for $7.04 at time of writing, down 7.7% in the last 24 hours.
Don’t Miss a Beat – Subscribe to get email alerts delivered directly to your inbox
Check Price Action
Follow us on X, Facebook and Telegram
Surf The Daily Hodl Mix
 
Disclaimer: Opinions expressed at The Daily Hodl are not investment advice. Investors should do their due diligence before making any high-risk investments in Bitcoin, cryptocurrency or digital assets. Please be advised that your transfers and trades are at your own risk, and any losses you may incur are your responsibility. The Daily Hodl does not recommend the buying or selling of any cryptocurrencies or digital assets, nor is The Daily Hodl an investment advisor. Please note that The Daily Hodl participates in affiliate marketing.
Generated Image: Midjourney
Source link
Ethereum and other altcoins have tumbled to lows not recorded in several weeks. This bearish outlook was also recorded in Bitcoin (BTC) and other decentralized finance (DeFi) tokens. Ethereum price has taken steps back wiping out previously recorded gains this week. A major reason for the market decline is a fall in sentiments with many pointing to major market corrections.
The total crypto market fell to $2.11 trillion, a 4.8% decline in the last 24 hours. Meanwhile, several altcoins notched wider losses today deepening the negative sentiments. The drop in the ETH price also coincides with lower on-chain numbers and a transfer of assets to centralized exchanges which signals potential sales.
Ethereum Price Nears $3K
This year, Ethereum and other crypto assets surged to new highs amid the approval of spot Bitcoin ETFs in the United States. Despite the previous price gains and institutional inflows, massive sell-offs recorded in recent times have deepened sentiments. Ethereum trades at $3,075, a 7% drop in the last 24 hours. Weekly losses pierced double digits at 11% while monthly figures topped 19% in the red zone.

These outflows have sparked similar numbers in other altcoins. ETH’s market cap tanked to $367 billion while daily trading volume is over $20 billion. This year came with projections of sustained growth above $4k but plummeting price now sees ETH moving near $3k. The drop in crypto assets might force prices lower although many holders believe a rebound might be on the cards.
Altcoins Are Sinking
Like most commentators opine, Ethereum price can surge with positive mainstream factors. The listing of ETH ETFs can lead to a jump in the asset’s price. The recent slump has also affected altcoin prices with Solana trading below $130 and $126 and Ripple plunging over 8% in the last 24 hours. Toncoin and Cardano were also down today with larger numbers posted by meme coins.
Also Read: End of The Road for Meme Coins? Dogecoin Takes Heavy Losses
The presented content may include the personal opinion of the author and is subject to market condition. Do your market research before investing in cryptocurrencies. The author or the publication does not hold any responsibility for your personal financial loss.
Source link

MATIC Price Crash: Reaching A Two Year Low

Multicoin Pledges up to $1M for Pro-Crypto Senate Candidates

Crypto heists near $1.4b in first half of 2024: TRM Labs

FTX Founder Sam Bankman-Fried’s Family Accused Of $100M Illicit Political Donation

Bitcoin Price Falls as Mt Gox Starts Repayments

20% Price Drop Follows $87 Million Spending Outrage

More than 10 years since the collapse of Mt. Gox, users confirm reimbursements

Leading Telecom Company Taiwan Mobile Gets Crypto Exchange License

Here Are Price Targets for Bitcoin, Solana, and Render, According to Analyst Jason Pizzino

Bitcoin price plunges below $55k as Mt. Gox announces repayments

Jasmy Sheds 20% Amid Bitcoin Sell-Off

Are they a good thing?

Mt. Gox Transfers $2.7 Billion in Bitcoin From Cold Storage Amid Market Rout

What’s Next For Ethereum (ETH) as Price Hovers $3,000?

Bitcoin’s quick dip below $57k forces beginners to capitulate, CryptoQuant says

Bitcoin Dropped Below 2017 All-Time-High but Could Sellers be Getting Exhausted? – Blockchain News, Opinion, TV and Jobs

What does the Coinbase Premium Gap Tell us about Investor Activity? – Blockchain News, Opinion, TV and Jobs
BNM DAO Token Airdrop

NFT Sector Keeps Developing – Number of Unique Ethereum NFT Traders Surged 276% in 2022 – Blockchain News, Opinion, TV and Jobs
A String of 200 ‘Sleeping Bitcoins’ From 2010 Worth $4.27 Million Moved on Friday
New Minting Services

Block News Media Live Stream

SEC’s Chairman Gensler Takes Aggressive Stance on Tokens – Blockchain News, Opinion, TV and Jobs

Friends or Enemies? – Blockchain News, Opinion, TV and Jobs

Enjoy frictionless crypto purchases with Apple Pay and Google Pay | by Jim | @blockchain | Jun, 2022

How Web3 can prevent Hollywood strikes

Block News Media Live Stream

Block News Media Live Stream
Block News Media Live Stream

XRP Explodes With 1,300% Surge In Trading Volume As crypto Exchanges Jump On Board
 Altcoins2 years ago
Bitcoin Dropped Below 2017 All-Time-High but Could Sellers be Getting Exhausted? – Blockchain News, Opinion, TV and Jobs
 Binance2 years ago
What does the Coinbase Premium Gap Tell us about Investor Activity? – Blockchain News, Opinion, TV and Jobs
- Uncategorized3 years ago
BNM DAO Token Airdrop
 BTC1 year ago
NFT Sector Keeps Developing – Number of Unique Ethereum NFT Traders Surged 276% in 2022 – Blockchain News, Opinion, TV and Jobs

 Bitcoin miners2 years ago
A String of 200 ‘Sleeping Bitcoins’ From 2010 Worth $4.27 Million Moved on Friday
- Uncategorized3 years ago
New Minting Services
 Video2 years ago
Block News Media Live Stream
 Bitcoin1 year ago
SEC’s Chairman Gensler Takes Aggressive Stance on Tokens – Blockchain News, Opinion, TV and Jobs

✓ Share: