
BTC
NFT Sector Keeps Developing - Number of Unique Ethereum NFT Traders Surged 276% in 2022 – Blockchain News, Opinion, TV and Jobs
By Paul Hoffman from BestBrokers
Looming Fed rate hikes were the hottest topic in the beginning of 2022. Shortly after that global markets dove even deeper into the red with the start of the war between Russia and Ukraine. Not long after the LUNA crash followed and crypto markets plunged deeply.
Unfavorable events for the global economy continued and caused further damage to all crypto assets. Despite all the negativity surrounding crypto and multiple published analyses, concluding with the announcement of “crypto winter”, the NFT sector kept developing at a good pace and our team at BestBrokers decided to pull some raw data out of the Blockchain with Dune Analytics and give a visual representation.
For the report Dune Analytics was used to run raw queries and analyse raw data from the blockchain. It also features breakdowns by year and quarter of the unique Ethereum NFT traders and the number of Ethereum NFT traders as well as expert opinion on the overall NFT trading activity.
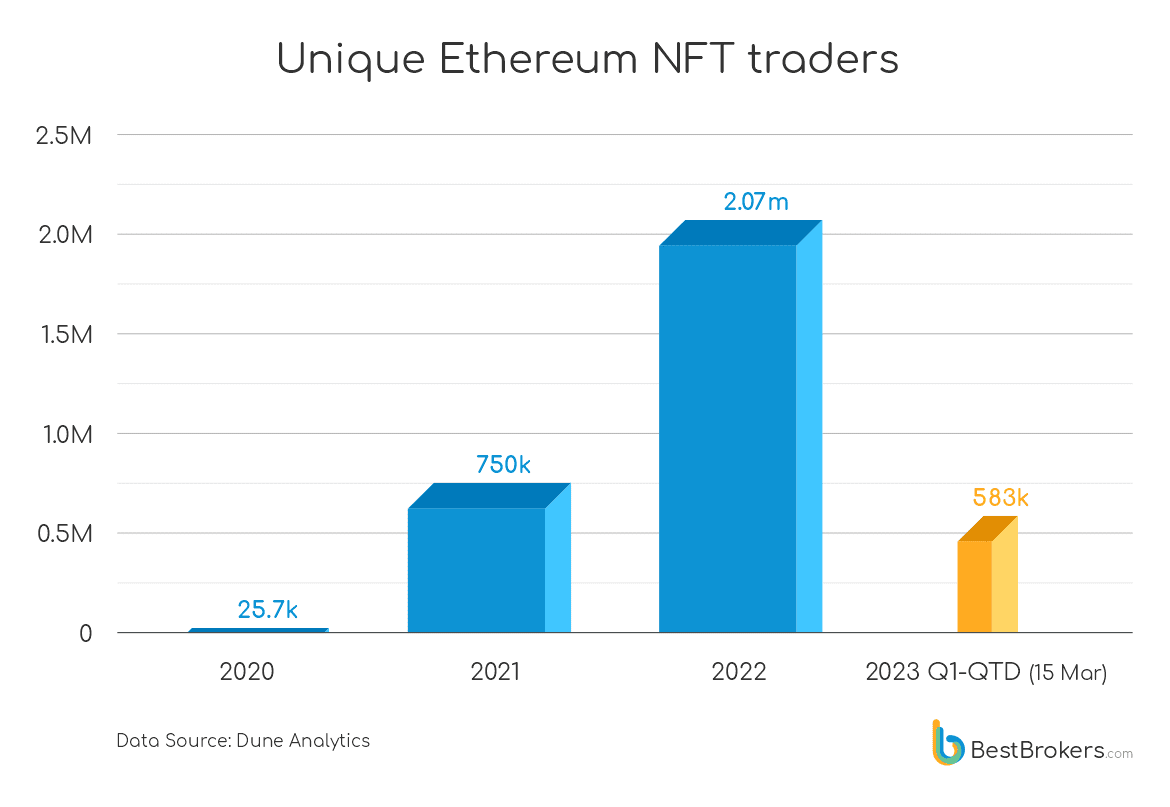
The number of the unique active NFT traders on the Ethereum blockchain rose to over 2.07 million in 2022. Despite the negative conditions in 2022, the number of active NFT traders on the Ethereum network surged 276% compared to 2021.
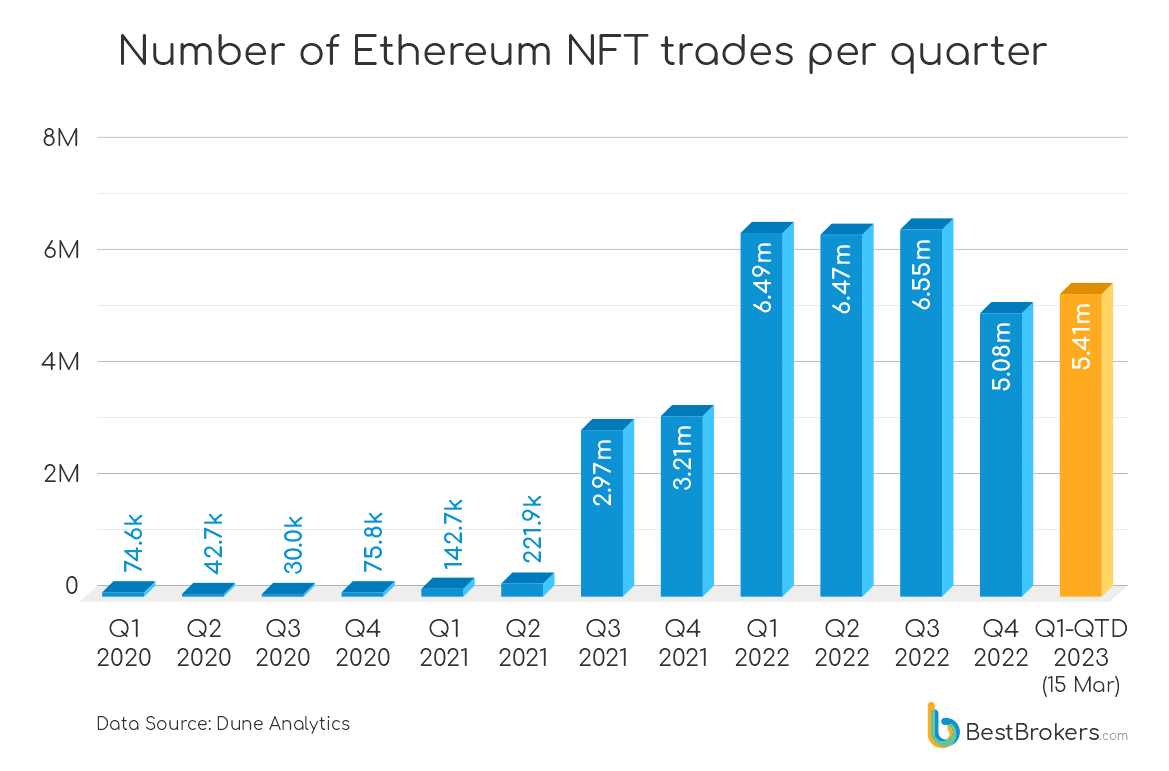
Initially the number of trades plummeted 22.48% in the fourth quarter of 2022 but bounced back nicely in the first quarter of 2023, which already makes this year look promising.
Despite the falling prices and the much lower trading volume for most of the cryptocurrencies, the number of the unique active NFT traders on the Ethereum blockchain rose to over 2.07 million in 2022 or 276% compared to 2021.
 |
“The fact that NFTs kept traders’ attention during such tough times for the whole investing world means that there is something special about this asset. With the crypto prices expected to only rise from this point on, NFT will become even more mainstream and eventually will bring a lot of younger investors to the markets”
Stable overall trading activity
Ethereum NFT trading activity initially skyrocketed to almost 3 million trades for the third quarter of 2021 with BTC and Ethereum reaching all time high. However, this trend remained stable despite the turbulent 2022, only dropping in the fourth quarter of 2022 when the Fed rate reached (and exceeded) the 4% mark for the first time in 15 years.
Even after the number of trades plummeted 22.48% in the fourth quarter of 2022, it still bounced back in the first quarter of 2023 with the number of trades in this current first quarter already 6.65% higher as of 15 March 2023.
 |
“Such stable activity, despite crypto and global markets having one of the most turbulent years in their history, only strengthens the expectations that NFTs will be one of the most popular trading instruments in the future. We have seen the power of retail investors in the so-called ‘meme stocks’ rallies in the past year, now we see it in the NFT trading.”
– comments Alang Goldberg, analyst at BestBrokers.
Source link


The application by BlackRock, the world’s largest asset manager, for approval of a Bitcoin spot ETF with the US Securities and Exchange Commission (SEC) is the biggest story in the crypto market today. Numerous experts are extremely optimistic that an approval of the first Bitcoin spot ETF in the US will be a massively bullish event, attracting huge amounts of new capital and triggering a new bull run.
But where does this theory come from? Bitcoin is often referred to as the digital gold of the 21st century, so it’s an obvious choice to look at the history of gold and the first gold based spot ETF.
Why The BlackRock Bitcoin ETF Would Be So Bullish
The first thing to note is that BlackRock applied for a spot ETF and not a Futures ETF. The SEC has already approved a number of Bitcoin Futures ETFs that hold Bitcoin futures contracts on the CME. These are currently traded on the US equity markets, but have relatively low popularity. And this has its reasons, first and foremost the so-called “drag”, as Scimitar Capital explains.
Drag refers to the underperformance of a fund that attempts to replicate the return of a particular underlying asset and is a long-term result of regular portfolio rebalancing. To track the spot price, BITO, the largest bitcoin futures ETF, holds 2/3 in the front-month future and 1/3 in the following month.
However, this “rolling” is costly because of transaction fees, slippage and because futures for the last month are usually traded at a premium over the first month in BTC (“contango”). For this reason, futures ETFs are not a good investment for retail traders in the long run and are therefore unpopular.
A Bitcoin spot ETF does not have these disadvantages. “This is the reason why physically backed ETFs like GLD and IAU for gold have a combined 90B of AUM whereas futures backed ones like BITO and USO have a paltry 1.6B,” Scimitar Capital says.
The first gold ETF, the SPDR Gold Trust ETF (GLD), was listed on the NYSE on November 15, 2004 and revolutionized gold trading. Before GLD came on the market, it was possible to invest in gold in the form of bars, coins, certificates and shares of gold mining companies.
The exchange-traded fund made investing in precious metals a no-brainer and eliminated the problems of shipping and vaults. The same revolution could be coming to Bitcoin by a Bitcoin spot ETF. Retail investors could hold Bitcoin long-term through the ETF without worrying about custody and private keys.
And the revolution in gold also made itself felt in the price. While the price of gold was still below $450 per ounce in November 2004, gold saw a meteoric rise in the years that followed.
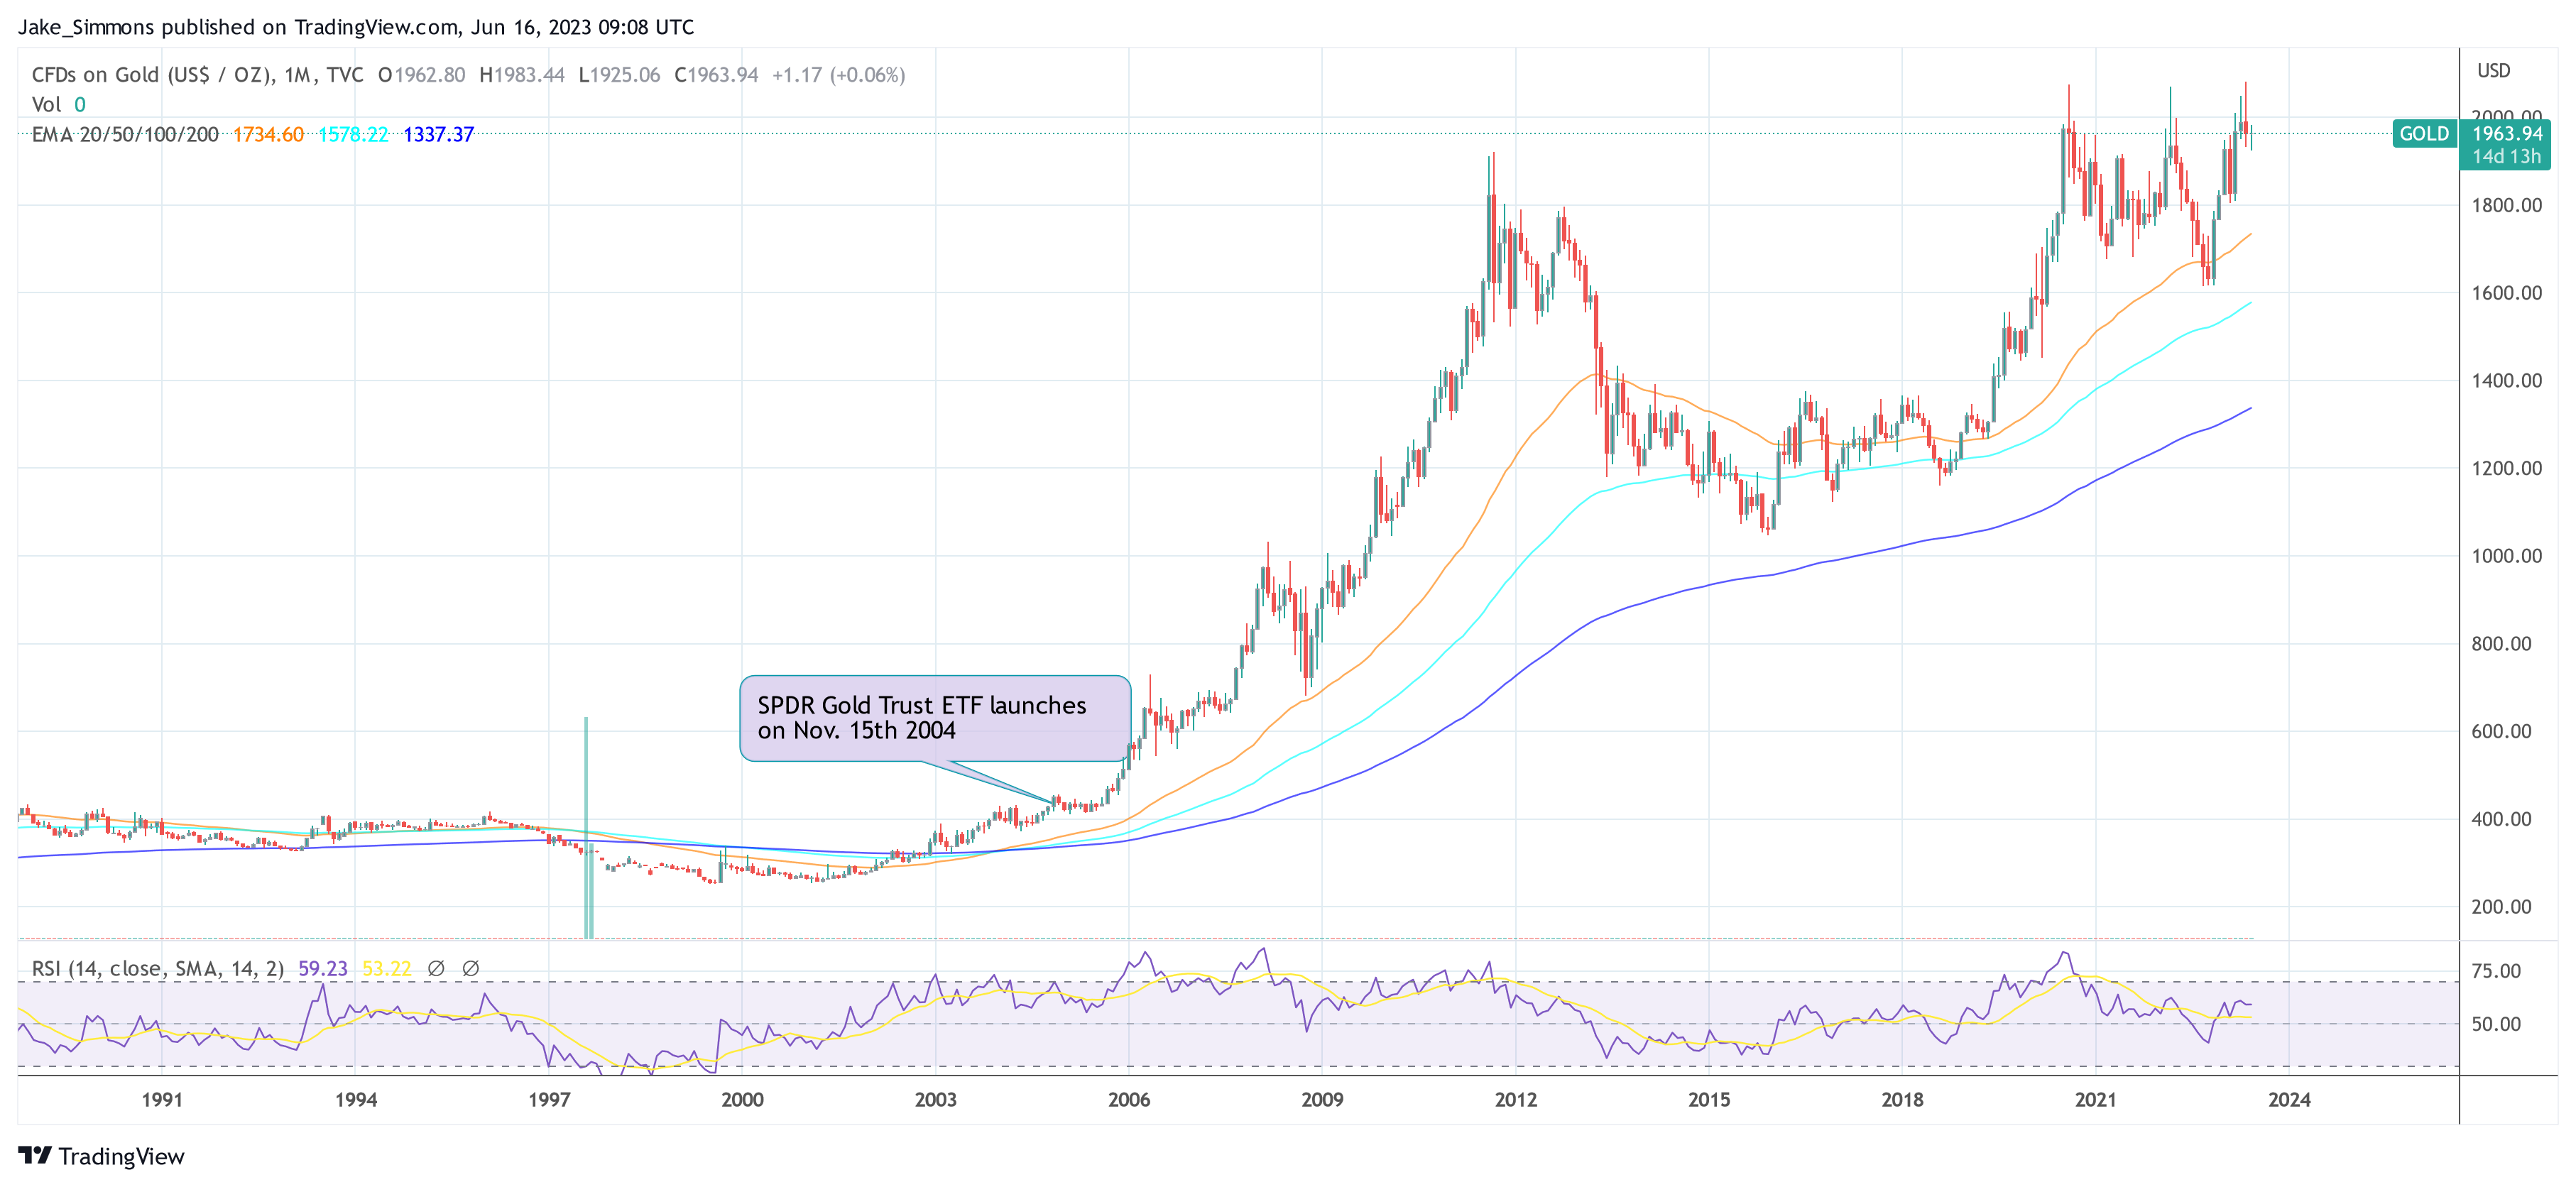
In September 2011, less than seven years after the launch, gold was trading at $1920 per ounce. Many economic factors have influenced the price of gold, but the launch of ETFs certainly played an influential role in attracting global institutional funds to the market.
The digital gold of the 21st century, Bitcoin, may yet see this price explosion if history repeats itself.
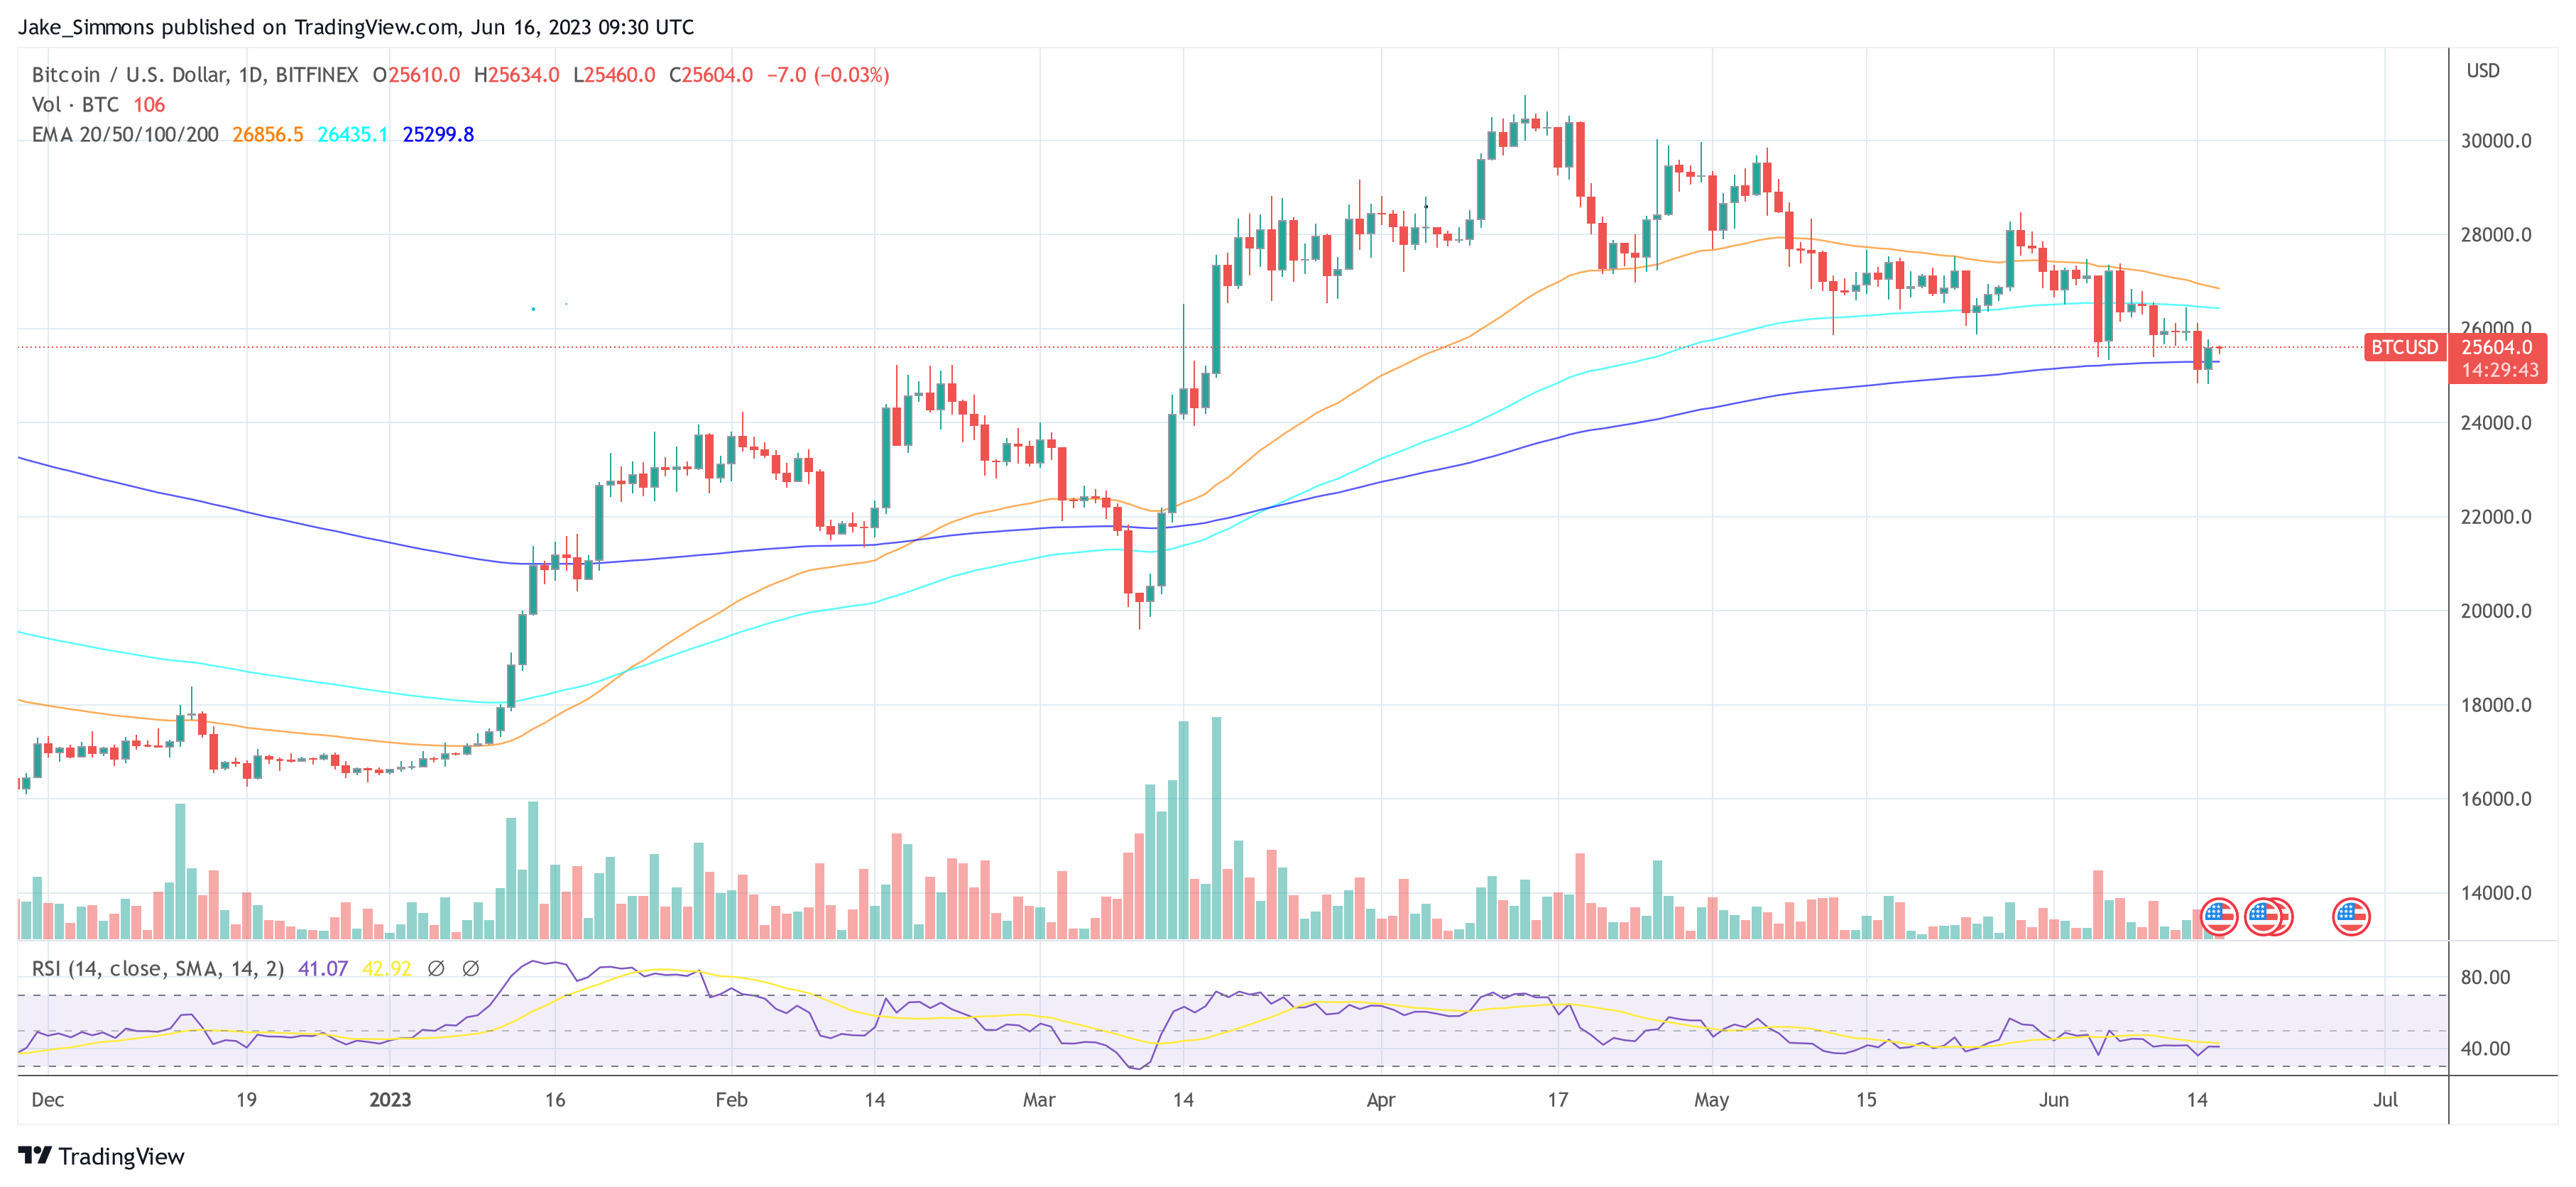
At press time, BTC traded at $25,604, reclaiming the 200-day EMA (blue line).
Featured image from iStock, chart from TradingView.com
Source link
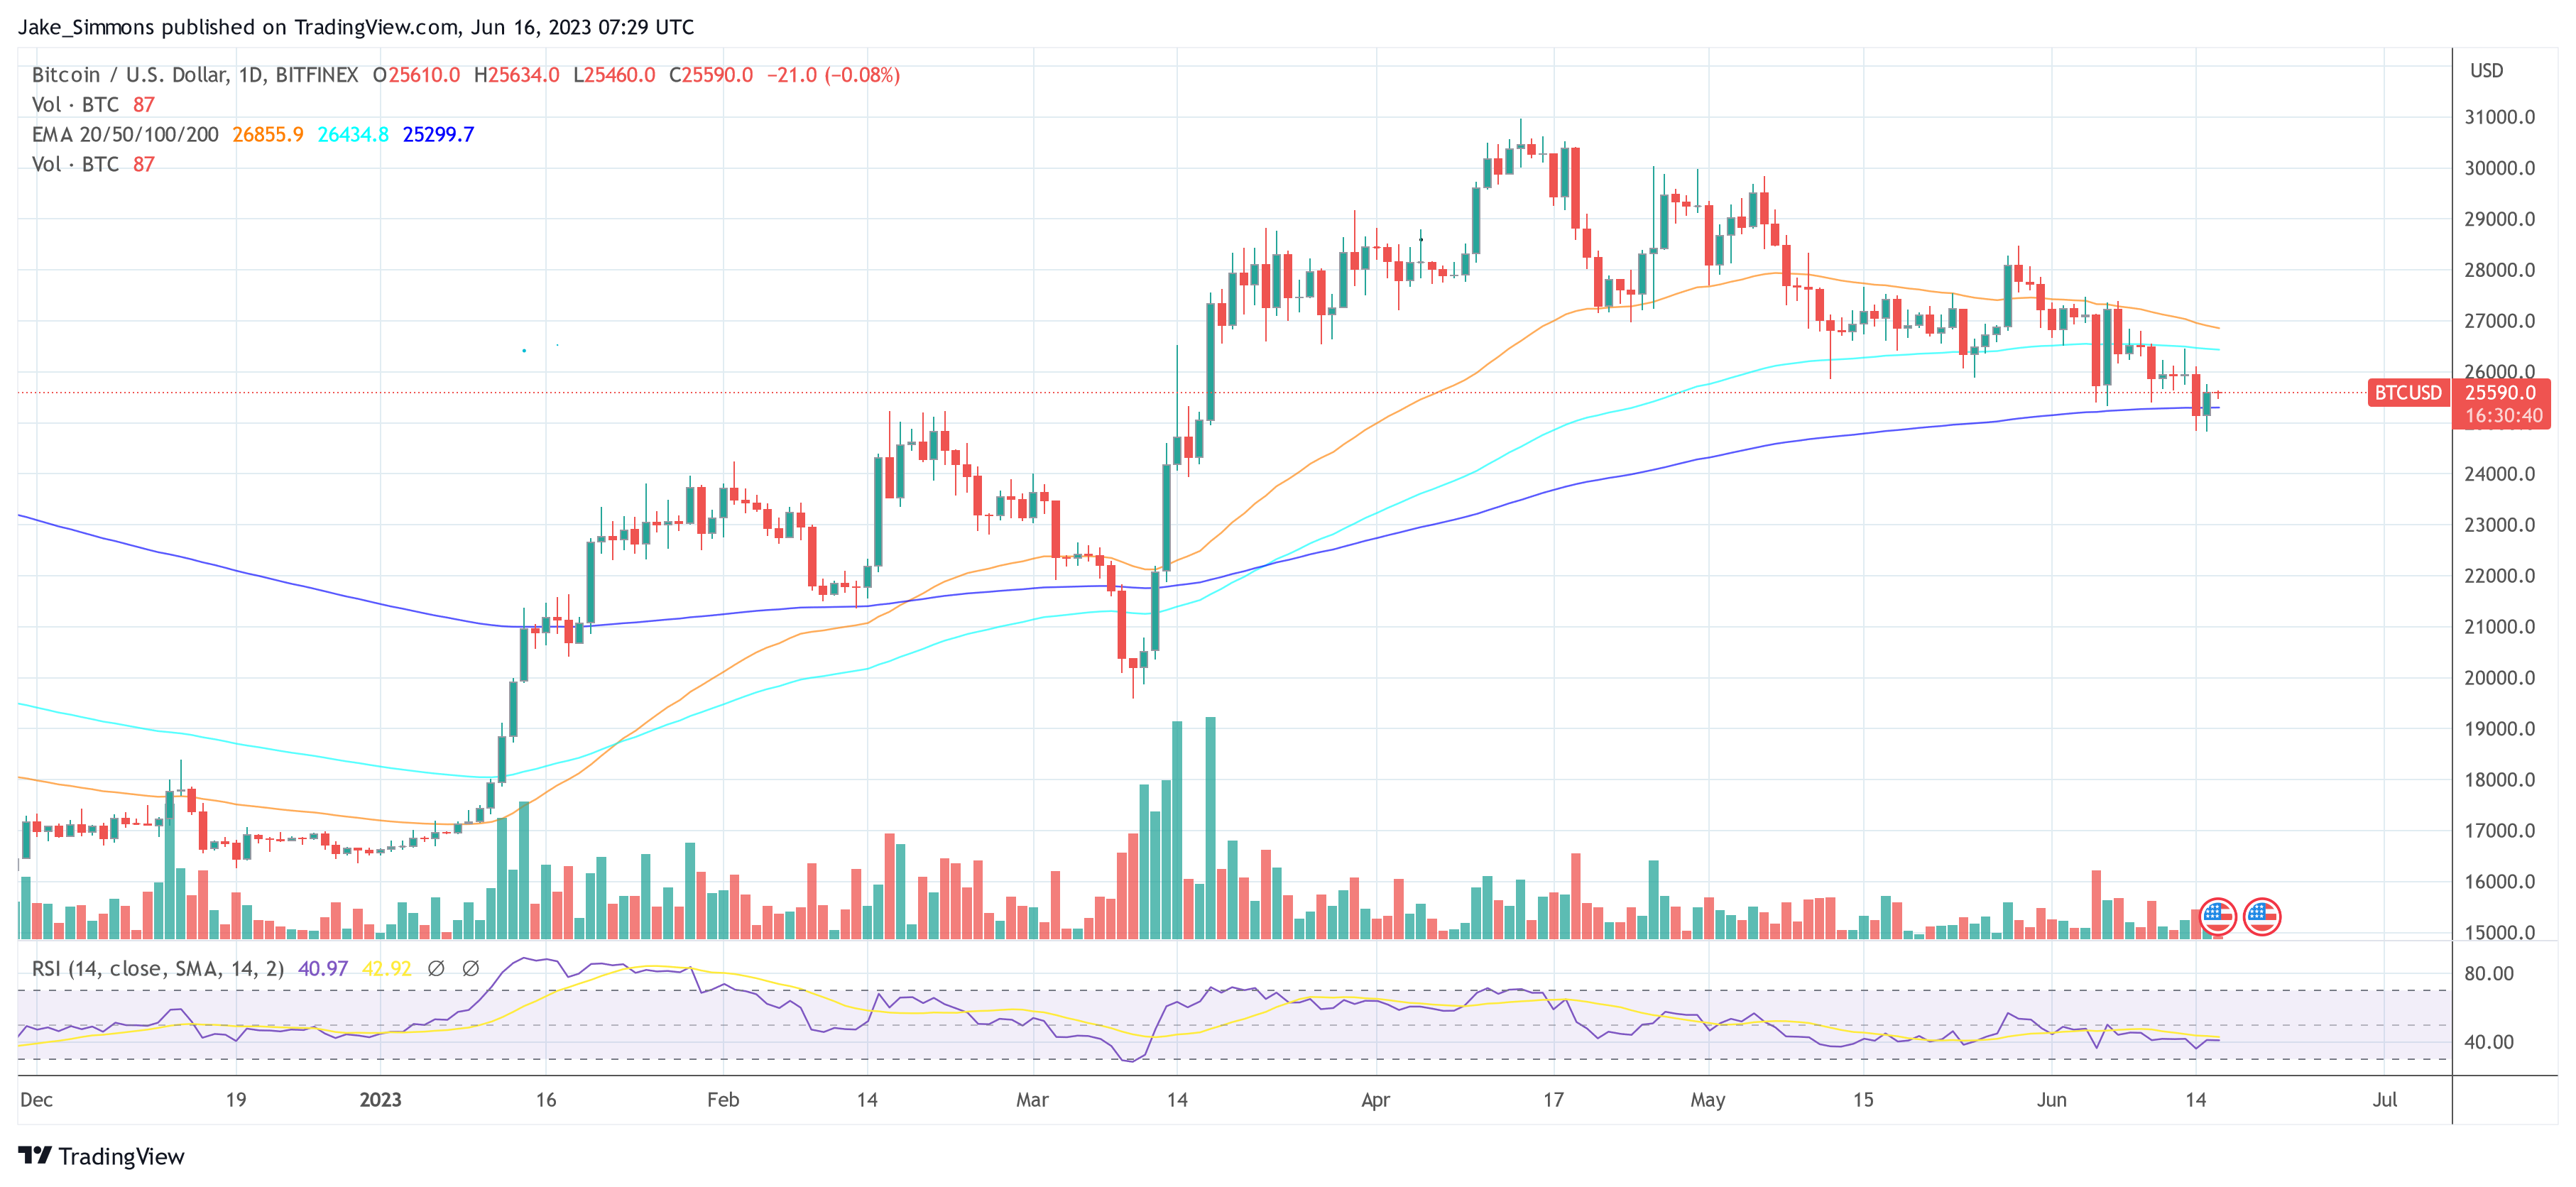
The Bitcoin price has risen 3.2% since yesterday’s low of $24,827. At press time, BTC was trading at $25,590 and has thus reclaimed two extremely important price levels for the moment: first, the Bitcoin price has once again risen above the 200-day Exponential Moving Average (EMA) currently at $25,299, and second, the price is now also back above the 200-week EMA at $25,304 (with the weekly close becoming of crucial importance).
As always, there are several narratives for yesterday’s rise in price. The most obvious narrative and currently the biggest topic in the market is the Bitcoin spot ETF filing by BlackRock, the world’s largest asset manager, with the US Securities and Exchange Commission (SEC). A spot ETF is seen as the holy grail that could finally open the floodgates for institutional liquidity, as Bitcoinist reported today.
Reasons For The Bitcoin Rally
BlackRock is believed to have a strong chance of getting the first spot-based Bitcoin ETF approved by the SEC due to its political influence and network. The new capital inflows made possible may have the potential to be the next bull run catalyst, according to many experts.
“BlackRock getting a BTC ETF through would be the best thing that could happen to BTC,” Galaxy Digital CEO Mike Novogratz said yesterday. Accordingly, the news is likely to have created a bullish sentiment in the market.
However, as always, several reasons play a role in the price movement on the Bitcoin market. One issue that should not be neglected is always the macro situation and the US dollar index (DXY). The latter has seen a setback in the last three days, falling from 104.70 to currently 102.21. This is likely to have favored BTC for now.
As for the macro situation, Wednesday’s interest rate decision by the US Federal Reserve (Fed) certainly still plays a role. The main story is that the market is not buying Fed Chair Jerome Powell’s hawkish stance. Analysts believe that the two more rate hikes announced in the dot plot are a feint to prevent a bullish breakout in the financial markets.
Finally, BTC’s decoupling from the S&P 500 has also been seen in recent days. Yesterday’s move could have been the start of a catch-up rally in which BTC shakes off the unnecessary losses caused by the Tether FUD and the SEC lawsuits against Coinbase and Binance US.
In addition, Bitcoin hodlers continue to show historically high conviction. As on-chain analyst Axel Adler Jr explained via Twitter, the total BTC inflow across all exchanges is currently at a low, suggesting that Bitcoin holders are in no hurry to sell their coins.
The total BTC inflow across all exchanges is currently at a low, indicating that Bitcoin owners are not in a rush to sell their coins. #Bitcoin #HODL pic.twitter.com/JTscheVcgO
— Axel 💎🙌 Adler Jr (@AxelAdlerJr) June 16, 2023
As NewsBTC reported, yesterday’s Tether FUD may also have once again marked the bottom for Bitcoin. Within the last bear market, there have already been three de-pegging events of stablecoins, all of them were marking the local bottom.
At press time, BTC changed hands for $25,590.
Featured image from iStock, chart from TradingView.com
Source link

Bitcoin price is attempting a recovery wave above the $25,200 resistance. BTC must clear the 100 hourly SMA to continue higher in the near term.
- Bitcoin is slowly recovering higher above the $25,200 support.
- The price is trading below $25,750 and the 100 hourly Simple moving average.
- There is a key bearish trend line forming with resistance near $25,680 on the hourly chart of the BTC/USD pair (data feed from Kraken).
- The pair could rise further if it clears $25,750 and the 100 hourly Simple moving average.
Bitcoin Price Attempts Recovery
Bitcoin price remained in a bearish zone below the $26,200 resistance zone. BTC extended its decline below the $25,500 support and even spiked below $25,000.
A low is formed near $24,751 and the price is now attempting a recovery wave. There was a clear move above the $25,000 and $25,200 resistance levels. The price climbed above the 50% Fib retracement level of the downward move from the $26,062 swing high to the $24,751 low.
Bitcoin price is now trading below $25,750 and the 100 hourly Simple moving average. Besides, there is a key bearish trend line forming with resistance near $25,680 on the hourly chart of the BTC/USD pair.
The pair is now facing resistance near the trend line and the 100 hourly Simple moving average. It is close to the 61.8% Fib retracement level of the downward move from the $26,062 swing high to the $24,751 low. The next major resistance is near the $25,750 level.
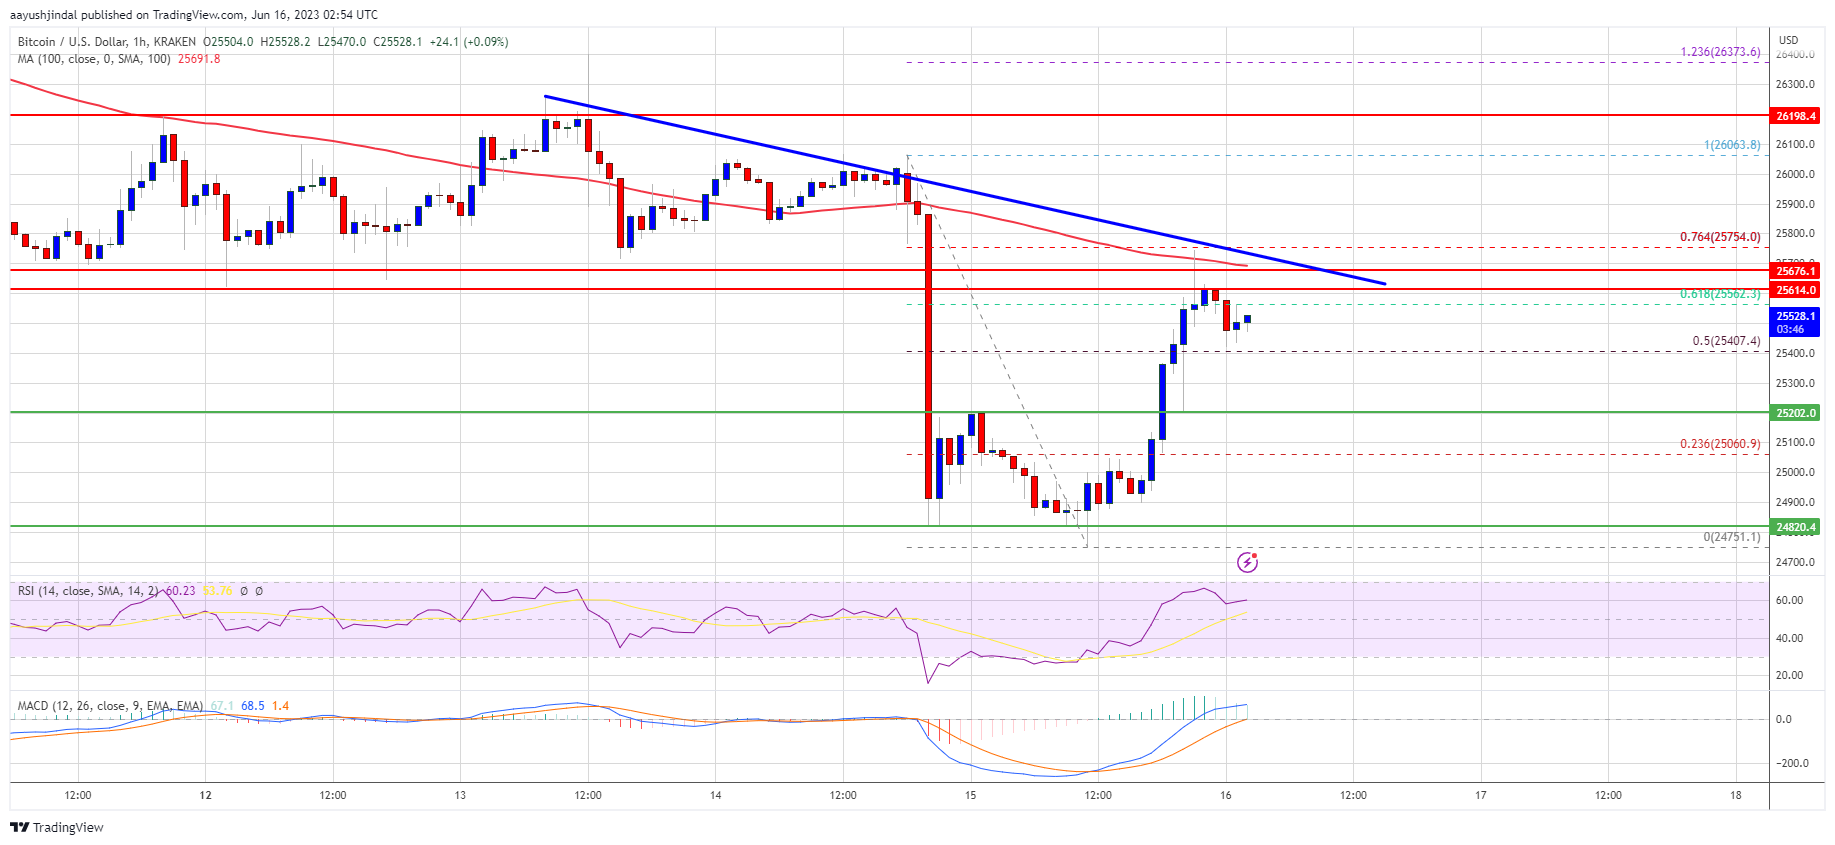
Source: BTCUSD on TradingView.com
A clear move above the $25,750 resistance might start a fresh increase. The next major resistance is near the $26,200 level, above which the bulls might send BTC toward the $26,500 resistance zone.
Fresh Decline in BTC?
If Bitcoin’s price fails to clear the $25,750 resistance, it could start another decline. Immediate support on the downside is near the $25,200 level.
The next major support is near the $24,820 level, below which the price might start another major decline. In the stated case, the price could drop toward the $24,000 support in the near term.
Technical indicators:
Hourly MACD – The MACD is now losing pace in the bearish zone.
Hourly RSI (Relative Strength Index) – The RSI for BTC/USD is above the 50 level.
Major Support Levels – $25,200, followed by $24,820.
Major Resistance Levels – $25,680, $25,750, and $26,200.
Source link

Ethereum network upgrade and uptick in Arbitrum active users could trigger an ARB price reversal

XRP Allegedly Attacked By SEC’s Hinman For Ethereum’s Benefit

On-chain sleuth ZachXBT sued for libel after claiming plaintiff drained funds from project

Percentage Of ETH Addresses In Profit Reaches 5-Month Low

Think AI tools aren’t harvesting your data? Guess again

Bitcoin Bullish Momentum Building: Expert Predicts Rise To $27,200

Which altcoins will survive the SEC crackdown? Bitcoin OG explains

Curve (CRV) Observes 7% Bounce As Short Squeeze Occurs

Bakkt follows Robinhood, eToro in delisting major altcoins: Report

Shiba Inu Lead Developer Unveils Shibacals, Advancing Shibarium Development

dApp Store kit adopts new tech stack to power Web3 gaming development

Polygon Sees Surge In Whale Buying: Recovery In The Cards?

7 alternatives to ChatGPT

What Happens To Bitcoin Price If Spot ETF Is Approved?

SEC argues against Dentons’ motion to dismiss Terraform and Do Kwon’s lawsuit

Judge rules LBRY video platform’s token is a security in case brought by the US SEC

Will the Bitcoin mining industry collapse? Analysts explain why crisis is really opportunity

Silvergate Capital’s crypto-to-fiat transfers decrease by $50B compared to Q3 2021

Exchange Outflows Shows Bitcoin, Ethereum Accumulation Trend Continues

Bitcoin Dropped Below 2017 All-Time-High but Could Sellers be Getting Exhausted? – Blockchain News, Opinion, TV and Jobs
BNM DAO Token Airdrop

What does the Coinbase Premium Gap Tell us about Investor Activity? – Blockchain News, Opinion, TV and Jobs
Fed policy and crumbling market sentiment could send the total crypto market cap back under $1T
New Minting Services

Can Cardano’s July hard fork prevent ADA price from plunging 60%?

Friends or Enemies? – Blockchain News, Opinion, TV and Jobs

SEC’s Chairman Gensler Takes Aggressive Stance on Tokens – Blockchain News, Opinion, TV and Jobs

LUNA2 Recovers 70% In Nine Days From Historic Lows

Enjoy frictionless crypto purchases with Apple Pay and Google Pay | by Jim | @blockchain | Jun, 2022
A String of 200 ‘Sleeping Bitcoins’ From 2010 Worth $4.27 Million Moved on Friday
-
 SEC7 months ago
Judge rules LBRY video platform’s token is a security in case brought by the US SEC
-
 Antminer11 months ago
Will the Bitcoin mining industry collapse? Analysts explain why crisis is really opportunity
-
 Banking8 months ago
Silvergate Capital’s crypto-to-fiat transfers decrease by $50B compared to Q3 2021
-
 Bitcoin8 months ago
Exchange Outflows Shows Bitcoin, Ethereum Accumulation Trend Continues
-
 Altcoins12 months ago
Bitcoin Dropped Below 2017 All-Time-High but Could Sellers be Getting Exhausted? – Blockchain News, Opinion, TV and Jobs
-
Uncategorized1 year ago
BNM DAO Token Airdrop
-
 Binance11 months ago
What does the Coinbase Premium Gap Tell us about Investor Activity? – Blockchain News, Opinion, TV and Jobs
-
 Asia11 months ago
Fed policy and crumbling market sentiment could send the total crypto market cap back under $1T