
Bitcoin
Here’s Where The Nearest On-Chain Support Is

Bitcoin has observed a plunge during the past day. Here’s the nearest on-chain level that the asset would end up retesting if the drawdown elongates.
1 Week To 1 Month Bitcoin Holders Have Their Realized Price At $97,900
As pointed out by CryptoQuant author Axel Adler Jr in a new post on X, the Realized Price of the 1-week to 1-month-old BTC investors is the closest support for the asset right now.
Related Reading
The “Realized Price” here refers to an on-chain indicator that, in short, keeps track of the cost basis or acquisition price of the average holder on the Bitcoin network.
When the metric’s value is lower than the spot price of the cryptocurrency, it means the investors as a whole can be considered to be holding a net amount of profit. On the other hand, it being under the BTC value suggests the dominance of loss in the market.
In the context of the current topic, the Realized Price of only a particular segment of the sector is of interest: the 1-week to 1-month-old holders. This cohort includes the addresses that have been holding their coins for at least one week and, at most, one month.
Now, here is the chart shared by the analyst that shows how the Realized Price of this Bitcoin group has changed over the past year:
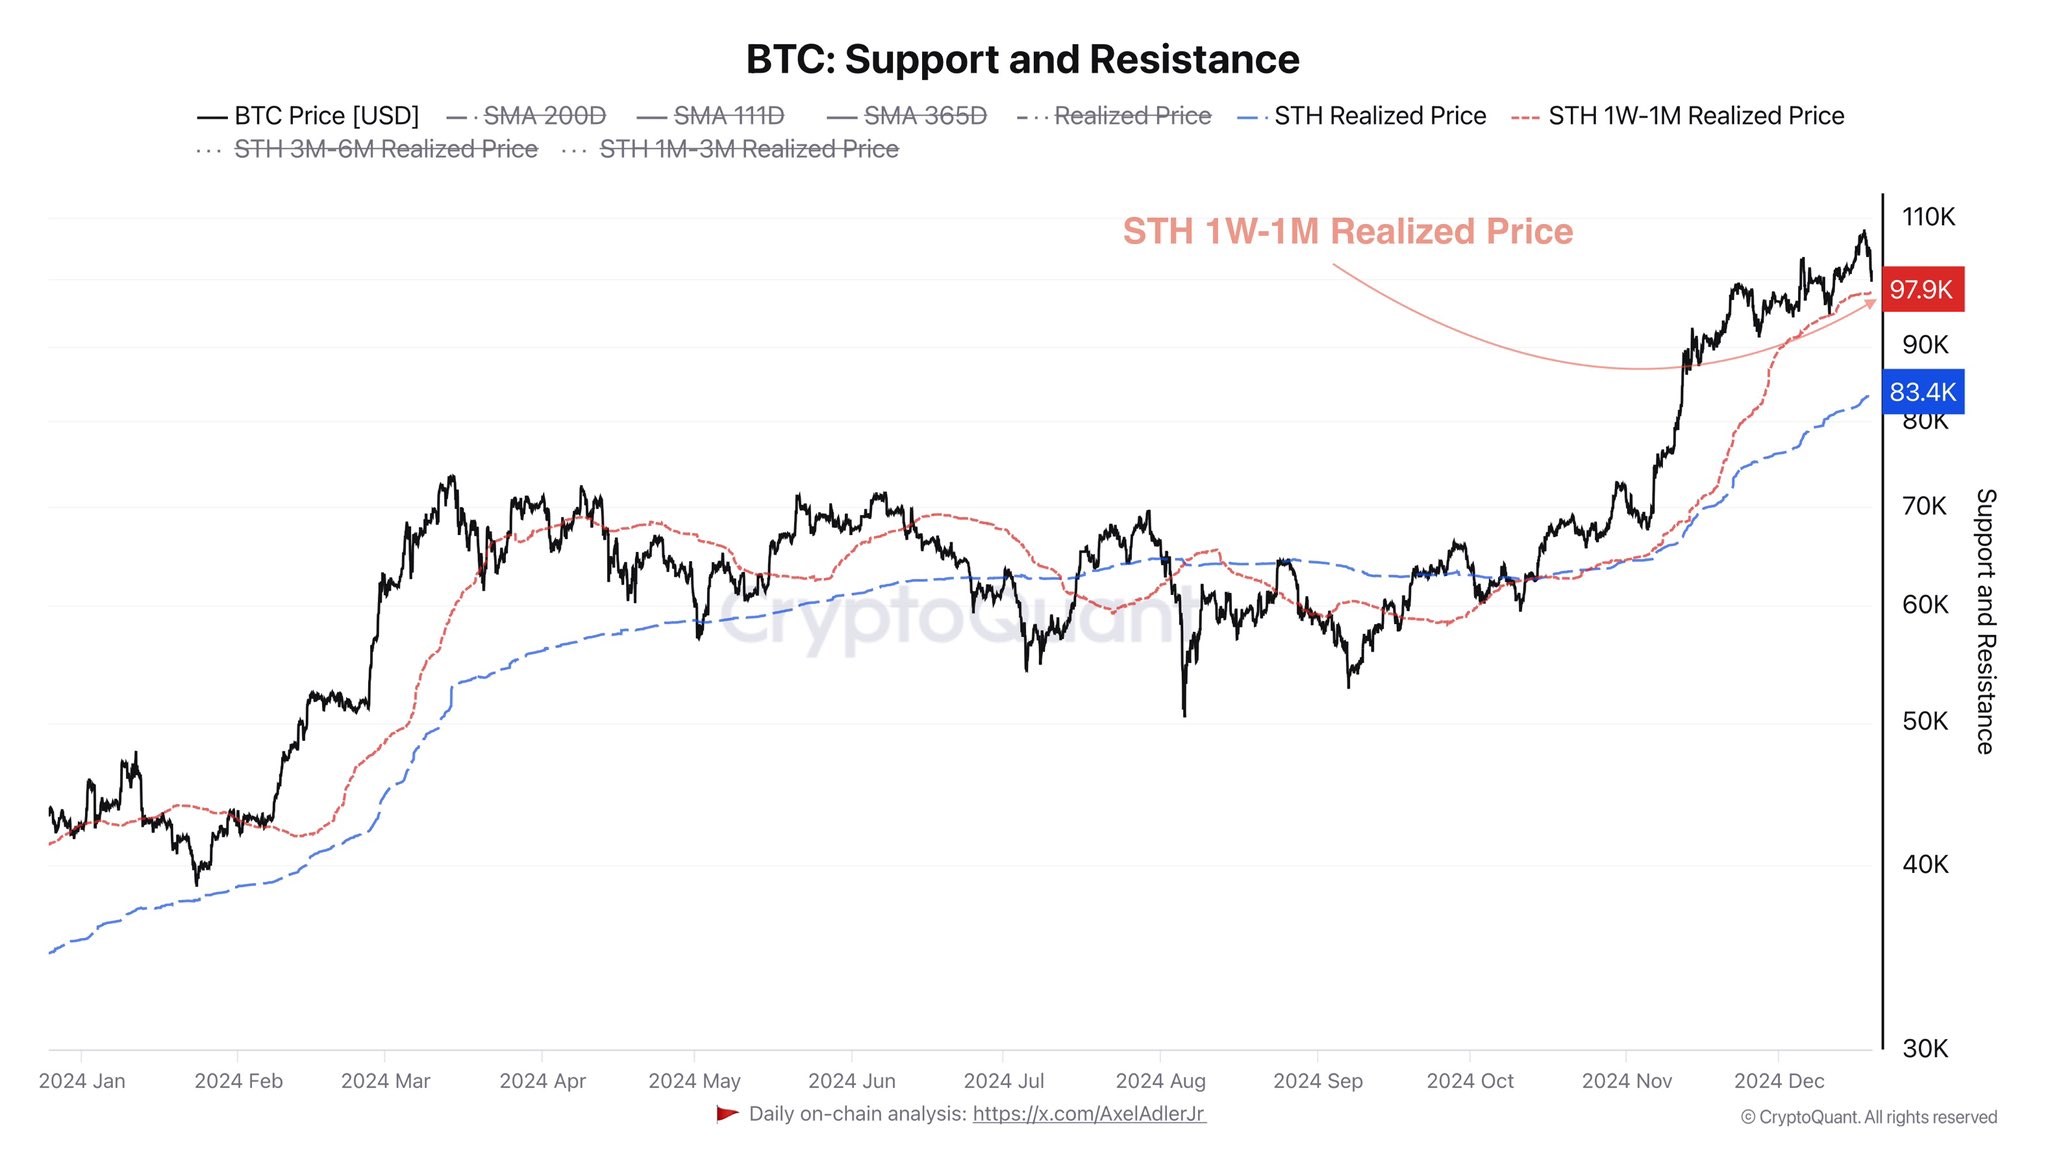
As displayed in the above graph, the Realized Price of the 1-week to 1-month-old Bitcoin investors has been climbing up alongside the price rally. This is naturally due to the fact that the cohort’s cost basis has been getting repriced to higher levels as new investors have been purchasing at the rally highs.
Currently, the indicator’s value sits at $97,900, so these investors would be in profit at the current price. Earlier in the past day, however, the asset came dangerously close to retesting the level as its price saw a brief dip below $99,000.
The 1 week to 1 month old investors make up a section of a larger cohort known as the short-term holders (STHs). The STHs are broadly defined as the holders who bought their coins within the past 155 days.
Statistically, the longer an investor holds onto their coins, the less likely they become to sell. So, the STHs, and especially the 1-week to 1-month-old segment, would contain the holders with the least amount of resolve in the sector, owing to their low holding time.
Because of how fickle they are, the STHs generally show some kind of reaction whenever their average cost basis gets retested by the Bitcoin price. This reaction may come in the form of buying when the retest occurs from above, as these holders could believe the decline to be just a ‘dip.’
As such, the Realized Price of the 1-week to 1-month-old STHs, which is below the current price, could be looked at as a support level for the cryptocurrency. The level has also already helped the asset out once this month.
Related Reading
So far, Bitcoin has been making a recovery from the plummet, but should the bearish momentum return, the retest of the line may be to watch for, considering the past pattern.
BTC Price
At the time of writing, Bitcoin is trading at around $102,200, down almost 3% in the last 24 hours.
Featured image from Dall-E, CryptoQuant.com, chart from TradingView.com
Source link


Recently very shaky risk assets — crypto among them — are attempting a rally on Tuesday, perhaps. buoyed by chatter that Donald Trump’s tariffs won’t be as stringent as feared.
In early afternoon U.S. action, bitcoin (BTC) had climbed to just above $85,000, ahead 2.1% over the past 24 hours. Previously really roughed up crypto majors like ether (ETH), dogecoin (DOGE) and cardano (ADA) had put in gains of roughly twice that amount.
Crypto stocks are also performing well, with bitcoin miners Core Scientific (CORZ) and CleanSpark (CLSK) jumping almost 10% on the day. Strategy (MSTR) is up 5.4% and Coinbase (COIN) 2.1%.
U.S. stocks reversed early session losses to turn higher as well, with the Nasdaq now ahead just shy of 1% for the day.
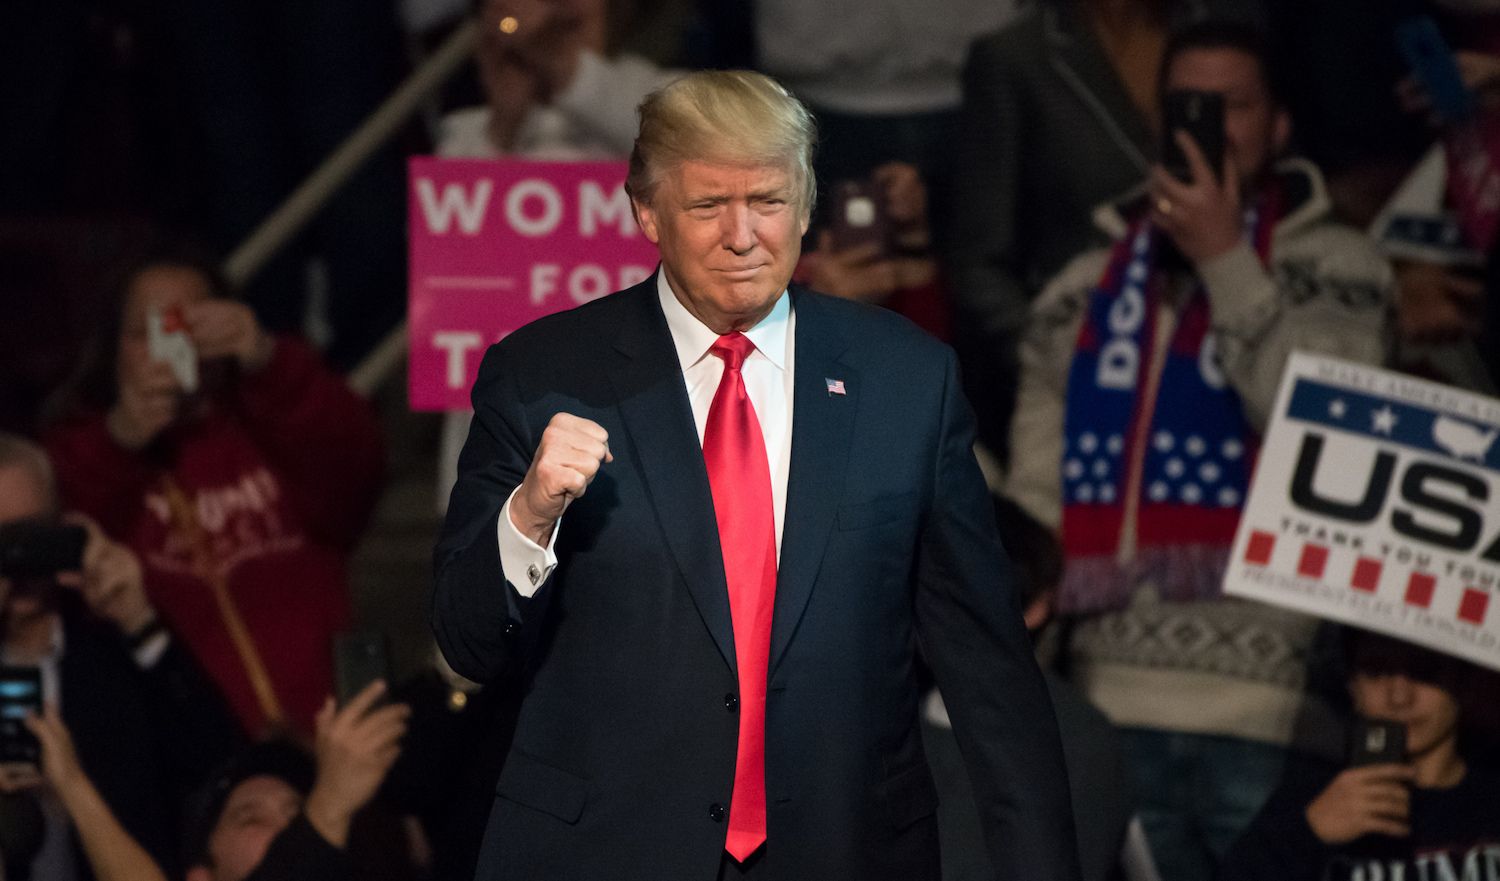
The action comes ahead of the Trump administration’s so-called “Liberation Day” tariff rollout set for tomorrow after the close of U.S. trading.
Hope?
A report from NBC News suggested the market’s most feared option — blanket 20% tariffs across the board — is “less likely” to be the direction taken by the White House. Instead, according to the report, a “tiered system” of different rates or country-by-country rates could be announced.
Also maybe helping is what appears to be the first acknowledgement that the administration is aware of the market tumult resulting from all the tariff chatter. Speaking today at her daily briefing, White House Press Secretary Karoline Leavitt said that there were legitimate concerns about market swings.
Meanwhile, Israel’s Minister of Finance Bezalel Smotrich announced on Tuesday that a process had been launched to get rid of tariffs on U.S. imports in that country.
Source link
Reason to trust
![]()
Strict editorial policy that focuses on accuracy, relevance, and impartiality
Created by industry experts and meticulously reviewed
The highest standards in reporting and publishing
Strict editorial policy that focuses on accuracy, relevance, and impartiality
Morbi pretium leo et nisl aliquam mollis. Quisque arcu lorem, ultricies quis pellentesque nec, ullamcorper eu odio.
Technical expert Tony Severino has warned that the Bitcoin and altcoins Fischer Transform indicator has flipped bearish for the first time since 2021. The analyst also revealed the implications of this development and how exactly it could impact these crypto assets.
Bitcoin And Altcoins Fischer Transform Indicator Turns Bearish
In an X post, Severino revealed that the total crypto market cap 12-week Fisher Transform has flipped bearish for the first time since December 2021. Before then, the indicator had flipped bearish in January 2018. In 2021 and 2018, the total crypto market cap dropped 66% and 82%, respectively. This provides a bearish outlook for Bitcoin and altcoins, suggesting they could suffer a massive crash soon enough.
Related Reading
In another X post, the technical expert revealed that Bitcoin’s 12-week Fischer Transform has also flipped bearish. Severino noted that this indicator converts prices into a Gaussian normal distribution to smooth out price data and filter out noise. In the process, it helps generate clear signals that help pinpoint major market turning points.
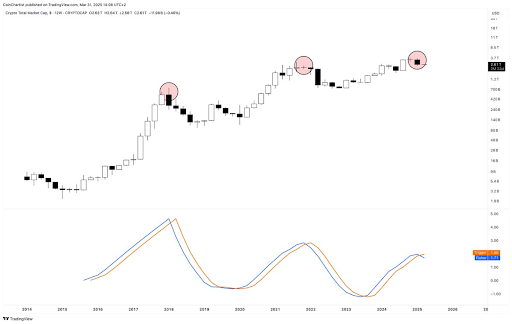
Severino asserted that this indicator on the 12-week timeframe has never missed a top or bottom call, indicating that Bitcoin and altcoins may have indeed topped out. The expert has been warning for a while now that the Bitcoin top might be in and that a massive crash could be on the horizon for the flagship crypto.
He recently alluded to the Elliott Wave Theory and market cycles to explain why he is no longer bullish on Bitcoin and altcoins. He also highlighted other indicators, such as the Parabolic SAR (Stop and Reverse) and Average Directional Index (ADX), to show that BTC’s bullish momentum is fading. The expert also warned that a sell signal could send BTC into a Supertrend DownTrend, with the flagship crypto dropping to as low as $22,000.
A Different Perspective For BTC
Crypto analyst Kevin Capital has provided a different perspective on Bitcoin’s price action. While noting that BTC is in a correctional phase, he affirmed that it will soon be over. Kevin Capital claimed that the question is not whether this phase will end. Instead, it is about how strong Bitcoin’s bounce will be and whether the flagship crypto will make new highs or record a lackluster lower high followed by a bear market.
Related Reading
The analyst added that Bitcoin’s price action when that time comes will also be trackable using other methods, such as money flow, macro fundamentals, and overall spot volume. The major focus is on the macro fundamentals as market participants look forward to Donald Trump’s much-anticipated reciprocal tariffs, which will be announced tomorrow.
At the time of writing, the Bitcoin price is trading at around $83,000, up around 1% in the last 24 hours, according to data from CoinMarketCap.
Featured image from Unsplash, chart from Tradingview.com
Source link
Altcoins
279% Rally in 2025 for One Under-the-Radar Altcoin ‘Very Likely,’ According to Crypto Analyst

A closely followed crypto strategist believes that the native asset of a layer-2 scaling solution could witness an over 3x rally this year.
Pseudonymous analyst Inmortal tells his 231,000 followers on the social media platform X that he’s bullish on Mantle (MNT), noting that he believes the altcoin has already printed a 2025 bottom at around $0.6.
According to the trader, a 279% rally for MNT this year is a high-probability scenario.
“Starting to feel like bottom is in.
Big players have been buying over the last few weeks, and it shows.
$3 in 2025 is very likely, high-conviction play for me.”

Based on the trader’s chart, he seems to predict that MNT will surge to $1.30 in the coming months.
At time of writing, MNT is worth $0.79.
Turning to Bitcoin, the trader unveils a potential path for BTC to print a durable bottom this year. According to Inmortal, BTC could temporarily drop below $70,000 before igniting the next stage of the bull market en route to a new all-time high of $135,000.
“They will try to shake you out, but this is the bottom.
Save the tweet.
BTC.”
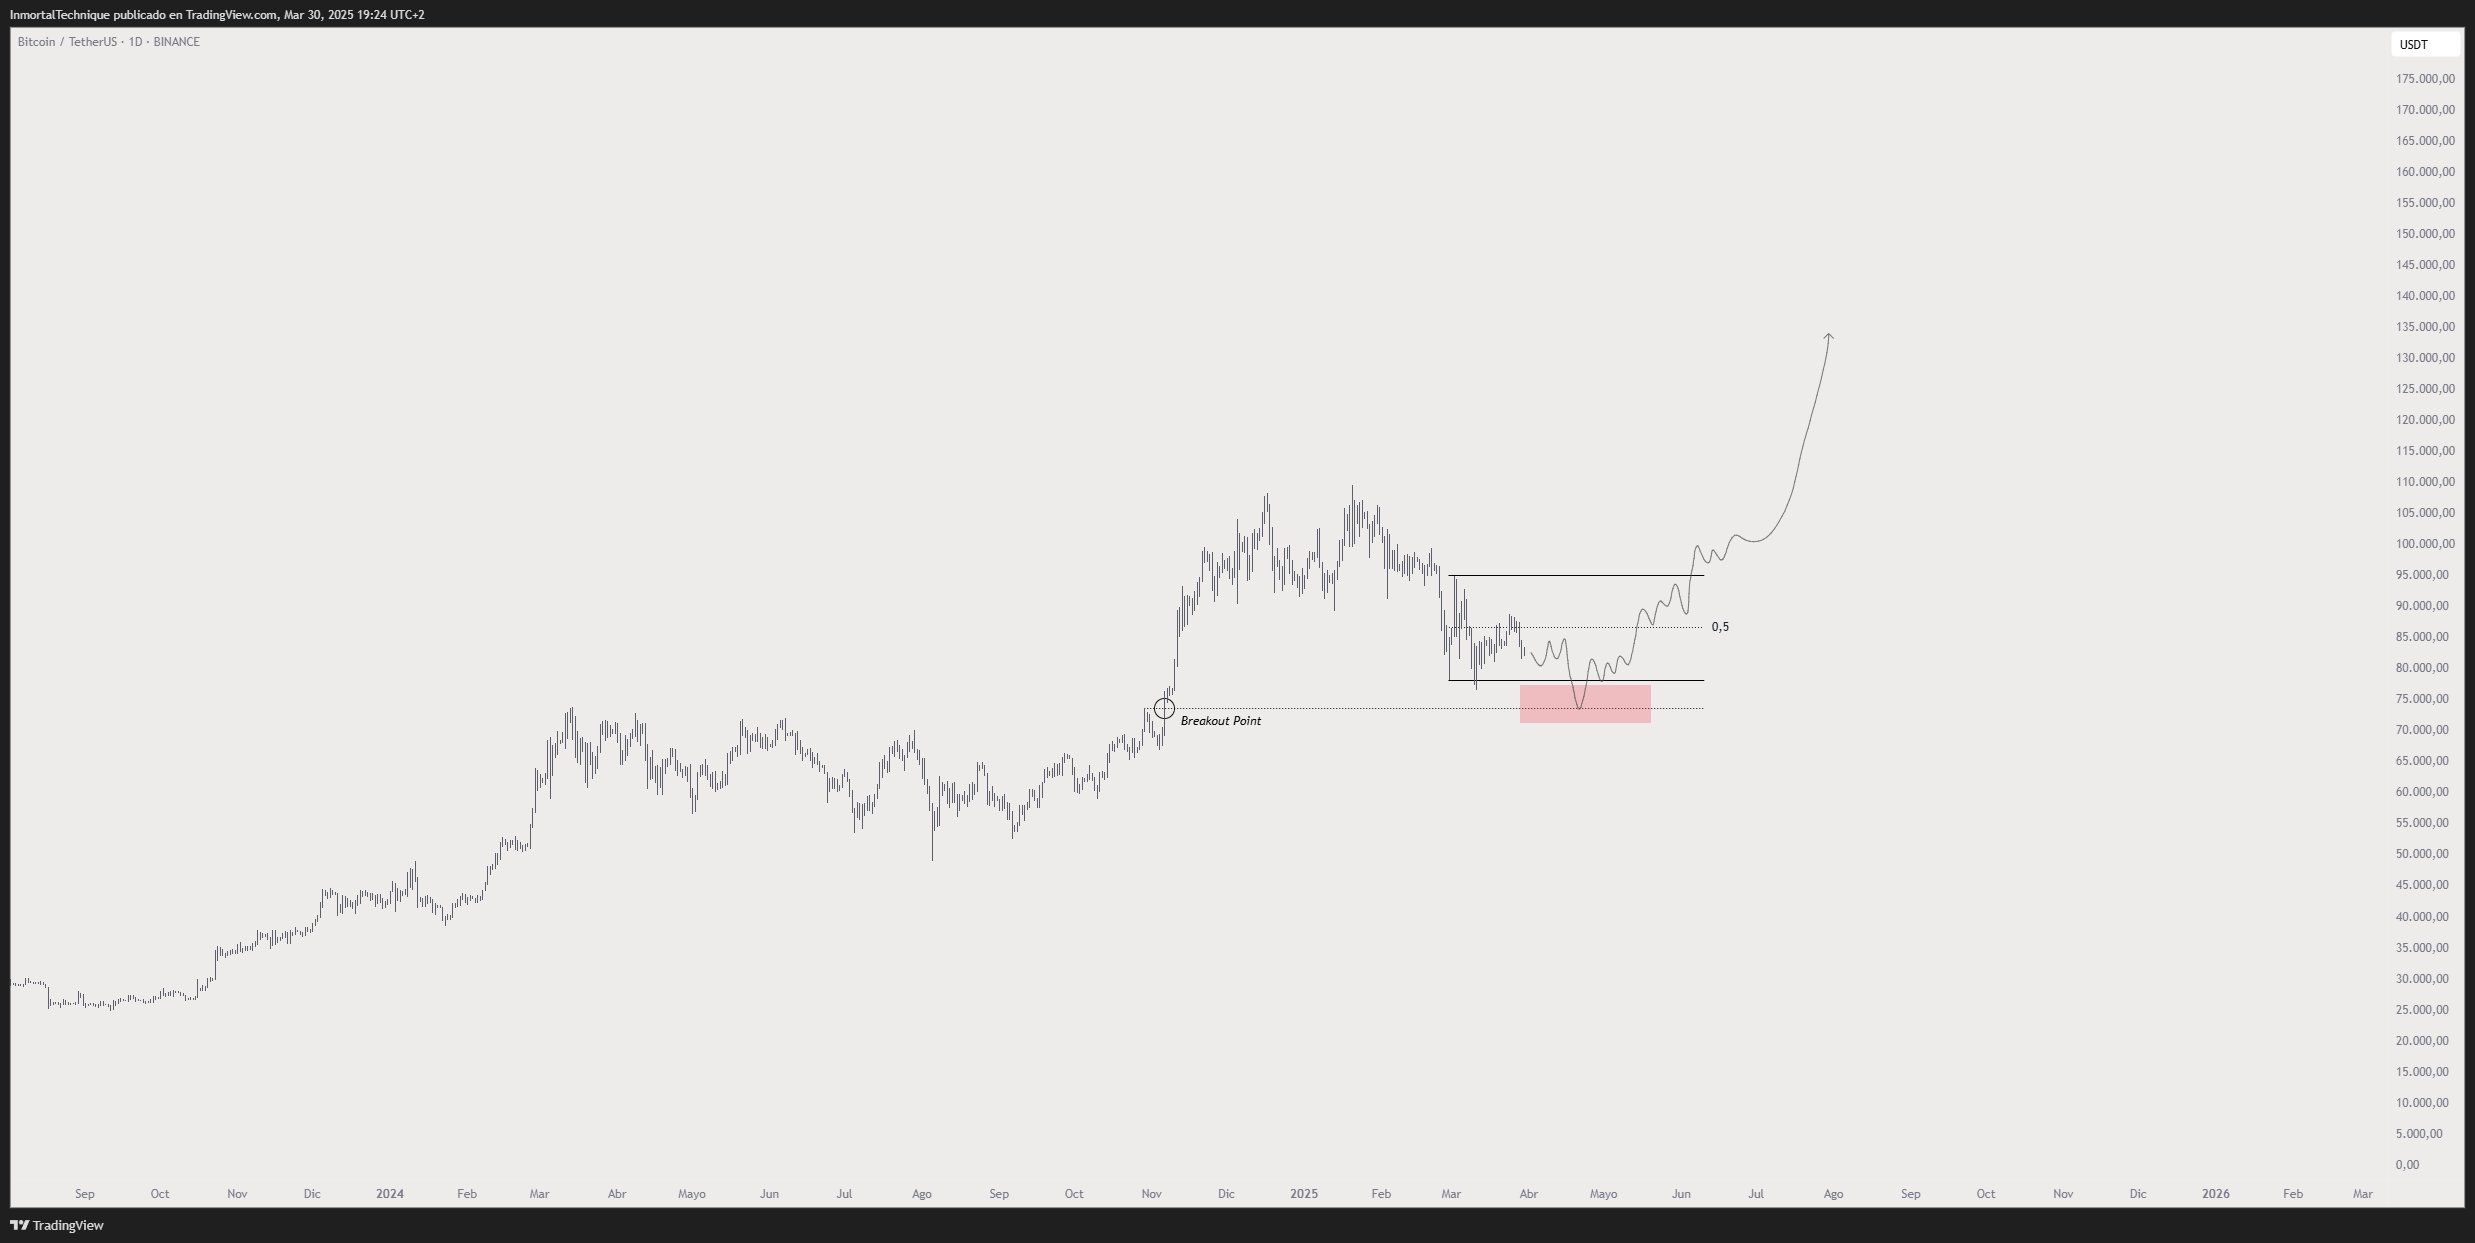
At time of writing, BTC is trading for $82,374.
As for Ethereum, Inmortal predicts that the price of ETH may plummet below $1,500 before sparking a short-term rally toward $2,000.
“Expansions lead to retraces. Retraces lead to bounces.
Bounce soon.”

At time of writing, ETH is trading at $1,822.
Follow us on X, Facebook and Telegram
Don’t Miss a Beat – Subscribe to get email alerts delivered directly to your inbox
Check Price Action
Surf The Daily Hodl Mix
 

Disclaimer: Opinions expressed at The Daily Hodl are not investment advice. Investors should do their due diligence before making any high-risk investments in Bitcoin, cryptocurrency or digital assets. Please be advised that your transfers and trades are at your own risk, and any losses you may incur are your responsibility. The Daily Hodl does not recommend the buying or selling of any cryptocurrencies or digital assets, nor is The Daily Hodl an investment advisor. Please note that The Daily Hodl participates in affiliate marketing.
Generated Image: Midjourney
Source link

Kristin Smith Steps Down as Blockchain Association CEO to Lead Solana’s Policy Push

crypto eyes ‘good news’ amid fragile market psychology

Bitcoin Price (BTC) Rises Ahead of President Trump Tariff Announcement

XRP Price to $27? Expert Predicts Exact Timeline for the Next Massive Surge
Bitcoin And Altcoins Fischer Transform Indicator Turn Bearish For The First Time Since 2021

Grayscale files S-3 for Digital Large Cap ETF

279% Rally in 2025 for One Under-the-Radar Altcoin ‘Very Likely,’ According to Crypto Analyst

Human Rights Foundation Donates 1 Billion Satoshis To Fund Bitcoin Development

Dogecoin, Cardano Lead Gains as Crypto Majors Rally

Fartcoin price surges 35% as recovery gains momentum

$1M Premium Paid for $70K Bitcoin Put Option

How DePIN’s Revenue Growth is Attracting Equity Investors – DePIN Token Economics Report

Bitcoin Poised For A Q2 Recovery? Analyst Points 2017 Similarities

Binance ends Tether USDT trading in Europe to comply with MiCA rules

Crypto Trader Warns of Potential 33% Dogecoin Drop, Unveils Downside Price Target for Ethereum


 24/7 Cryptocurrency News5 months ago
Arthur Hayes, Murad’s Prediction For Meme Coins, AI & DeFi Coins For 2025

 Bitcoin3 months ago
Expert Sees Bitcoin Dipping To $50K While Bullish Signs Persist

 24/7 Cryptocurrency News3 months ago
Aptos Leverages Chainlink To Enhance Scalability and Data Access

 Bitcoin5 months ago
Bitcoin Could Rally to $80,000 on the Eve of US Elections

 Altcoins2 months ago
Sonic Now ‘Golden Standard’ of Layer-2s After Scaling Transactions to 16,000+ per Second, Says Andre Cronje

 Bitcoin5 months ago
Institutional Investors Go All In on Crypto as 57% Plan to Boost Allocations as Bull Run Heats Up, Sygnum Survey Reveals

 Opinion5 months ago
Crypto’s Big Trump Gamble Is Risky

 Price analysis5 months ago
Ripple-SEC Case Ends, But These 3 Rivals Could Jump 500x
