
Bitcoin
Mastering Bitcoin On-Chain Data
Bitcoin’s price movements dominate headlines, but the real story of BTC lies beneath the surface. Beyond technical analysis and price speculation, on-chain data offers an unparalleled view of supply, demand, and investor behavior in real time. By leveraging these insights, traders and investors can anticipate market trends, follow institutional movements, and make data-driven decisions.
For a more in-depth look into this topic, check out a recent YouTube video here: Mastering Bitcoin On-Chain Data
Realized Price & MVRV Z-Score
On-chain data refers to the publicly available transaction records on Bitcoin’s blockchain. Unlike traditional markets, where investor actions are obscured, Bitcoin’s transparency allows for real-time analysis of every transaction, wallet movement, and network activity. This information helps investors identify major trends, accumulation zones, and potential price inflection points.
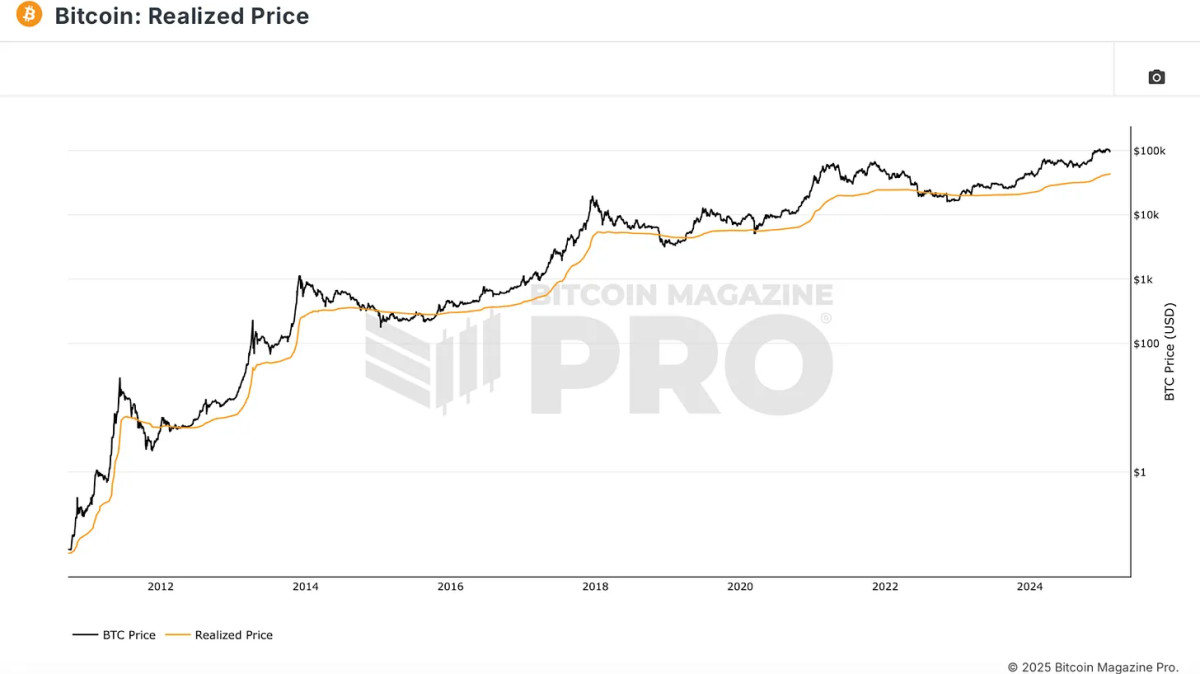
One of the most crucial on-chain metrics is Realized Price, which reflects the average cost basis of all BTC in circulation. Unlike traditional assets, where investor cost bases are difficult to determine, Bitcoin provides real-time visibility into when the majority of holders are in profit or loss.

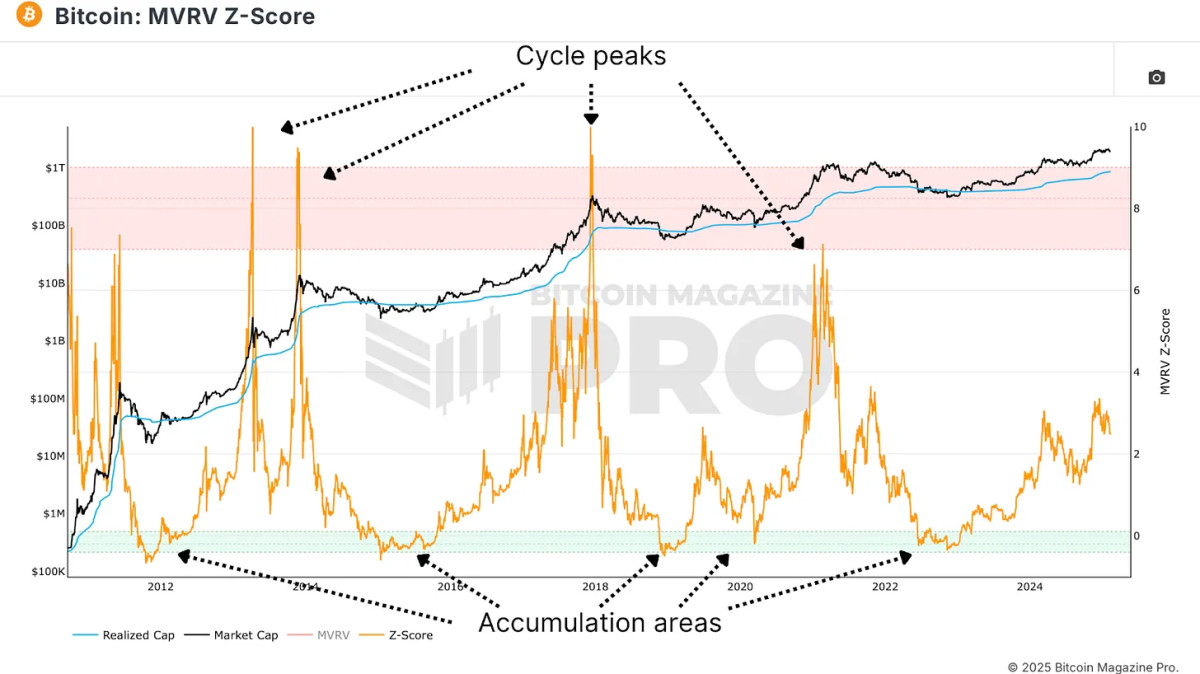
To enhance the utility of Realized Price, analysts employ the MVRV Z-Score, which measures the deviation between market value and realized value, standardized for Bitcoin’s volatility. This indicator has historically identified optimal buying zones when it enters the lower range and potential overvaluation when it enters the red zone.
Monitoring Long-Term Holders
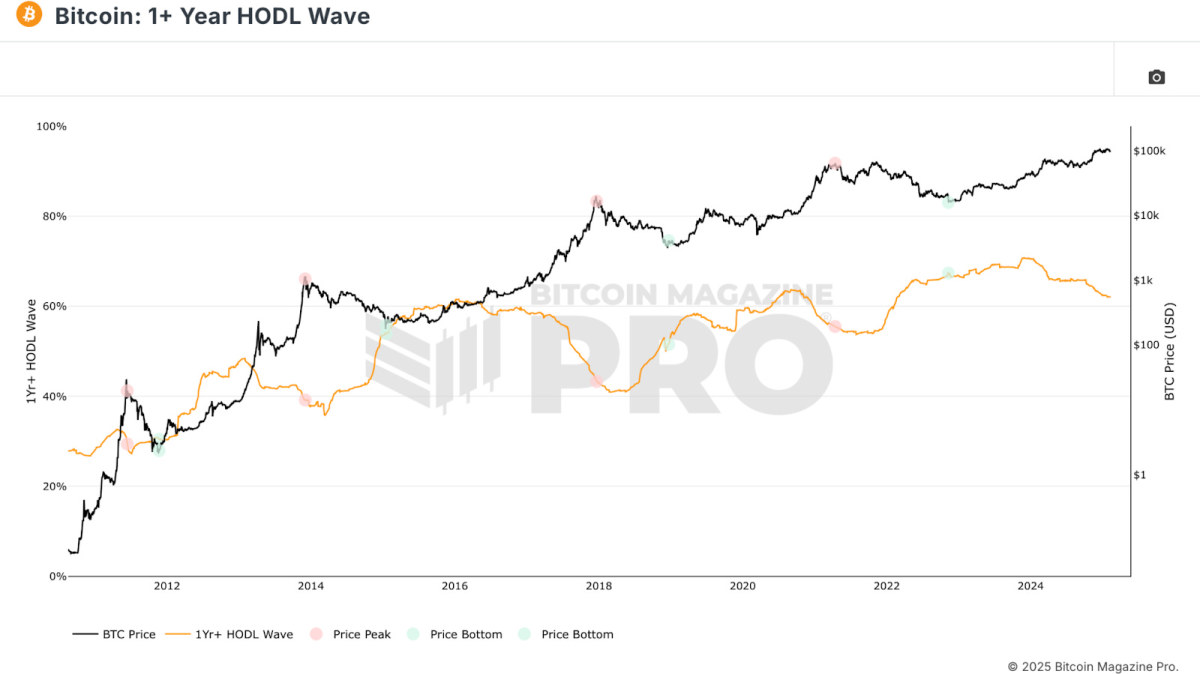
Another key metric is the 1+ Year HODL Wave, which tracks Bitcoin addresses that haven’t moved funds for at least a year. A rising HODL wave indicates that investors are choosing to hold, reducing circulating supply and creating upward price pressure. Conversely, when this metric starts declining, it suggests profit-taking and potential distribution.
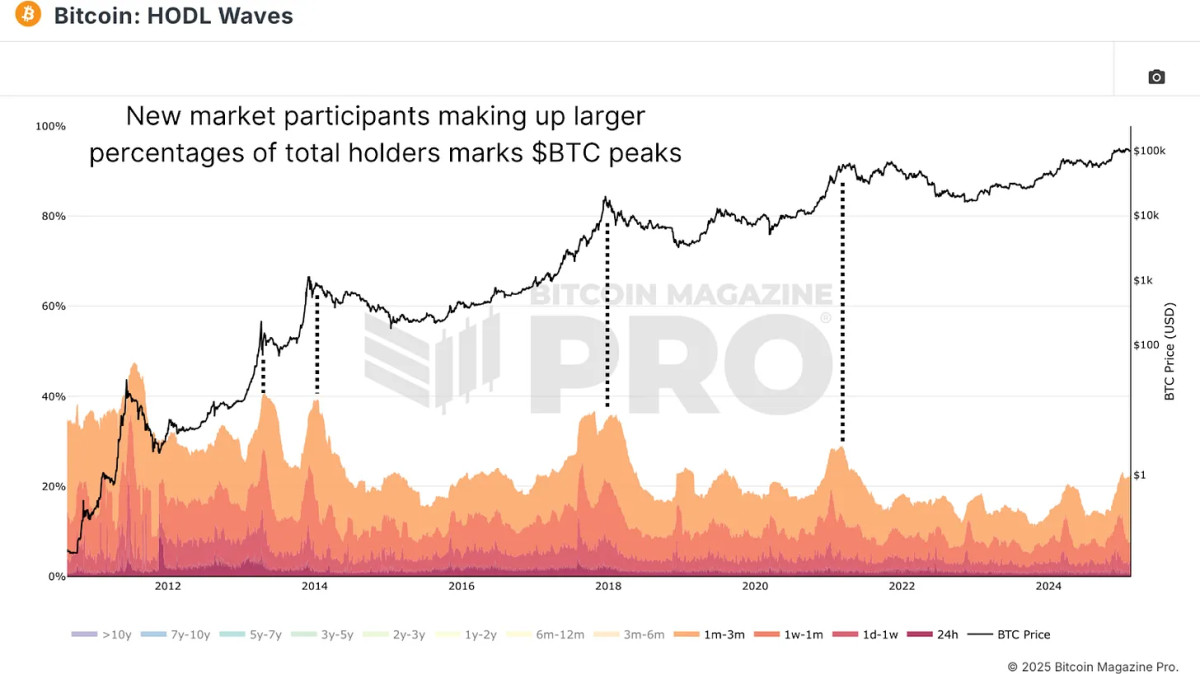
HODL Waves visualizes the entire distribution of Bitcoin ownership by age bands. Filtering to new market participants of 3 months or less reveals typical retail participation levels. Peaks in short-term holders typically signal market tops, while low levels indicate ideal accumulation zones.
Spotting Whale Movements
Supply Adjusted Coin Days Destroyed quantifies the total BTC moved, weighted by how long it was held, and standardizes that data by the circulating supply at that time. For example:
- 1 BTC held for 100 days → 100 Coin Days Destroyed
- 0.1 BTC held for 1,000 days → 100 Coin Days Destroyed
This metric is invaluable for detecting whale activity and institutional profit-taking. When long-dormant coins suddenly move, it often signals large holders exiting positions. Historical data confirms that spikes in this data point align with major market tops and bottoms, reinforcing its value in cycle analysis.

Realized Gains & Losses
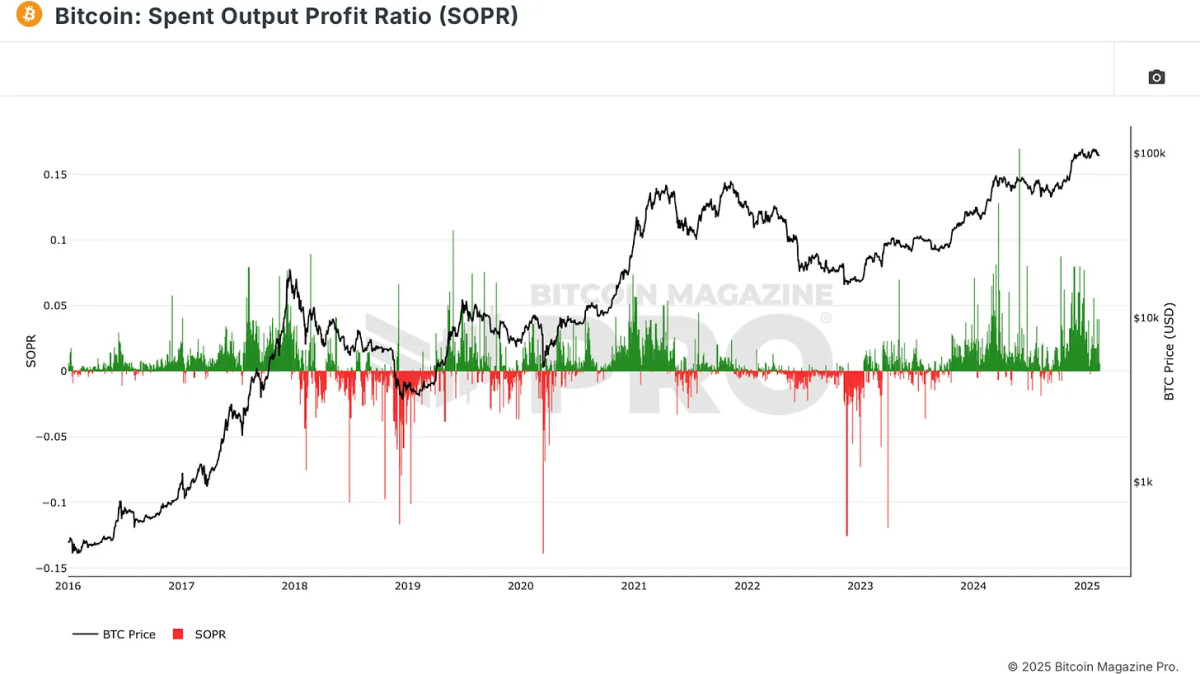
The Spent Output Profit Ratio (SOPR) reveals the profitability of BTC transactions. A SOPR value above 0 indicates that the average Bitcoin being moved is in profit, while a value below 0 means the average sale is at a loss. By observing SOPR spikes, traders can identify euphoric profit-taking, while SOPR declines often accompany bear market capitulations.
Relying on a single metric can be misleading. To increase the probability of accurate signals, investors should seek confluence between multiple on-chain indicators.
For example, when:
- MVRV Z-score is in the green zone (undervalued)
- SOPR indicates high realized losses (capitulation)
- HODL waves show a decline in short-term holders (selling exhaustion)
This alignment historically marks optimal accumulation zones. You should also look for confluence for any planned profit-taking for your BTC holdings, looking for the above metrics all signaling the opposite to outline overheated market conditions.
Conclusion
Bitcoin’s on-chain data provides a transparent, real-time view of market dynamics, offering investors an edge in decision-making. By tracking supply trends, investor psychology, and accumulation/distribution cycles, Bitcoiners can better position themselves for long-term success.
Explore live data, charts, indicators, and in-depth research to stay ahead of Bitcoin’s price action at Bitcoin Magazine Pro.
Disclaimer: This article is for informational purposes only and should not be considered financial advice. Always do your own research before making any investment decisions.
Source link


Recently very shaky risk assets — crypto among them — are attempting a rally on Tuesday, perhaps. buoyed by chatter that Donald Trump’s tariffs won’t be as stringent as feared.
In early afternoon U.S. action, bitcoin (BTC) had climbed to just above $85,000, ahead 2.1% over the past 24 hours. Previously really roughed up crypto majors like ether (ETH), dogecoin (DOGE) and cardano (ADA) had put in gains of roughly twice that amount.
Crypto stocks are also performing well, with bitcoin miners Core Scientific (CORZ) and CleanSpark (CLSK) jumping almost 10% on the day. Strategy (MSTR) is up 5.4% and Coinbase (COIN) 2.1%.
U.S. stocks reversed early session losses to turn higher as well, with the Nasdaq now ahead just shy of 1% for the day.
The action comes ahead of the Trump administration’s so-called “Liberation Day” tariff rollout set for tomorrow after the close of U.S. trading.
Hope?
A report from NBC News suggested the market’s most feared option — blanket 20% tariffs across the board — is “less likely” to be the direction taken by the White House. Instead, according to the report, a “tiered system” of different rates or country-by-country rates could be announced.
Also maybe helping is what appears to be the first acknowledgement that the administration is aware of the market tumult resulting from all the tariff chatter. Speaking today at her daily briefing, White House Press Secretary Karoline Leavitt said that there were legitimate concerns about market swings.
Meanwhile, Israel’s Minister of Finance Bezalel Smotrich announced on Tuesday that a process had been launched to get rid of tariffs on U.S. imports in that country.
Source link
Reason to trust
![]()
Strict editorial policy that focuses on accuracy, relevance, and impartiality
Created by industry experts and meticulously reviewed
The highest standards in reporting and publishing
Strict editorial policy that focuses on accuracy, relevance, and impartiality
Morbi pretium leo et nisl aliquam mollis. Quisque arcu lorem, ultricies quis pellentesque nec, ullamcorper eu odio.
Technical expert Tony Severino has warned that the Bitcoin and altcoins Fischer Transform indicator has flipped bearish for the first time since 2021. The analyst also revealed the implications of this development and how exactly it could impact these crypto assets.
Bitcoin And Altcoins Fischer Transform Indicator Turns Bearish
In an X post, Severino revealed that the total crypto market cap 12-week Fisher Transform has flipped bearish for the first time since December 2021. Before then, the indicator had flipped bearish in January 2018. In 2021 and 2018, the total crypto market cap dropped 66% and 82%, respectively. This provides a bearish outlook for Bitcoin and altcoins, suggesting they could suffer a massive crash soon enough.
Related Reading
In another X post, the technical expert revealed that Bitcoin’s 12-week Fischer Transform has also flipped bearish. Severino noted that this indicator converts prices into a Gaussian normal distribution to smooth out price data and filter out noise. In the process, it helps generate clear signals that help pinpoint major market turning points.
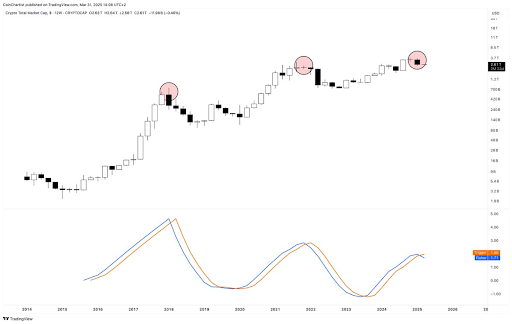
Severino asserted that this indicator on the 12-week timeframe has never missed a top or bottom call, indicating that Bitcoin and altcoins may have indeed topped out. The expert has been warning for a while now that the Bitcoin top might be in and that a massive crash could be on the horizon for the flagship crypto.
He recently alluded to the Elliott Wave Theory and market cycles to explain why he is no longer bullish on Bitcoin and altcoins. He also highlighted other indicators, such as the Parabolic SAR (Stop and Reverse) and Average Directional Index (ADX), to show that BTC’s bullish momentum is fading. The expert also warned that a sell signal could send BTC into a Supertrend DownTrend, with the flagship crypto dropping to as low as $22,000.
A Different Perspective For BTC
Crypto analyst Kevin Capital has provided a different perspective on Bitcoin’s price action. While noting that BTC is in a correctional phase, he affirmed that it will soon be over. Kevin Capital claimed that the question is not whether this phase will end. Instead, it is about how strong Bitcoin’s bounce will be and whether the flagship crypto will make new highs or record a lackluster lower high followed by a bear market.
Related Reading
The analyst added that Bitcoin’s price action when that time comes will also be trackable using other methods, such as money flow, macro fundamentals, and overall spot volume. The major focus is on the macro fundamentals as market participants look forward to Donald Trump’s much-anticipated reciprocal tariffs, which will be announced tomorrow.
At the time of writing, the Bitcoin price is trading at around $83,000, up around 1% in the last 24 hours, according to data from CoinMarketCap.
Featured image from Unsplash, chart from Tradingview.com
Source link
Altcoins
279% Rally in 2025 for One Under-the-Radar Altcoin ‘Very Likely,’ According to Crypto Analyst

A closely followed crypto strategist believes that the native asset of a layer-2 scaling solution could witness an over 3x rally this year.
Pseudonymous analyst Inmortal tells his 231,000 followers on the social media platform X that he’s bullish on Mantle (MNT), noting that he believes the altcoin has already printed a 2025 bottom at around $0.6.
According to the trader, a 279% rally for MNT this year is a high-probability scenario.
“Starting to feel like bottom is in.
Big players have been buying over the last few weeks, and it shows.
$3 in 2025 is very likely, high-conviction play for me.”

Based on the trader’s chart, he seems to predict that MNT will surge to $1.30 in the coming months.
At time of writing, MNT is worth $0.79.
Turning to Bitcoin, the trader unveils a potential path for BTC to print a durable bottom this year. According to Inmortal, BTC could temporarily drop below $70,000 before igniting the next stage of the bull market en route to a new all-time high of $135,000.
“They will try to shake you out, but this is the bottom.
Save the tweet.
BTC.”
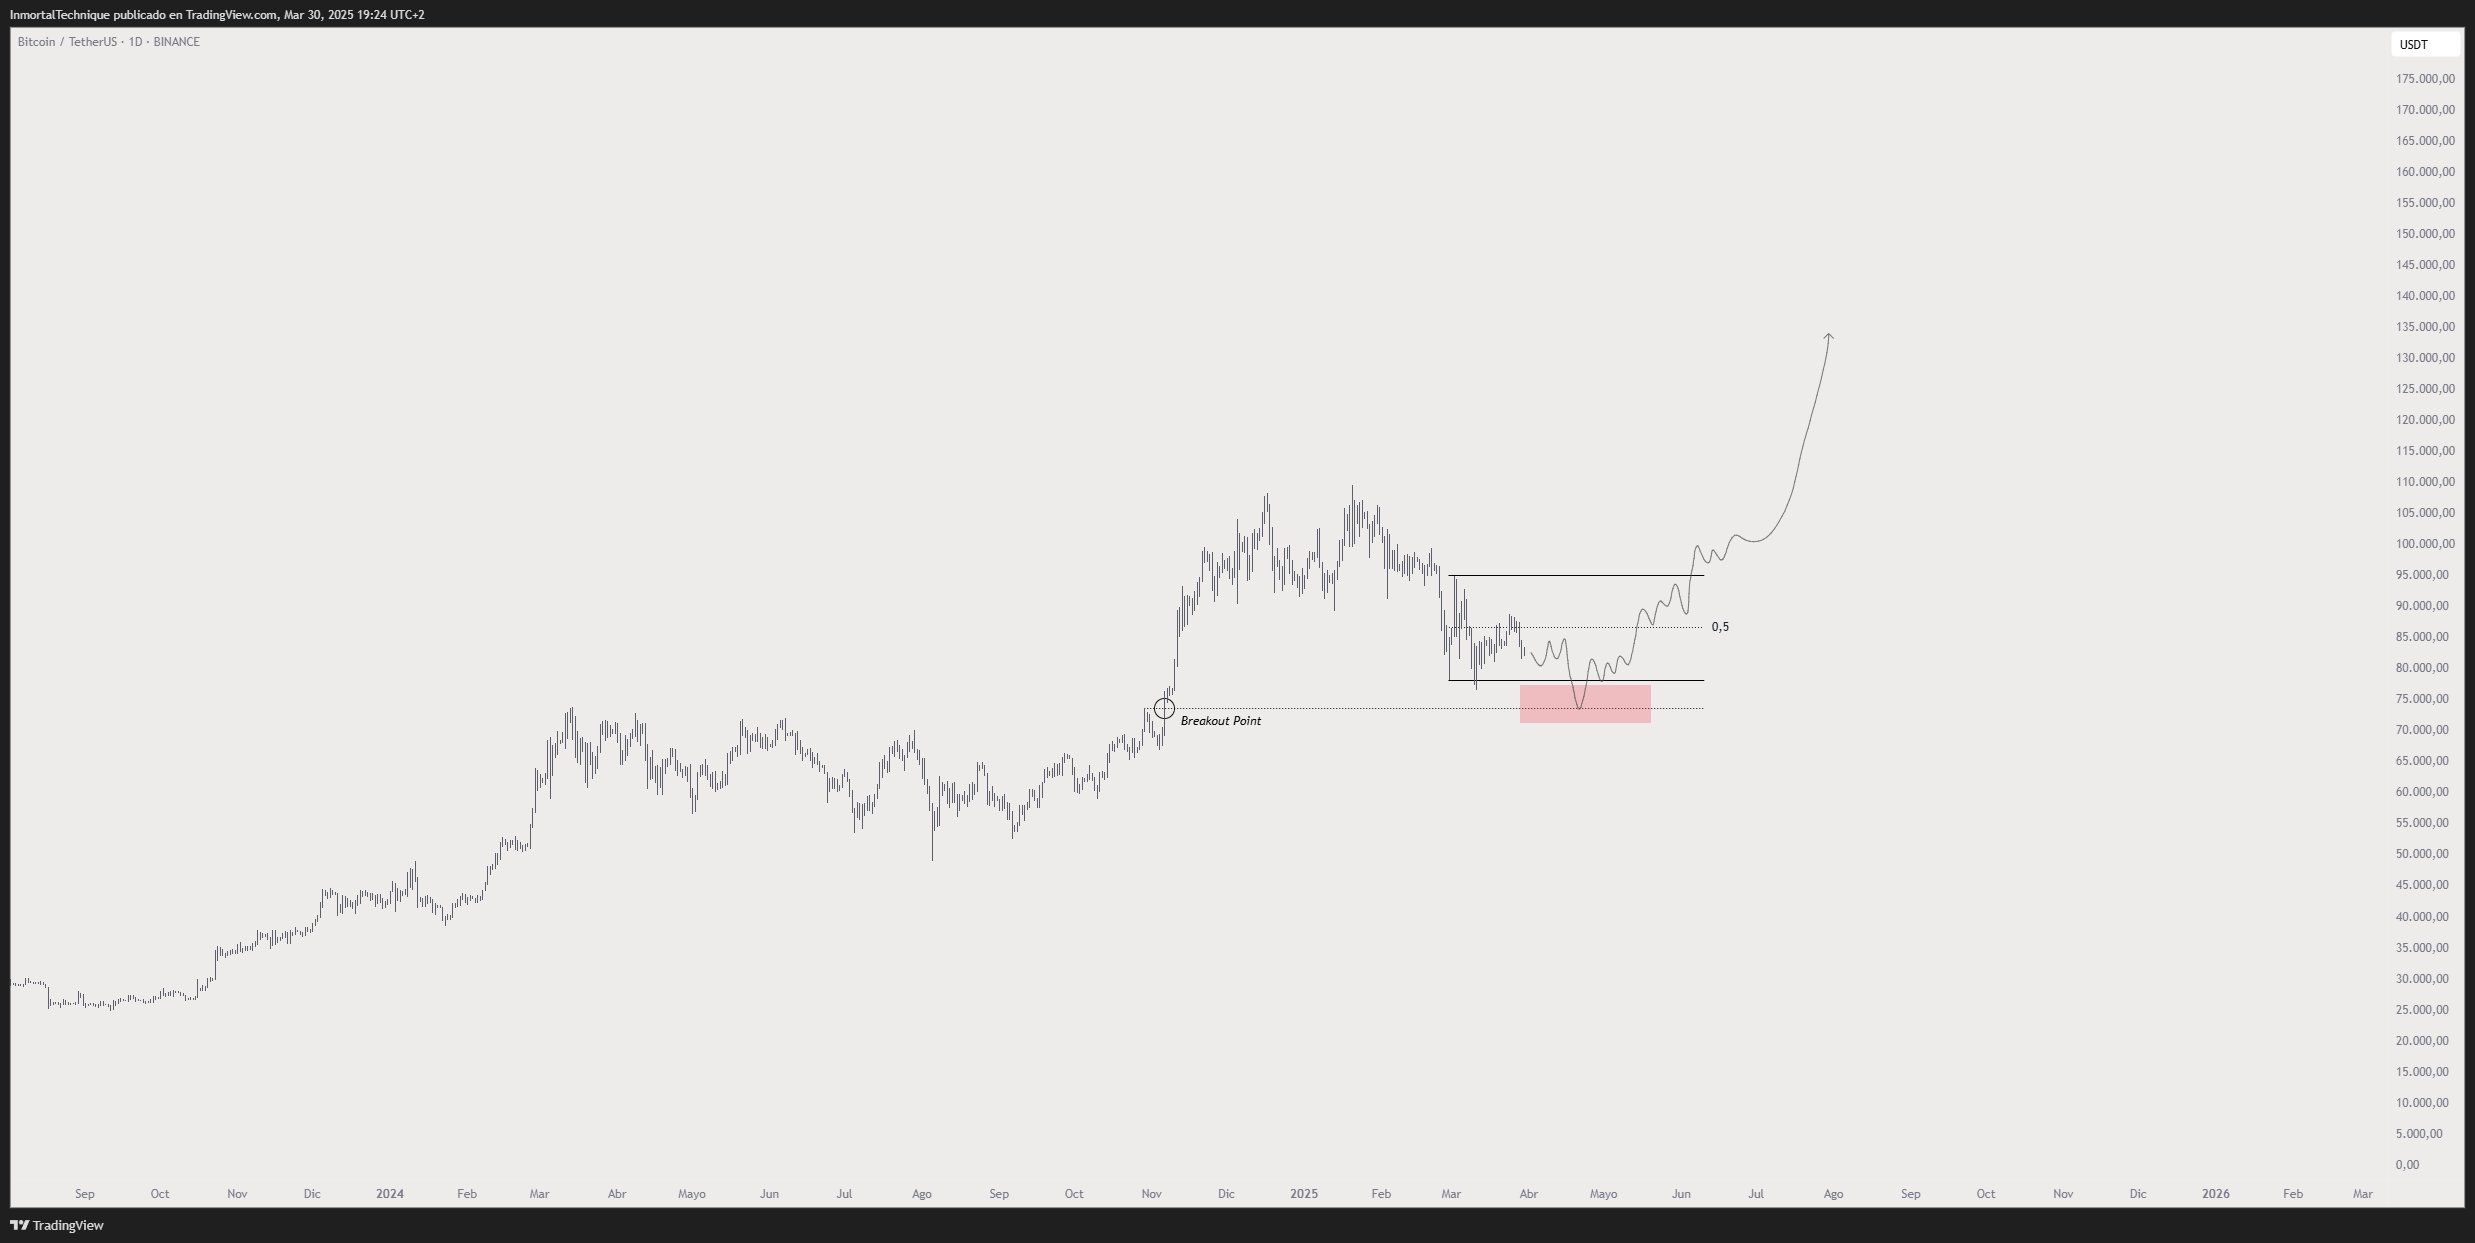
At time of writing, BTC is trading for $82,374.
As for Ethereum, Inmortal predicts that the price of ETH may plummet below $1,500 before sparking a short-term rally toward $2,000.
“Expansions lead to retraces. Retraces lead to bounces.
Bounce soon.”

At time of writing, ETH is trading at $1,822.
Follow us on X, Facebook and Telegram
Don’t Miss a Beat – Subscribe to get email alerts delivered directly to your inbox
Check Price Action
Surf The Daily Hodl Mix
 

Disclaimer: Opinions expressed at The Daily Hodl are not investment advice. Investors should do their due diligence before making any high-risk investments in Bitcoin, cryptocurrency or digital assets. Please be advised that your transfers and trades are at your own risk, and any losses you may incur are your responsibility. The Daily Hodl does not recommend the buying or selling of any cryptocurrencies or digital assets, nor is The Daily Hodl an investment advisor. Please note that The Daily Hodl participates in affiliate marketing.
Generated Image: Midjourney
Source link

Kristin Smith Steps Down as Blockchain Association CEO to Lead Solana’s Policy Push

crypto eyes ‘good news’ amid fragile market psychology

Bitcoin Price (BTC) Rises Ahead of President Trump Tariff Announcement

XRP Price to $27? Expert Predicts Exact Timeline for the Next Massive Surge
Bitcoin And Altcoins Fischer Transform Indicator Turn Bearish For The First Time Since 2021

Grayscale files S-3 for Digital Large Cap ETF

279% Rally in 2025 for One Under-the-Radar Altcoin ‘Very Likely,’ According to Crypto Analyst

Human Rights Foundation Donates 1 Billion Satoshis To Fund Bitcoin Development

Dogecoin, Cardano Lead Gains as Crypto Majors Rally

Fartcoin price surges 35% as recovery gains momentum

$1M Premium Paid for $70K Bitcoin Put Option

How DePIN’s Revenue Growth is Attracting Equity Investors – DePIN Token Economics Report

Bitcoin Poised For A Q2 Recovery? Analyst Points 2017 Similarities

Binance ends Tether USDT trading in Europe to comply with MiCA rules

Crypto Trader Warns of Potential 33% Dogecoin Drop, Unveils Downside Price Target for Ethereum


 24/7 Cryptocurrency News5 months ago
Arthur Hayes, Murad’s Prediction For Meme Coins, AI & DeFi Coins For 2025

 Bitcoin3 months ago
Expert Sees Bitcoin Dipping To $50K While Bullish Signs Persist

 24/7 Cryptocurrency News3 months ago
Aptos Leverages Chainlink To Enhance Scalability and Data Access

 Bitcoin5 months ago
Bitcoin Could Rally to $80,000 on the Eve of US Elections

 Altcoins2 months ago
Sonic Now ‘Golden Standard’ of Layer-2s After Scaling Transactions to 16,000+ per Second, Says Andre Cronje

 Bitcoin5 months ago
Institutional Investors Go All In on Crypto as 57% Plan to Boost Allocations as Bull Run Heats Up, Sygnum Survey Reveals

 Opinion5 months ago
Crypto’s Big Trump Gamble Is Risky

 Price analysis5 months ago
Ripple-SEC Case Ends, But These 3 Rivals Could Jump 500x
