
ETH Price
Impact of Bybit’s $1.5B ETH Hack on ETH

The crypto market faced a huge shock when 401,346.76 ETH worth $1.5B was drained from ByBit’s wallets on Friday. Ethereum (ETH) price dropped 8% on February 21 due to this security incident. The short-term fear dissipated as ByBit confirmed that the customer funds were safe. Let’s explore Ethereum price forecasts and how this hack and the exchange’s $1.3B bridged loan short-term ETH price outlook.
Ethereum Price Crashes 8% After Bybit Hack: Here’s What Happened
- A masked UI exploit drained roughly 401,346 ETH ($1.5B) from Bybit’s cold wallets.
- North Korea’s Lazarus Group are the hackers behind ByBit’s hack, per on-chain investigator ZachXBT.
- As a result of this security incident, ETH’s price dropped 8% from $ 2,845 to $2,614 on Friday, February 21, 2025.
- ByBit CEO Ben Zhou confirmed that no customer funds had been lost and that the exchange had remained solvent. Over 350,000 withdrawal requests were processed despite the breach.
DeepSeek Predicts Bybit’s $1.5B Bridged Loan Impact on ETH Price
To cover the $1.5B loss from the hack, Bybit secured a bridged loan from multiple crypto exchanges and entities. A bridge loan is a short-term financing mechanism where the exchange borrows Ethereum, sells it immediately, and plans to repurchase it later at a lower price.
The longer ByBit waits, the more riskier the loan gets. Since this strategy hinges on ETH price stability, a sudden Ethereum rally could increase Bybit’s repayment costs and also negatively impact the counterpart handling costs as well.
Zaheer, a popular crypto analyst, noted that ByBit had taken a short position on Ethereum worth $1.5 billion (at the time) via a bridge loan. The term “bridged loan” here refers to a short-term financing mechanism where the exchange borrowed Ethereum to sell, expecting to buy it back cheaper later.
The CEO stated in the live stream that they had secured 80% of the hacked funds via a bridged loan to provide them “liquidity” to help “with the liquidity crunch” during this crucial period.
However, this strategy could backfire if their lending counterparty refuses to absorb potential losses. Zaheer adds,
“I’m gonna guess that their lending counterparty is not ok to take the price delta on this.”
Below are four hypothetical scenarios outlined by DeepSeek AI on how this loan could impact Ethereum price.
ETH Price Stays Flat or Declines
- Bridge Loan Impact: Bybit can repay the loan at a stable or lower cost, minimizing additional losses.
- ETH Price Impact: A flat or declining ETH price reduces pressure on Bybit, but uncertainty around the hack and potential hacker sell-offs could create bearish sentiment, keeping ETH prices in the
- $3,500 to $3,700 range.
A Moderately Rally in Ethereum
- Bridge Loan Impact: Repaying the loan becomes costlier, adding ~$100 million in losses. Bybit may need to dip deeper into reserves or seek additional financing.
- ETH Price Impact: A moderate rally could stem from positive market sentiment or speculation that Bybit’s recovery efforts will stabilize the market. However, Bybit’s need to buy ETH could drive prices up temporarily, followed by stabilization.
ETH Value Shoots Up Sharply
- Bridge Loan Impact: Bybit faces significant losses (~$2 billion to buy back 402,000 ETH), potentially straining reserves and risking insolvency.
- ETH Price Impact: A sharp rally might occur if speculators bid up ETH to pressure Bybit or if broader market optimism drives demand. However, this could also trigger panic selling by hackers or traders, leading to extreme volatility.
Market Participants Pressure Bybit by Bidding Up ETH
- Bridge Loan Impact: If traders intentionally drive ETH’s price higher, Bybit’s repayment costs soar, risking default or massive reserve depletion.
- ETH Price Impact: Such manipulation could push ETH to the $5,500 to $6,000 range temporarily, but subsequent sell-offs could crash prices back to
- $3,000 to $4,000, creating extreme volatility.
Ethereum Price Forecast: What’s Next for ETH?
The four-hour Ethereum price chart shows a pullback into the $2,765 to $2,522 values area formed between February 3 and 21. Considering how well the Bybit team handled the crash, the crypto markets are looking good and might rebound from here. If Bitcoin (BTC) revisits $100K and does not sell off, investors can expect a broader crypto market rally. In such a case, Ethereum price prediction notes the 2025 anchored VWAP at $3,017 as the next key resistance level.
Other notable hurdles if Ethereum price kickstarts an uptrend include $3,119, coinciding closely with Q4 anchored VWAP at $3,141, followed by $3,300, coinciding with Q4 November 2024 VWAP at $3,269.
As noted in a previous CoinGape article, a breakdown of the $2,621 support level could trigger an ETH crash.
The next key support levels are nearly 20% lower at $2,100 and $2,044. If hackers start offloading stolen ETH, the aforementioned scenario could unfold. In such a case, a sweep of $2,000 psychological level is likely and is the best place to buy Ethereum (ETH) at a discount.
Conclusion: Bybit Hack’s Long-Term Impact on ETH
The Bybit hack underscores crypto’s security risks but also highlights how exchanges mitigate crises. While the $1.5B bridged loan stabilizes Bybit, ETH price faces dual threats: hacker sell-offs and loan repayment risks. Despite the obvious short-term ETH volatility expectations, investors should focus on the long-term recovery, which hinges on a few key aspects, such as:
- Bybit’s ability to recover funds or absorb losses.
- Regulatory crackdowns on North Korean hackers.
- Bitcoin and broader crypto market sentiment.
As of this writing, the hackers have transferred 5,000 ETH to a mixer and are attempting to launder the funds, according to on-chain sleuth ZachXBT.

Frequently Asked Questions (FAQs)
The Bybit hack caused Ethereum’s price to drop 8% initially, but long-term impacts depend on hacker sell-offs and Bybit’s $1.5B bridged loan repayment.
Bybit’s $1.5B bridged loan could strain Ethereum’s price if ETH rallies, as higher prices increase repayment costs and risk market volatility.
Ethereum’s recovery depends on Bybit’s ability to stabilize its finances, hacker activity, and broader market sentiment, with potential for ETH to rebound to $4,000 to $5,000 in 2025.
Akash Girimath
Senior Cryptocurrency Analyst & Market Strategist
Engineer-turned-analyst Akash Girimath delivers data-driven insights on cryptocurrency markets, DeFi, and blockchain technology for platforms like AMBCrypto and FXStreet. Specializing in technical analysis, on-chain analytics, and risk management, he empowers institutional investors and retail traders to navigate market volatility and regulatory shifts.
A hands-on strategist, Akash merges active crypto portfolio management with research on Web3, NFTs, and tokenomics. At AMBCrypto, he led cross-functional teams to redesign content frameworks, achieving record-breaking traffic growth through scalable editorial strategies. His analyses dissect market sentiment, investment strategies, and price predictions, blending macroeconomic trends with real-world trading expertise.
Known for mentoring analysts and optimizing workflows for high-impact reporting, Akash’s work is cited across global crypto publications, reaching 500k+ monthly readers. Follow his insights on YouTube, X, and LinkedIn for cutting-edge perspectives on decentralized ecosystems and crypto innovation.
Disclaimer: The presented content may include the personal opinion of the author and is subject to market condition. Do your market research before investing in cryptocurrencies. The author or the publication does not hold any responsibility for your personal financial loss.
Source link


Reason to trust
![]()
Strict editorial policy that focuses on accuracy, relevance, and impartiality
Created by industry experts and meticulously reviewed
The highest standards in reporting and publishing
Strict editorial policy that focuses on accuracy, relevance, and impartiality
Morbi pretium leo et nisl aliquam mollis. Quisque arcu lorem, ultricies quis pellentesque nec, ullamcorper eu odio.
Ethereum’s attempt to regain bullish momentum has hit a roadblock, as the price failed to break through the crucial $2,160 resistance level. After showing signs of recovery, ETH faced strong selling pressure at this key level, preventing a sustained breakout and disappointing bullish traders who were hoping for further upside.
Its inability to push past this resistance suggests that bears are still in control, keeping Ethereum’s price under pressure. With the momentum fading and the market sentiment turning cautious, traders are now closely watching key support zones to determine the next move.
Bearish Pressure Mounts: What’s Next For Ethereum?
Ethereum is facing increasing downside pressure as its latest recovery attempt was rejected at the $2,160 resistance level. The failed breakout has reinforced bearish sentiment, with key technical indicators signaling weakness. If buyers fail to step in, ETH could be at risk of deeper declines in the near term.
Related Reading
One of the major warning signs is weak volume during the recovery attempt. A strong breakout typically requires significant buying interest, but Ethereum’s rally lacked momentum, making it easier for sellers to regain control. This lack of conviction from bulls suggests that the upside move was not sustainable, allowing bears to push prices lower.
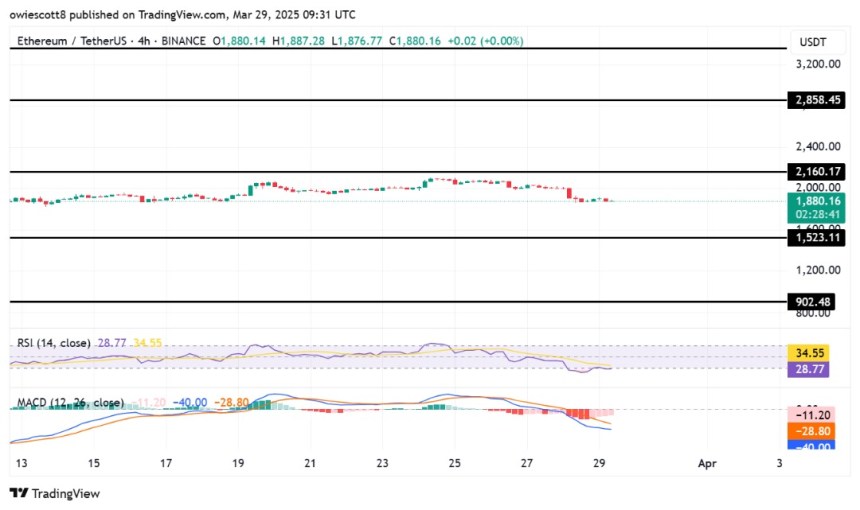
Additionally, the Relative Strength Index (RSI) has broken down, moving below key thresholds that indicate weakening bullish strength. The current declining RSI shows that buying pressure is fading, making it difficult for Ethereum to build upward momentum. If the RSI continues trending downward, it could further confirm a prolonged bearish phase.
The Moving Average Convergence Divergence (MACD) has also turned negative, with a breakdown below the signal line and a widening gap between the MACD and its moving average. This crossover indicates that bearish momentum is accelerating, reducing the chances of an immediate recovery. When combined with other bearish signals, the MACD breakdown further supports the case for a continued downside.
Looking ahead, ETH may retest key support zones. However, a strong bounce from lower levels could offer bulls another chance to regain lost ground. For now, the charts suggest that Ethereum remains vulnerable to further declines.
Support Levels To Watch: Can Bulls Prevent Further Decline?
With attention now turning to key support levels, the first major support to watch is around $1,523, a level that previously acted as a short-term demand zone. If Ethereum holds above this area, it might provide bulls with a foundation for another rebound attempt. However, a break below this level could signal growing bearish dominance, increasing the risk of deeper losses.
Related Reading
Below $1,523, the next key support lies at $902, aligning with previous price reactions and acting as a psychological level for traders. A failure to hold here may accelerate selling pressure, pushing ETH toward other support below.
Featured image from iStock, chart from Tradingview.com
Source link
3M Bollinger Bands
Ethereum Price Hits 300-Week MA For The Second Time Ever, Here’s What Happened In 2022
Reason to trust
![]()
Strict editorial policy that focuses on accuracy, relevance, and impartiality
Created by industry experts and meticulously reviewed
The highest standards in reporting and publishing
Strict editorial policy that focuses on accuracy, relevance, and impartiality
Morbi pretium leo et nisl aliquam mollis. Quisque arcu lorem, ultricies quis pellentesque nec, ullamcorper eu odio.
Ethereum has once again fallen below the $2,000 mark, a psychological level it had briefly reclaimed earlier this week. The market-wide correction over the past 24 hours has weighed on Ethereum’s recovery momentum, and the leading altcoin has seen a dip in sentiment that could lead to a deeper decline or a sharp mid-term rebound.
Short-term sentiment is cautious, but a new analysis from a well-followed crypto analyst has brought attention to a significant technical event that opens up a bullish perspective for the Ethereum price.
Ethereum Hits 300-Week Moving Average Again: What Happened The Last Time?
Taking to social media platform X, crypto analyst CryptoBullet pointed out that Ethereum has now touched the 300-week moving average for only the second time in its history. The first instance was in June 2022, during the market-wide crash that saw the Ethereum price plummet to as low as $880 before beginning a long, slow recovery.
Related Reading
The second occurrence has come this month, March 2025, just as Ethereum continues to extend its struggles in gaining a footing above $2,000. With Ethereum touching the 300-week moving average again, we can only look back to see what happened last time to get a perspective of what to expect now.
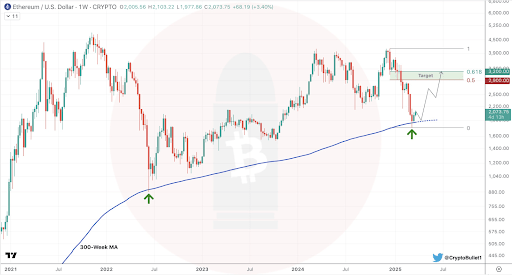
In June 2022, Ethereum’s touch of the 300-week moving average marked the beginning of a long-term recovery phase. After the bounce from that level, the Ethereum price surged more than 140% over the next eight weeks, eventually pushing above $2,100 in August 2022 before another correction.
Mid-Term Rebound In Focus For ETH, But Resistance Ahead
CryptoBullet noted the significance of this moving average, framing it as a key historical support zone. The analyst argued that regardless of bearish sentiment in the short term, this kind of macro-level support typically sets the stage for a meaningful bounce.
Related Reading
“Even if you’re a bear, you can’t deny that we hit a very important support level,” he wrote, adding that his price target for the coming bounce is between $2,900 and $3,200. Nonetheless, the bounce will depend on how the Ethereum price reacts to the level, as a continued downside move would cancel out any bullish momentum.
For now, Ethereum’s price is trapped under bearish sentiment, and bulls will need to reclaim the $2,000 zone before any sustainable bounce toward the $2,900 and $3,200 range can begin to materialize. Furthermore, the recent price correction in the past 24 hours increases the risks of the Ethereum price closing March below the 3M Bollinger bands, which is currently just around $2,000. A close below the 3M Bollinger bands could spell trouble for the leading altcoin.
However, if CryptoBullet’s analysis proves to be accurate, Ethereum may soon enter a period of stronger price action that plays out over the coming weeks. At the time of writing, Ethereum is trading at $1,907, down by 5.82% in the past 24 hours.
Featured image from Unsplash, chart from Tradingview.com
Source link

Ether (ETH) price declined by over 11.75% in the last 24 hours to around $1,900. At its intraday low, the cryptocurrency was trading for $1,755, its lowest price since October 2023.

ETH/USD four-hour price chart. Source: TradingView
Several factors appear to be contributing to ETH price losses, including:
US recession fears and its overall impact on risk-on markets.
Massive long liquidations in the crypto market.
Crypto loans backed by ETH as collateral facing liquidation risks.
Bearish technicals.
Ether price declines with risk-on assets
Ether’s ongoing price drop mirrors similar declines in the broader risk-on market due to unfavorable macroeconomic conditions.
Key points:

TOTAL crypto market cap vs. Nasdaq, Dow Jones, S&P 500, and US 10-year Treasury note yields four-hour chart. Source: TradingView
JPMorgan raised US recession risk to 40% for 2025, up from 30%, citing US President Donald Trump’s “extreme US policies” as a key risk factor.
Goldman Sachs also raised its 12-month recession probability to 20%, up from 15%.
Earlier in March, Trump imposed 25% tariffs on all goods from Mexico and Canada, and 10% tariffs on Chinese imports.
Canada and Mexico have announced intentions to impose retaliatory tariffs on US goods, escalating trade tensions and raising concerns about a potential trade war.
Meanwhile, China has already retaliated by increasing tariffs on multiple US products and imposing export controls and investment restrictions on 25 US firms.
These tariffs are expected to increase consumer prices and contribute to US inflation.
US recession fears are impacting Ethereum and the crypto sector, notably:
Ether, Bitcoin, and other top-ranking crypto assets have historically declined during periods of economic turbulences, e.g., the Covid-19 sell-off in March 2020.
As of March 11, the 52-week correlation between the crypto market and the US benchmark index, the S&P 500 index, was 0.69.

TOTAL crypto market cap and S&P 500’s 52-week correlation coefficient. Source: TradingView
A consistently positive correlation increases the odds of a crypto market decline if US stocks keep falling, especially as the trade war drags on further.
Bond traders see no need for a rate cut before June, with CME data showing 95% and 52.5% odds of a pause in the Fed’s March and May meetings, respectively.

Target rate probabilities for March’s Fed meeting. Source: CME
Bad DeFi loans increase Ether sell-off pressure
A $74 million DeFi loan on the Sky protocol, collateralized with $130 million in ETH, almost got liquidated after Ether price fell below the liquidation level just above $1,900.
As it happened:
The borrower added $34 million in ETH as collateral to avoid liquidation.
Withdrew $1.6 million in USDT from Binance, swapped it for DAI, and deposited into Maker.
Reduced debt to $73.1 million while ETH’s price continued to decline.
Liquidation level remained at $1,836 per ETH, closer to ETH’s current price above $1,900.
Nearly $353 million in debt is tied to such loans, risking liquidation if ETH’s price falls 20% from here.

Ethereum liquidation levels in DeFi. Source: DefiLlama
Long liquidations accelerate ETH downtrend
Ether’s tumble over the past 24 hours coincided with a wave of long liquidations that forced traders to exit their leveraged positions.
Key takeaways:
Over $240 million worth of ETH positions were wiped out in the last 24 hours, with long liquidations accounting for $196.27 million, or 82% of the total.

ETH total liquidation chart. Source: Coinglass
The sharp price drop triggered a cascade of forced sell-offs as traders betting on Ethereum’s price increase were liquidated.
When leveraged long positions fail to maintain margin requirements, exchanges automatically sell off their holdings to cover losses.
Such liquidations accelerate price declines, exacerbating the downturn.
The broader crypto market also experienced a sharp deleveraging event, with total liquidations reaching $897.26 million across assets.

Crypto market liquidations (24 hours). Source: TradingView
Ether eyes further decline toward $1,700
From a technical perspective, Ether’s price decline today is part of its prevailing inverse-cup-and-handle (IC&H) pattern.
Key points:

ETH/USD daily price chart. Source: TradingView
A temporary consolidation (handle) formed near $2,700, indicating a failed breakout attempt.
ETH broke below key support levels, confirming the IC&H breakdown, leading to more losses.
The measured move target from the pattern suggests a potential decline toward $1,700, aligning with the dotted support level.
The 50-day EMA ($2,600) and 200-day EMA ($2,929) remain far above, reinforcing bearish sentiment.
Key levels to watch:
ETH price is inside a descending channel pattern since late February.
As of March 11, the ETH/USD pair was rising after testing the channel’s lower trendline as support.

ETH/USD four-hour price chart. Source: TradingView
Such rebounds have taken prices toward the channel’s upper trendline in recent history.
If the fractal repeats, ETH’s next upside target could be around $2,000, aligning with the 0.236 Fibonacci retracement line.
A reversal from current price levels could have ETH test the IC&H downside target of $1,700.
This article does not contain investment advice or recommendations. Every investment and trading move involves risk, and readers should conduct their own research when making a decision.
Arthur Hayes, Murad’s Prediction For Meme Coins, AI & DeFi Coins For 2025 Expert Sees Bitcoin Dipping To $50K While Bullish Signs Persist Aptos Leverages Chainlink To Enhance Scalability and Data Access Bitcoin Could Rally to $80,000 on the Eve of US Elections Sonic Now ‘Golden Standard’ of Layer-2s After Scaling Transactions to 16,000+ per Second, Says Andre Cronje Institutional Investors Go All In on Crypto as 57% Plan to Boost Allocations as Bull Run Heats Up, Sygnum Survey Reveals Crypto’s Big Trump Gamble Is Risky Ripple-SEC Case Ends, But These 3 Rivals Could Jump 500x
Source link 
Kristin Smith Steps Down as Blockchain Association CEO to Lead Solana’s Policy Push

crypto eyes ‘good news’ amid fragile market psychology

Bitcoin Price (BTC) Rises Ahead of President Trump Tariff Announcement

XRP Price to $27? Expert Predicts Exact Timeline for the Next Massive Surge
Bitcoin And Altcoins Fischer Transform Indicator Turn Bearish For The First Time Since 2021

Grayscale files S-3 for Digital Large Cap ETF

279% Rally in 2025 for One Under-the-Radar Altcoin ‘Very Likely,’ According to Crypto Analyst

Human Rights Foundation Donates 1 Billion Satoshis To Fund Bitcoin Development

Dogecoin, Cardano Lead Gains as Crypto Majors Rally

Fartcoin price surges 35% as recovery gains momentum

$1M Premium Paid for $70K Bitcoin Put Option

How DePIN’s Revenue Growth is Attracting Equity Investors – DePIN Token Economics Report

Bitcoin Poised For A Q2 Recovery? Analyst Points 2017 Similarities

Binance ends Tether USDT trading in Europe to comply with MiCA rules

Crypto Trader Warns of Potential 33% Dogecoin Drop, Unveils Downside Price Target for Ethereum

Arthur Hayes, Murad’s Prediction For Meme Coins, AI & DeFi Coins For 2025

Expert Sees Bitcoin Dipping To $50K While Bullish Signs Persist

Aptos Leverages Chainlink To Enhance Scalability and Data Access

Bitcoin Could Rally to $80,000 on the Eve of US Elections

Sonic Now ‘Golden Standard’ of Layer-2s After Scaling Transactions to 16,000+ per Second, Says Andre Cronje

Institutional Investors Go All In on Crypto as 57% Plan to Boost Allocations as Bull Run Heats Up, Sygnum Survey Reveals

Crypto’s Big Trump Gamble Is Risky

Ripple-SEC Case Ends, But These 3 Rivals Could Jump 500x

Has The Bitcoin Price Already Peaked?

A16z-backed Espresso announces mainnet launch of core product

Xmas Altcoin Rally Insights by BNM Agent I

Blockchain groups challenge new broker reporting rule

The Future of Bitcoin: Scaling, Institutional Adoption, and Strategic Reserves with Rich Rines

Trump’s Coin Is About As Revolutionary As OneCoin

Is $200,000 a Realistic Bitcoin Price Target for This Cycle?


✓ Share: