
Avalanche
Avalanche Might Continue Its Downtrend As Price Slips To $16

Avalanche had performed well over the past week, however, the coin depreciated significantly over the last 24 hours. It shed close to 12% over the past day. AVAX experienced tough resistance at the $21 mark, and it was unable to break over it causing price of the asset to slump further.
Bitcoin and other major market movers has been struggling to trade above their immediate resistance mark too. BTC has been stuck at the $20,000 mark over the last few days. Broader market weakness has caused most altcoins to drop on their charts.
Currently, most prominent altcoins including AVAX has been witnessing a wave of selling pressure. With mounting selling pressure, AVAX might move closer to the immediate support level of $14 over the next trading sessions.
Since, the coin bounced from the $20 price level, AVAX has ever since continued to move south on its 24 hour chart. The global cryptocurrency market cap today is $892 Billion with a fall of 5.1% over the last 24 hours.
Avalanche Price Analysis: One Day Chart
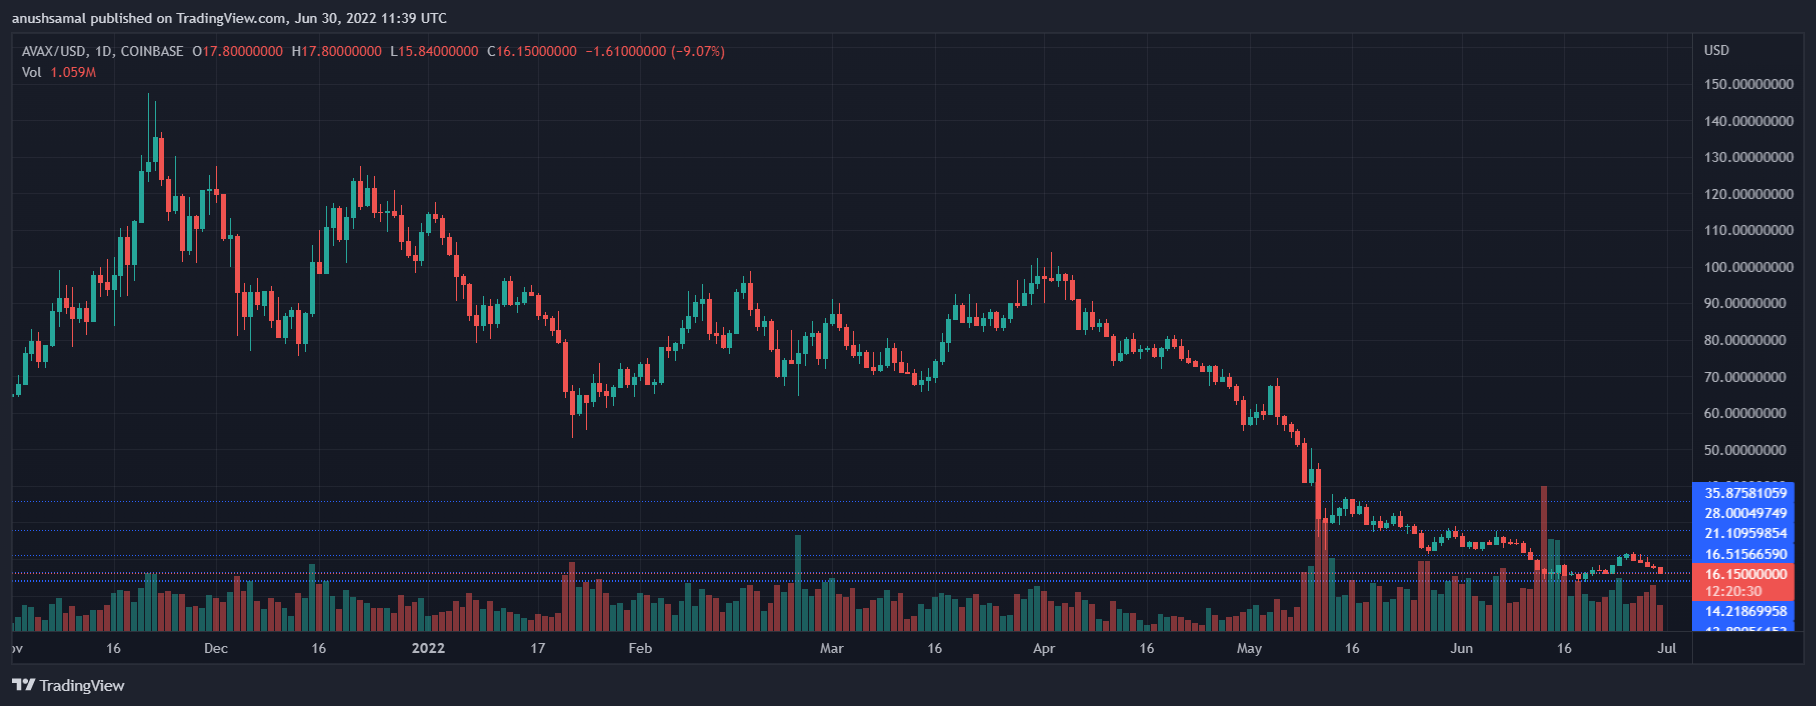
AVAX was exchanging hands at $16 on the 24 hour chart. After being rejected at the $20 level, the coin continued to move on the bearish trend. The next support line for the coin was at $14. If the coin is unable to sustain above the $14 mark, it could trade near the $13 mark.
Overhead resistance was at $21, despite AVAX trying to break past it, the coin has failed multiple times causing the bears to gain strength. The volume of AVAX traded declined on the chart and the volume bar was in red which signified selling pressure and bearishness.
Technical Analysis
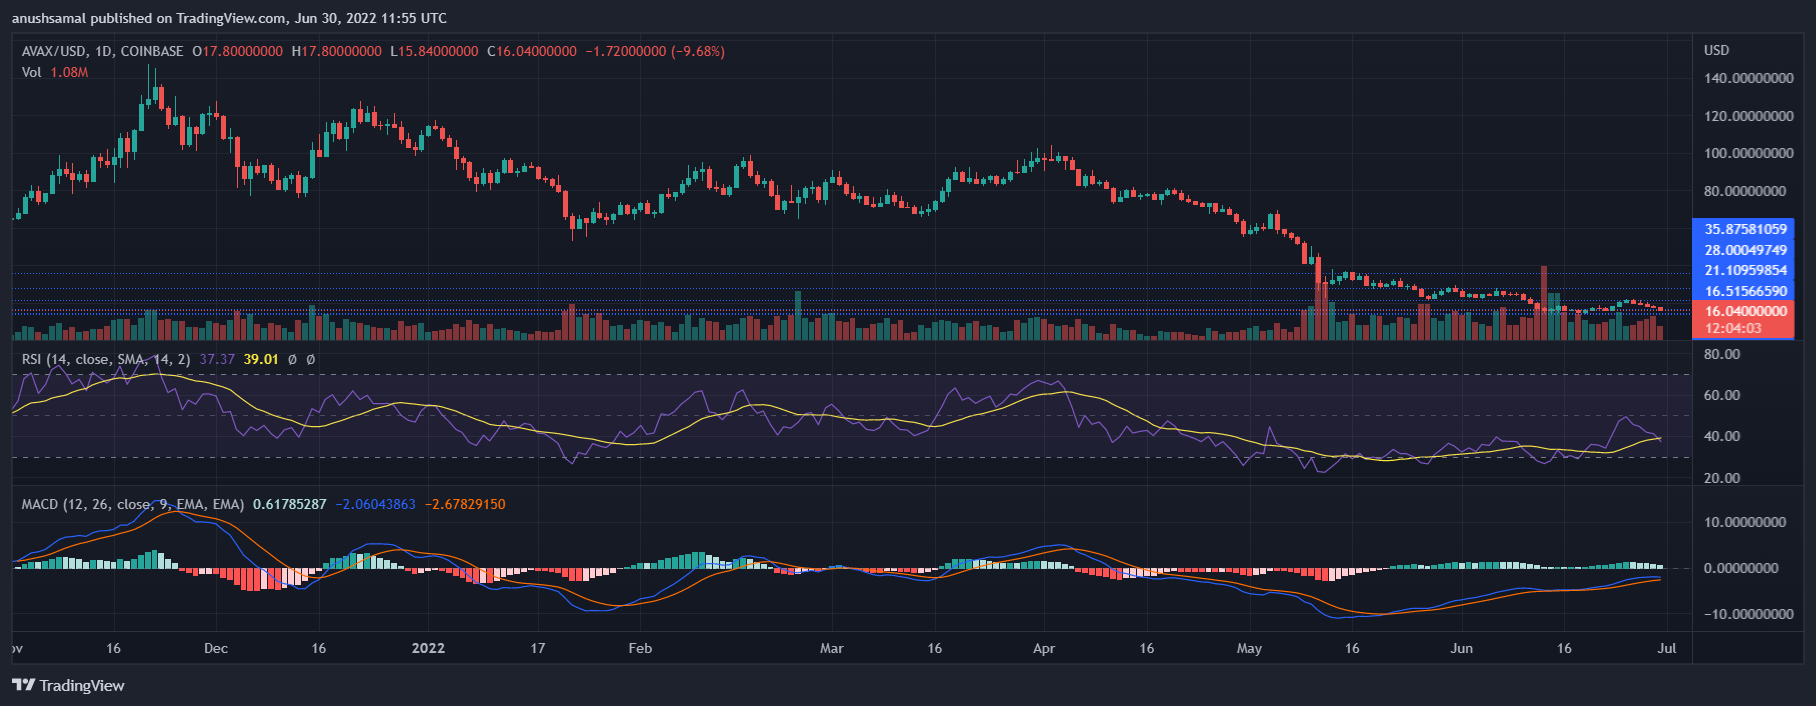
AVAX has barely registered buying strength over the past month. Over the last few days even though the coin registered some buying strength recovery, the current price drop invalidated the same. The Relative Strength Index was below the half-line for whole of this month, with occasional dip into the oversold region.
At press time RSI again noted a downtick suggesting continuation of a downtrend. Conversely, Moving Average Convergence Divergence flashed green signal bars. The indicator depicts the current price direction and possibility of price reversals too.
The green signal bars on the MACD are considered to be a buy signal and this presents a buying opportunity. If buyers act on it, AVAX might experience some relief.
Related Reading | Tracking Whales, What This Bitcoin Divergence Could Hint About BTC’s Price
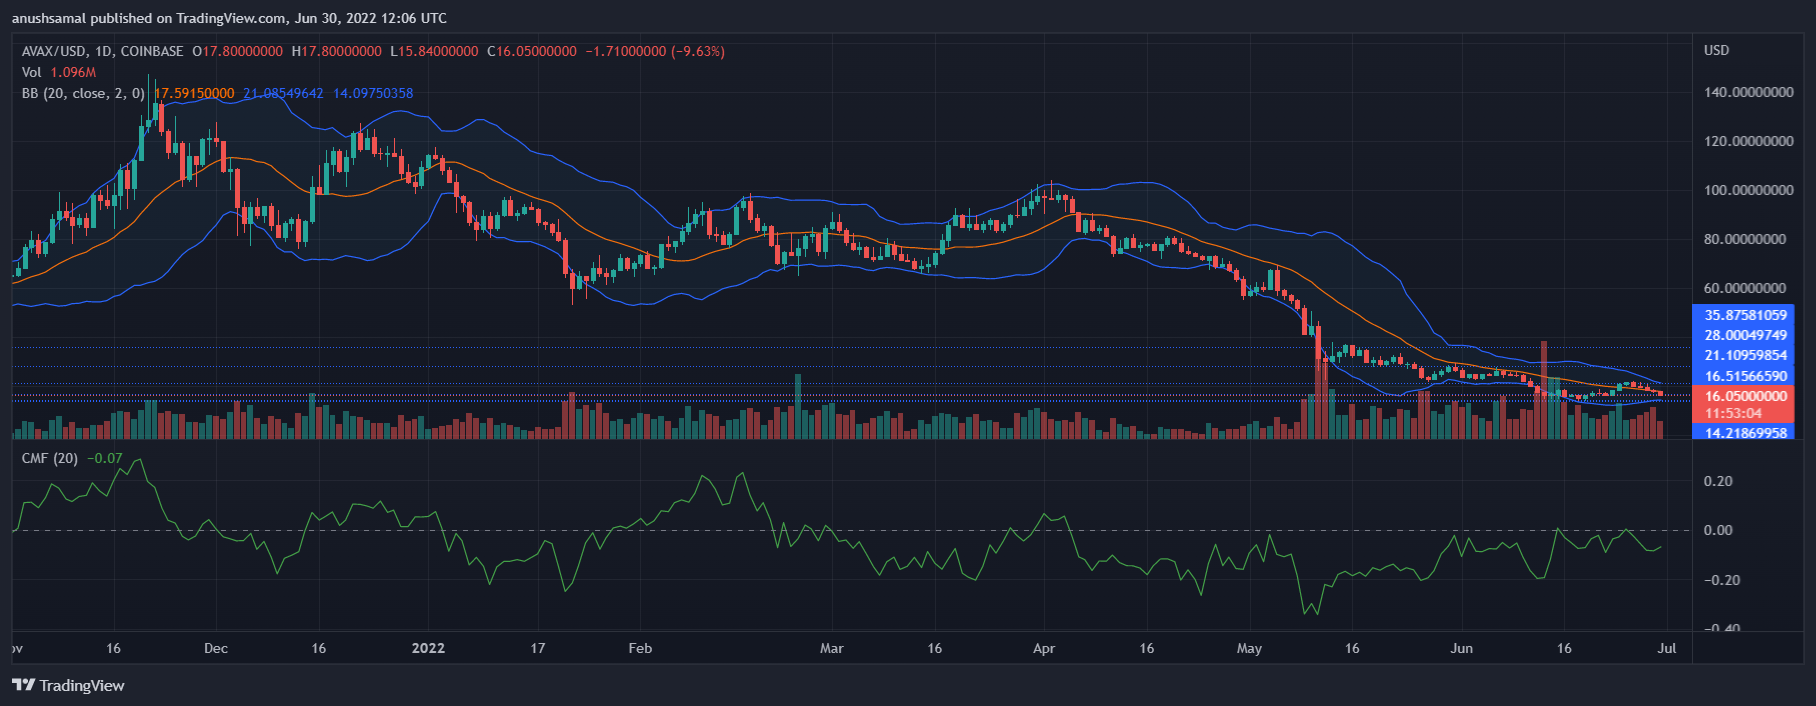
Buying momentum faded from AVAX’s charts, in consonance so did the amount of capital inflows. Chaikin Money Flow depicts capital inflows and outflows, the indicator was below the halfline. This reading meant that capital inflows were lesser than outflows suggesting higher selling pressure.
Bollinger Bands constricted sharply, indicating that explosive price movement could possibly be on the charts. Bollinger Bands reads the price volatility in the market. Overall, technical outlook remains heavily bearish for AVAX suggesting further southbound action for the coin.
If buyers re-enter the market, the coin can manage to move upwards for the next trading sessions.
Related Reading | TA: Ethereum Key Indicators Suggest A Sharp Drop Below $1K
Featured image from www.avax.network, chart from TradingView.com
Source link


Bitcoin (BTC) rallied to the 200-week moving average on July 8, a level that could act as a battleground between the bulls and the bears. Several analysts are watching this level because a break and close above it could be the first sign that the bear market may be ending.
Bloomberg senior commodity strategist Mike McGlone said that Bitcoin’s 50-week and 100-week moving averages are showing similar signs as made before the 2018 bear market bottom. Therefore, McGlone expects Bitcoin to give a strong rebound in the second half of 2022.
Another positive sign is that Bitcoin rose above $22,000 on July 8 even as the United States dollar index (DXY) continued its northward march. This suggests that the strong inverse correlation between Bitcoin and the DXY may be starting to weaken.
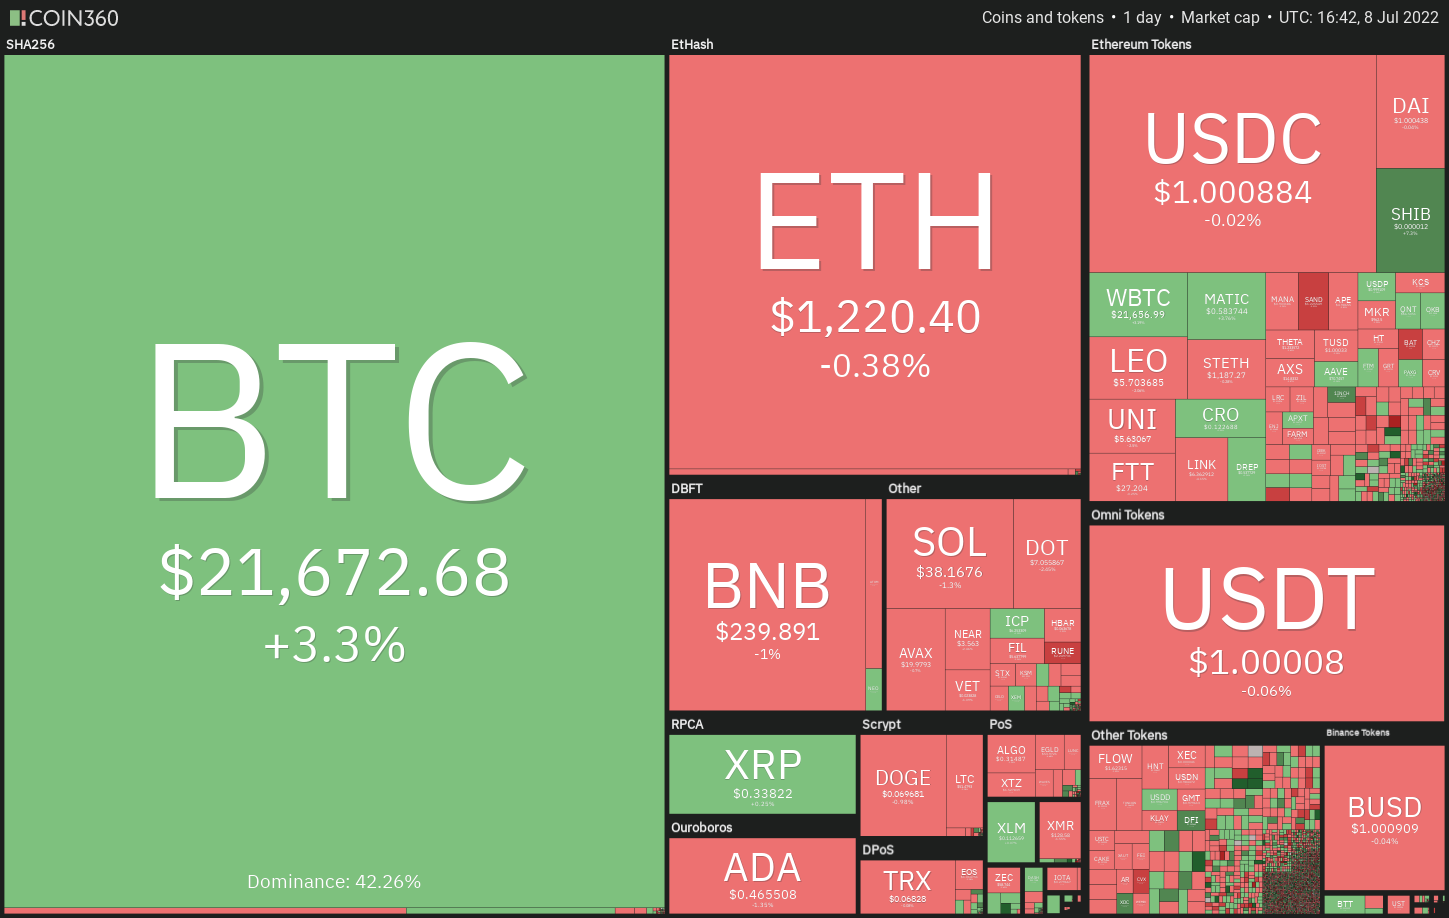
Could Bitcoin extend its recovery pulling the crypto markets higher? Let’s study the charts of the top-10 cryptocurrencies to find out.
BTC/USDT
Bitcoin broke above the resistance line of the symmetrical triangle and the 20-day exponential moving average (EMA) ($21,233) on July 7, indicating that bulls are making a comeback.
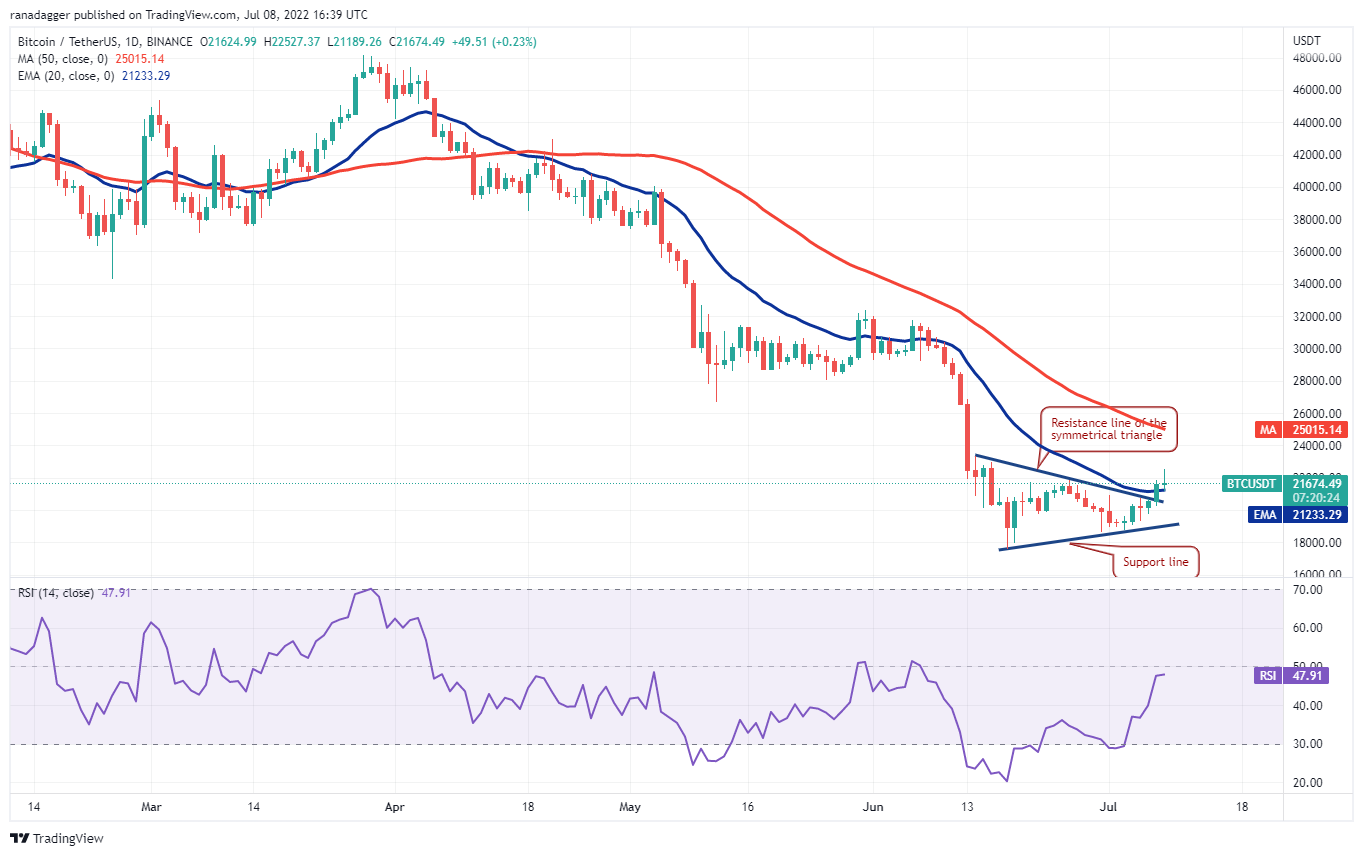
The flattening 20-day EMA and the relative strength index (RSI) just below the midpoint suggest that the selling pressure may be reducing.
If the price rebounds off the current level or the breakout level from the triangle, it will suggest that the sentiment has turned positive and traders are buying the dips. That could increase the possibility of a rally to the 50-day simple moving average (SMA) ($25,015) and then to the pattern target at $26,490.
This positive view could invalidate in the short term if the price breaks back below the 20-day EMA and re-enters the triangle. That will indicate aggressive selling by the bears at higher levels. The pair could then drop to the support line of the triangle.
ETH/USDT
Ether (ETH) broke above the 20-day EMA ($1,198) on July 7 and reached the overhead resistance at $1,280 on July 8. The bears are defending this resistance aggressively and are attempting to sink the price back below the 20-day EMA.
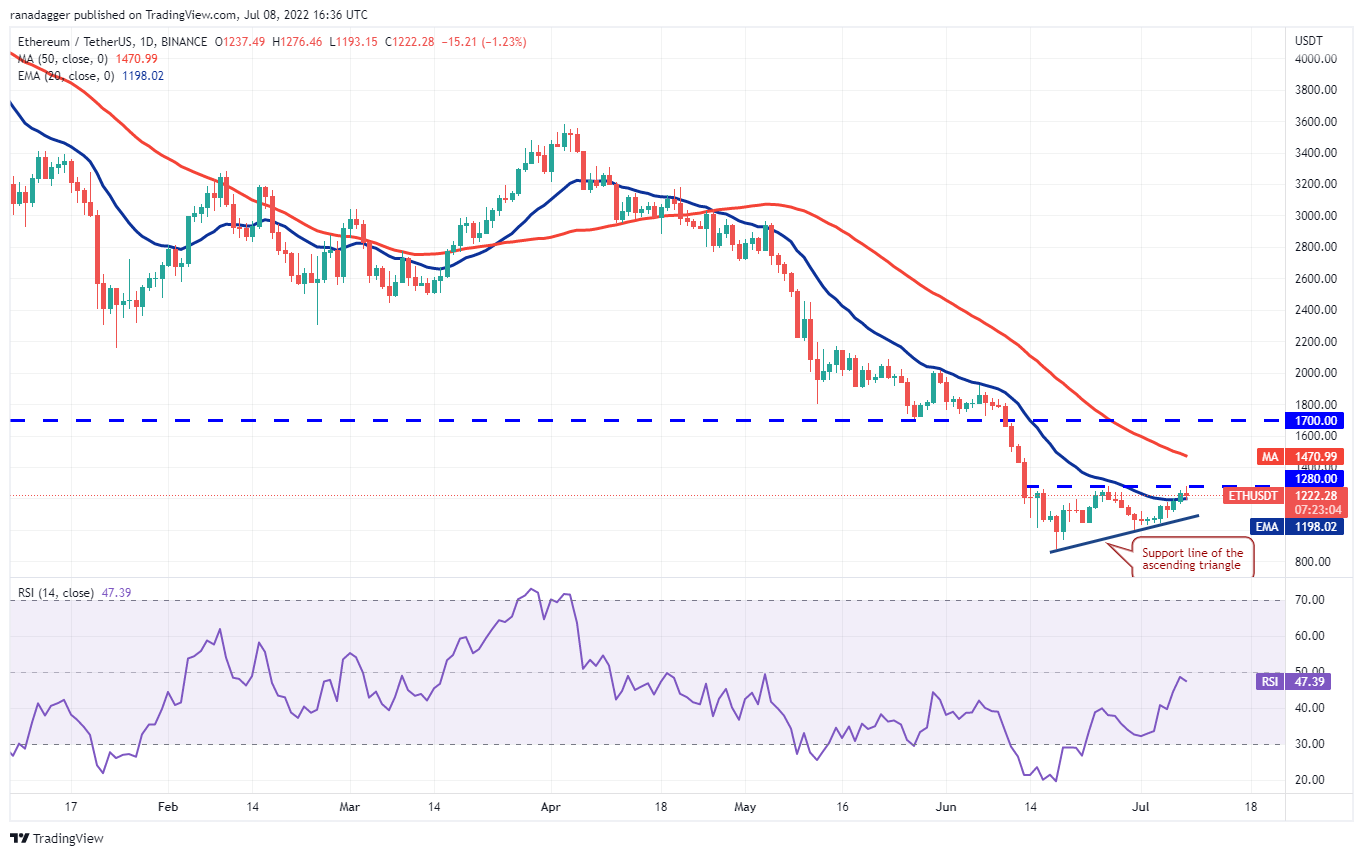
If they do that, the ETH/USDT pair could drop to the support line of the ascending triangle. This is an important level to keep an eye on because a break and close below it could invalidate the bullish setup. That could pull the price down toward the critical support at $881.
Conversely, if the price rebounds off the 20-day EMA and breaks above $1,280, it will complete the bullish ascending triangle pattern. The pair could then rise to the 50-day SMA ($1,470) and later rally to the pattern target at $1,679.
BNB/USDT
BNB broke and closed above the 20-day EMA ($233) on July 6 but the bulls are struggling to push the price to the 50-day SMA ($262). This suggests that bears are active at higher levels.
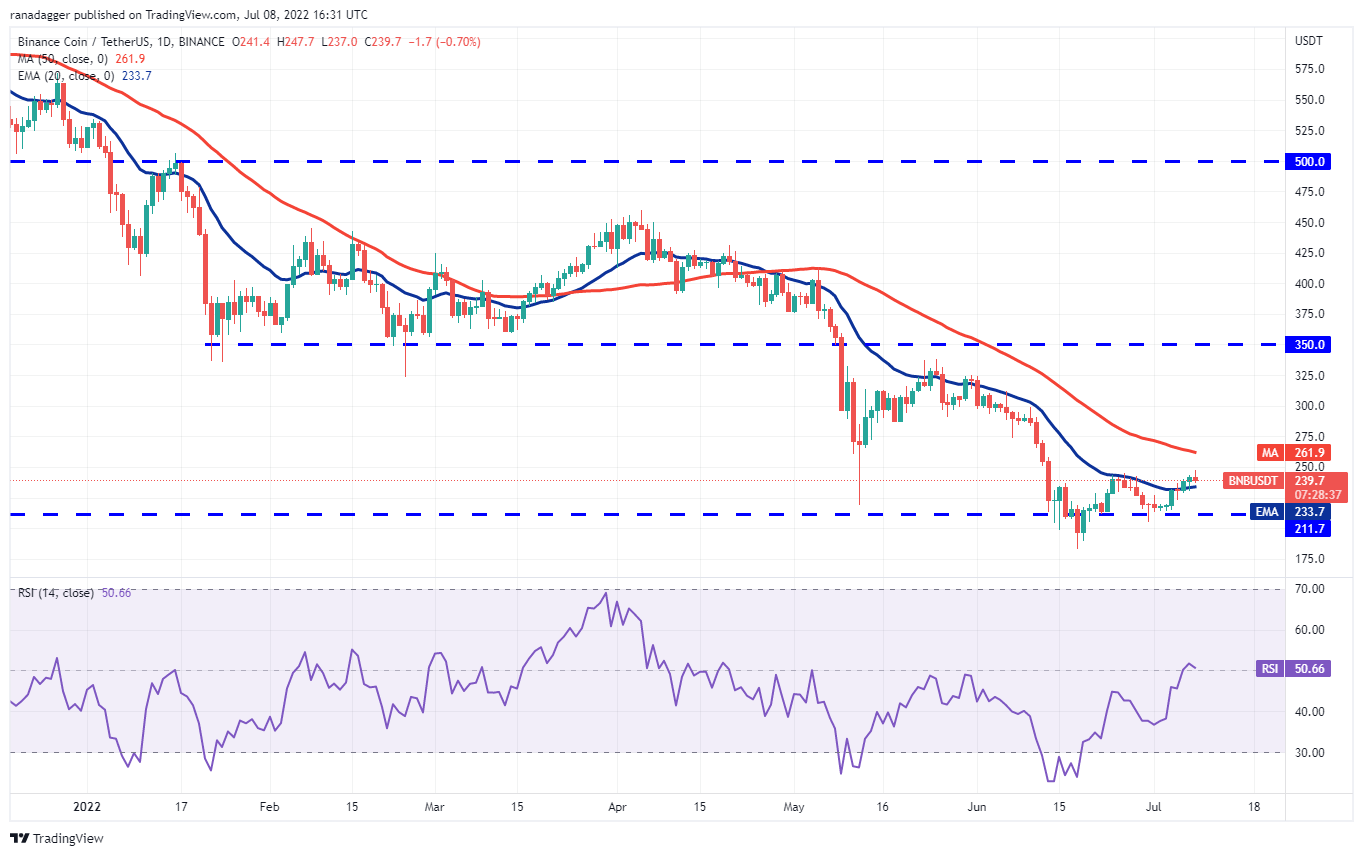
The sellers are trying to pull the price back below the 20-day EMA. If they can pull it off, the BNB/USDT pair could slide to the strong support at $211.
On the other hand, if the price rebounds off the 20-day EMA, it will suggest that the sentiment is turning positive and the bulls are buying on dips. The bulls will then attempt to drive the price above the 50-day SMA and gain control. That could clear the path for a possible rally to $300.
XRP/USDT
Ripple (XRP) attempted a break above the resistance line of the symmetrical triangle but the bears had other plans. They aggressively defended the level and are trying to sink the price back below the 20-day EMA ($0.33).
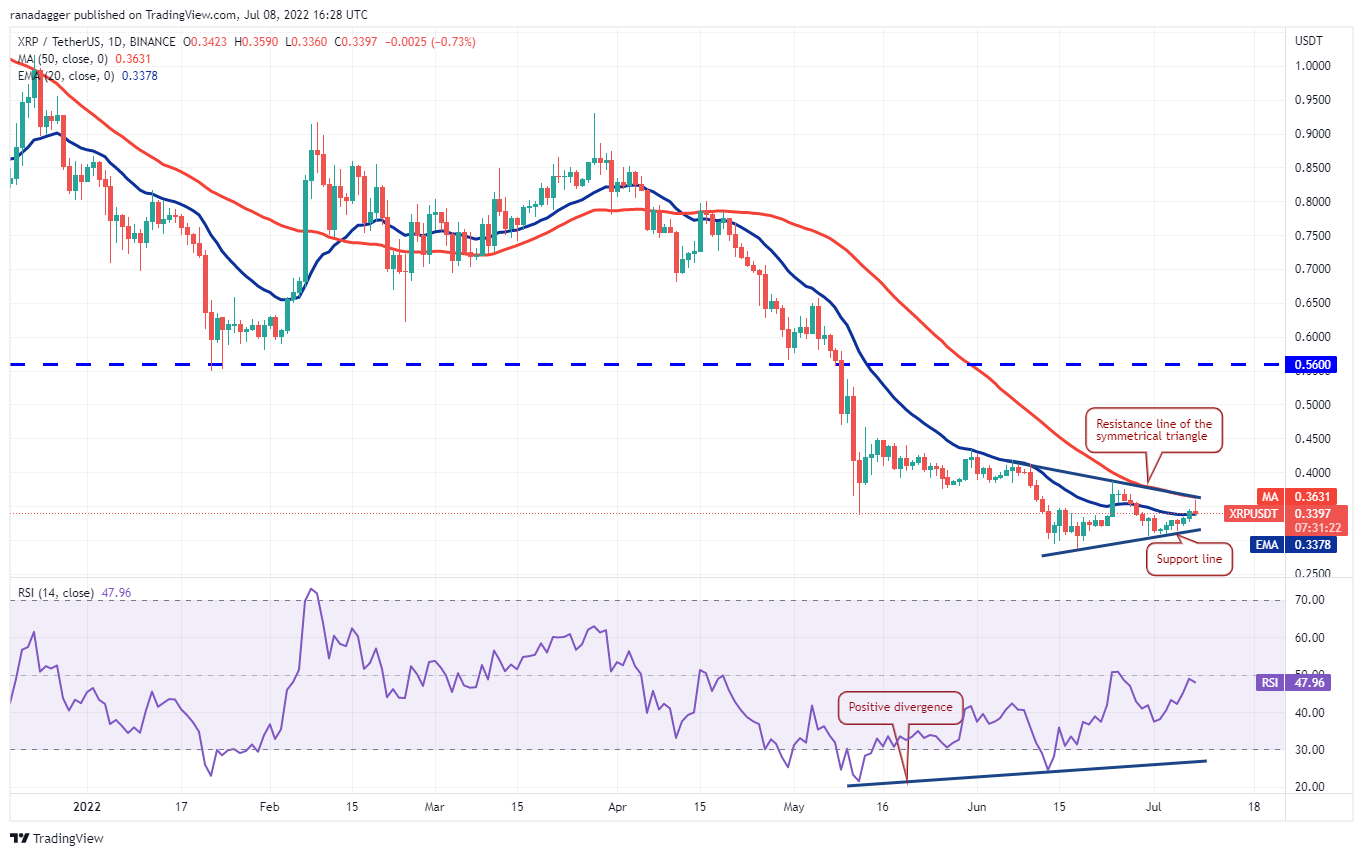
If they succeed, the XRP/USDT pair could extend its stay inside the triangle for some more time. The flattish 20-day EMA and the RSI near the midpoint do not give a clear advantage either to buyers or sellers.
A break and close above the triangle could indicate the start of a new up-move. The pair could then rally to the pattern target at $0.48. Alternatively, a break below the triangle could open the doors for a retest at $0.28.
ADA/USDT
Cardano (ADA) rose above the 20-day EMA ($0.47) on July 8 but the bulls could not sustain the higher levels. This indicates that the bears are aggressively defending the moving averages.
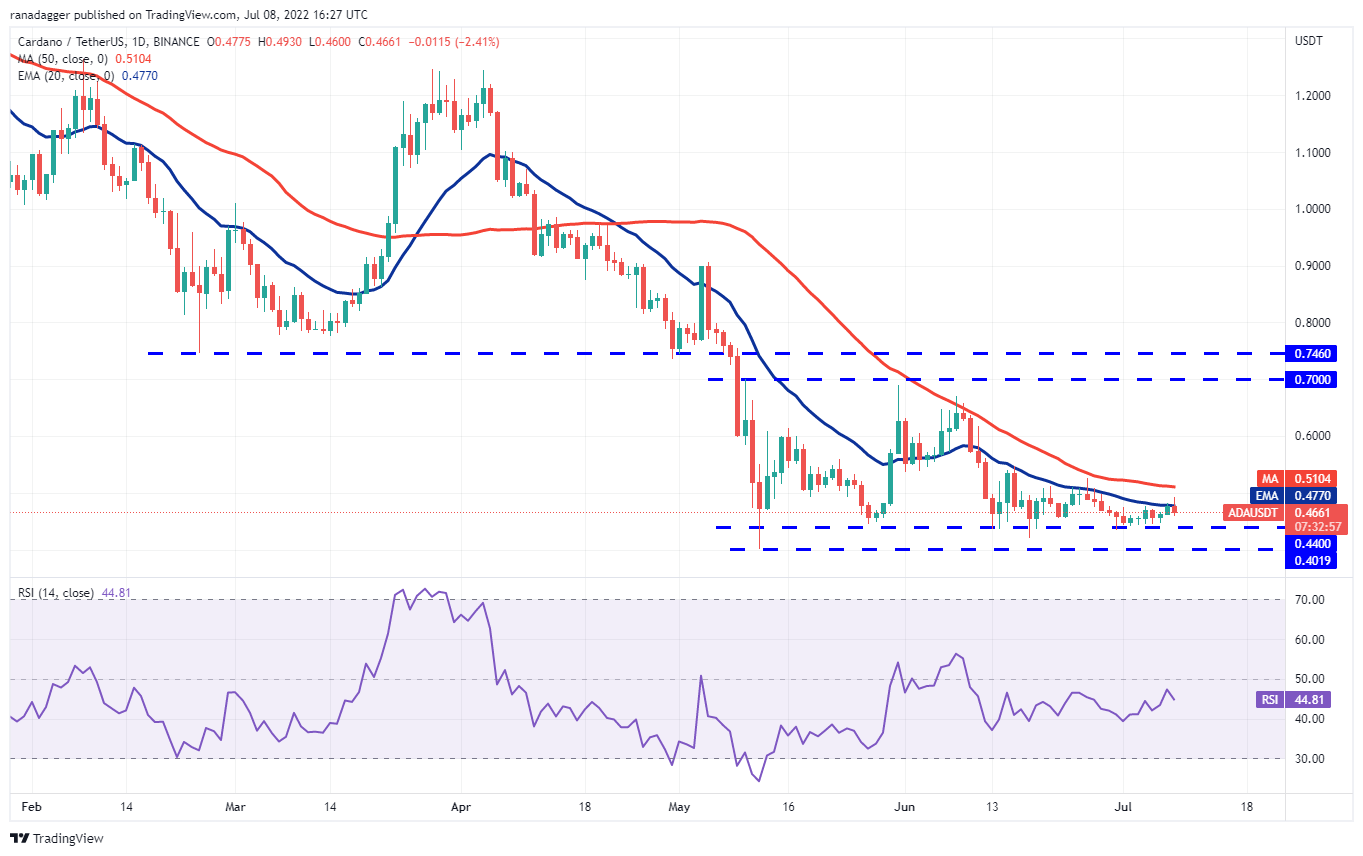
The sellers will attempt to build upon their advantage by pulling the price below the strong support at $0.44. If they manage to do that, the ADA/USDT pair could drop to the important level at $0.40. A break and close below this support could indicate the start of the next leg of the downtrend.
To invalidate this bearish view, buyers will have to push and sustain the price above the 50-day SMA ($0.51). If they manage to do that, the pair could rally to $0.60 and then to $0.70.
SOL/USDT
The buyers attempted to push Solana (SOL) above the 50-day SMA ($38.79) on July 5 and 6 but could not overcome the barrier. This suggests that the bears are selling on rallies.
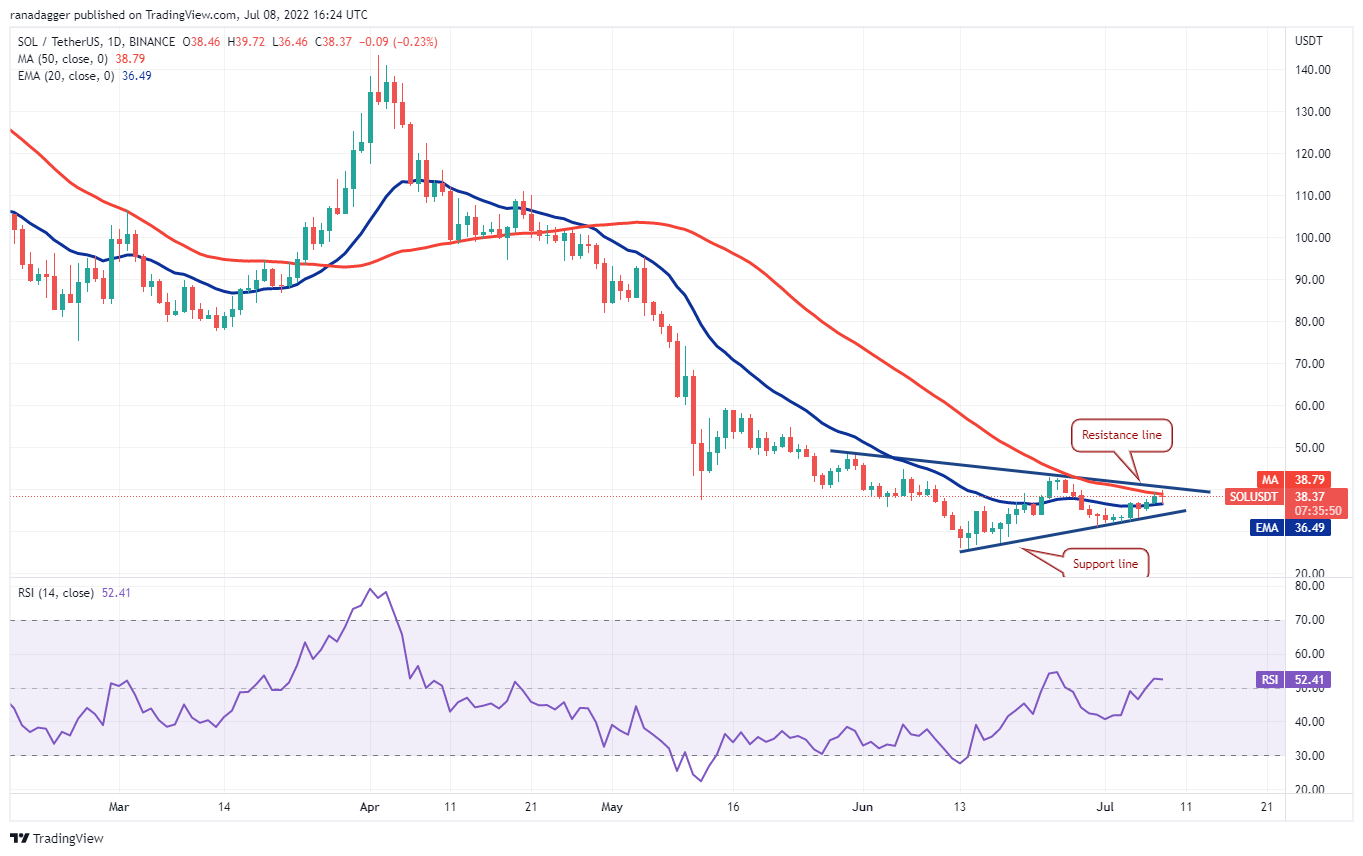
The price is getting squeezed inside a symmetrical triangle. This points to a possible range expansion in the short term. If the price turns down and breaks below the triangle, the SOL/USDT pair could slide toward the critical support at $26.
Conversely, if the price turns up and breaks above the resistance line of the triangle, it will suggest that bulls have the upper hand. The pair could then rally to the psychological level of $50 where the bears may again mount a strong defense.
DOGE/USDT
Dogecoin (DOGE) attempted a break above the 50-day SMA ($0.07) on July 8 but the bears did not relent. The sellers are trying to use the opportunity to sink the price back below the 20-day EMA ($0.07).
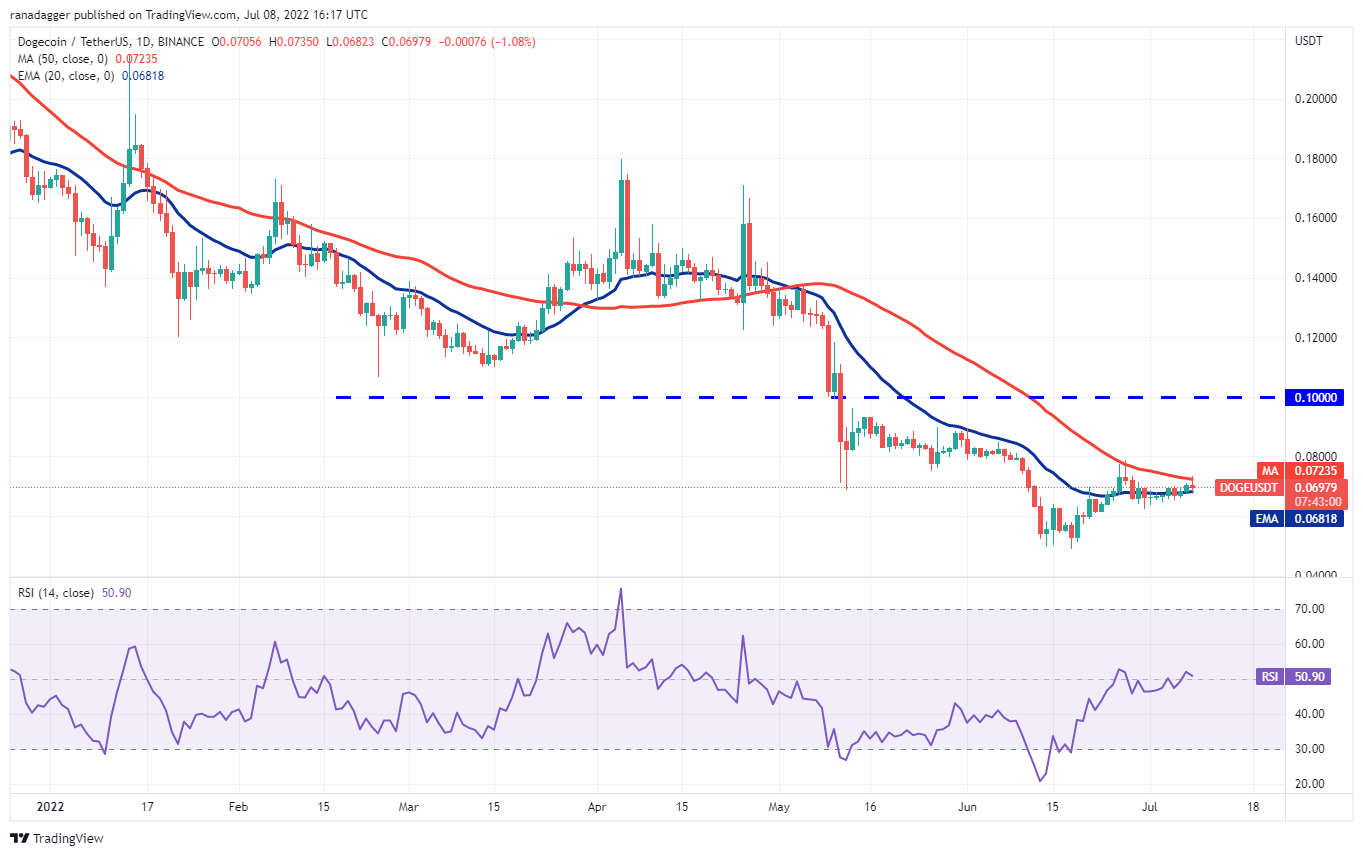
The RSI is near the midpoint and the 20-day EMA has flattened out, suggesting a balance between buyers and sellers. This equilibrium could tilt in favor of the bulls if they push and sustain the price above the 50-day SMA. Such a move could clear the path for a rally to $0.08 and next to $0.09.
Conversely, if the price turns down and breaks below $0.06, the bears will strive to pull the DOT/USDT pair to the vital support at $0.05.
Related: DOGE days of summer: Shiba Inu gains 40% on Dogecoin two months after record lows
DOT/USDT
Polkadot (DOT) attempted to break above the overhead resistance at the 20-day EMA ($7.38) on July 7 but the bears held their ground. This indicates that bears are active at higher levels.
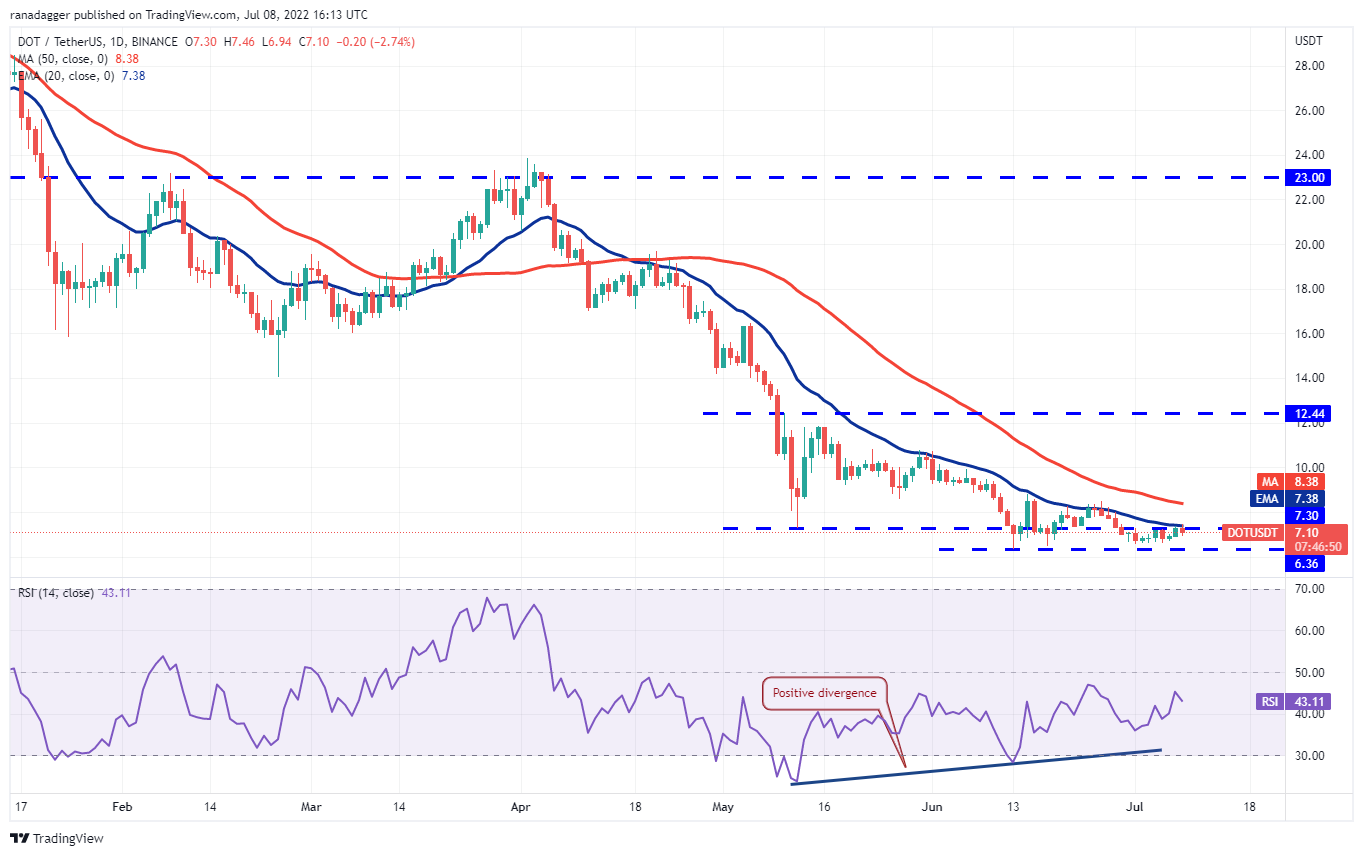
The bears will attempt to pull the price toward the critical support at $6.36. This is an important support for the bulls to watch out for because a break and close below it could indicate the resumption of the downtrend. The DOT/USDT pair could then decline to the psychological level of $5.
This negative view could invalidate if the price turns up and rises above the 20-day EMA. If that happens, the pair could attempt a rally to the 50-day SMA ($8.38). This level may again act as a resistance but if bulls clear this hurdle, it may signal a potential change in trend.
SHIB/USDT
The tight range trading in Shiba Inu (SHIB) resolved to the upside on July 7 as the price broke above the immediate resistance at $0.000011. The bears tried to sink the price back below $0.000011 on July 8 but the long tail on the candlestick indicates strong buying on dips.
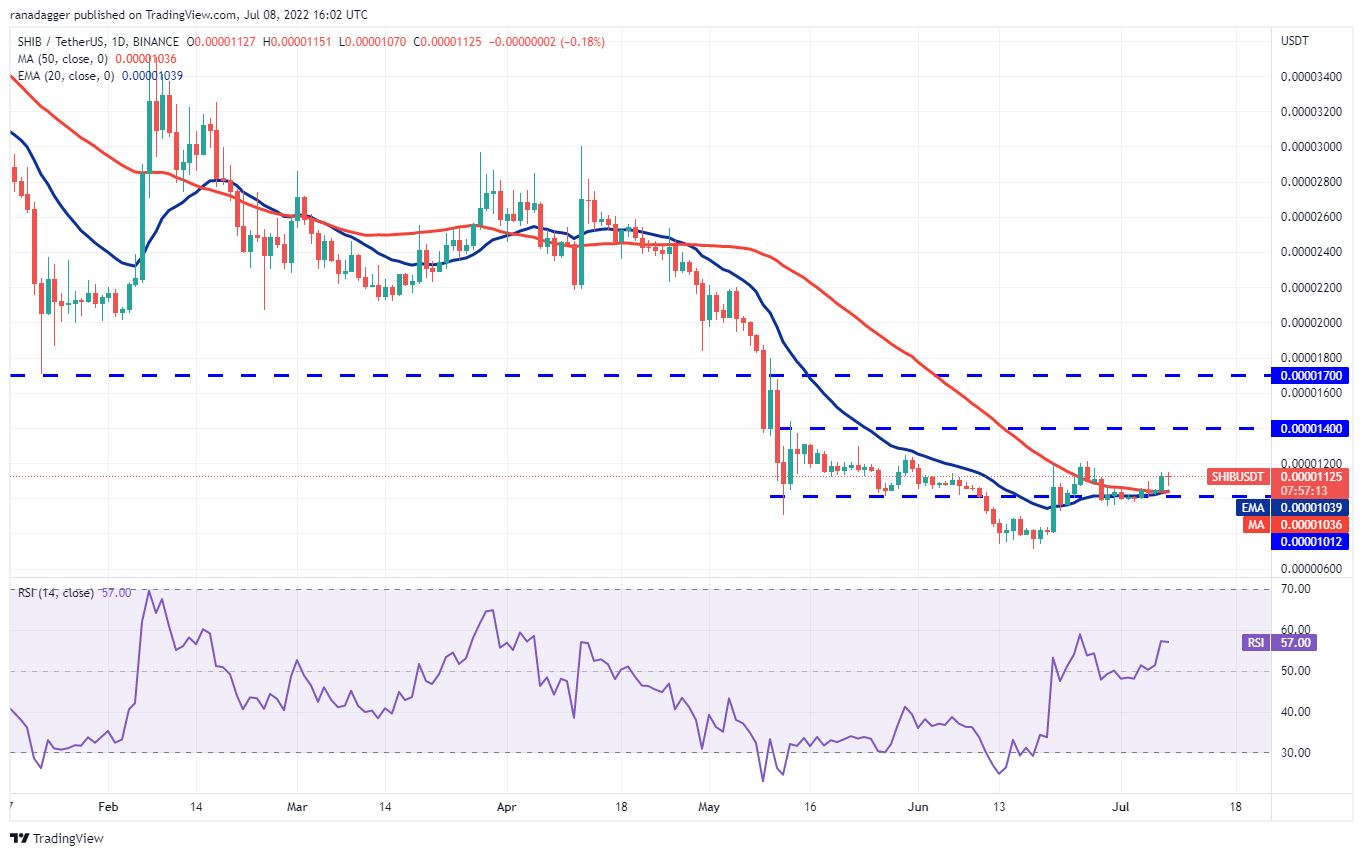
The buyers will attempt to push the price above the stiff resistance at $0.000012. If they succeed, it will indicate demand at higher levels. The SHIB/USDT pair could then rally to $0.000014 where the bears may again pose a strong challenge.
Conversely, if the price turns down from the current level and sustains below $0.000011, it will suggest that the breakout on July 7 may have been a bull trap. The bears will then try to pull the price back below the critical support at $0.000010. If that happens, the next stop could be $0.000009.
AVAX/USDT
Avalanche (AVAX) has been trading between $13.71 and $21.35 for the past few days, indicating a bottoming formation. The 20-day EMA ($18.78) has flattened out and the RSI is just above the midpoint, indicating a balance between the bulls and the bears.
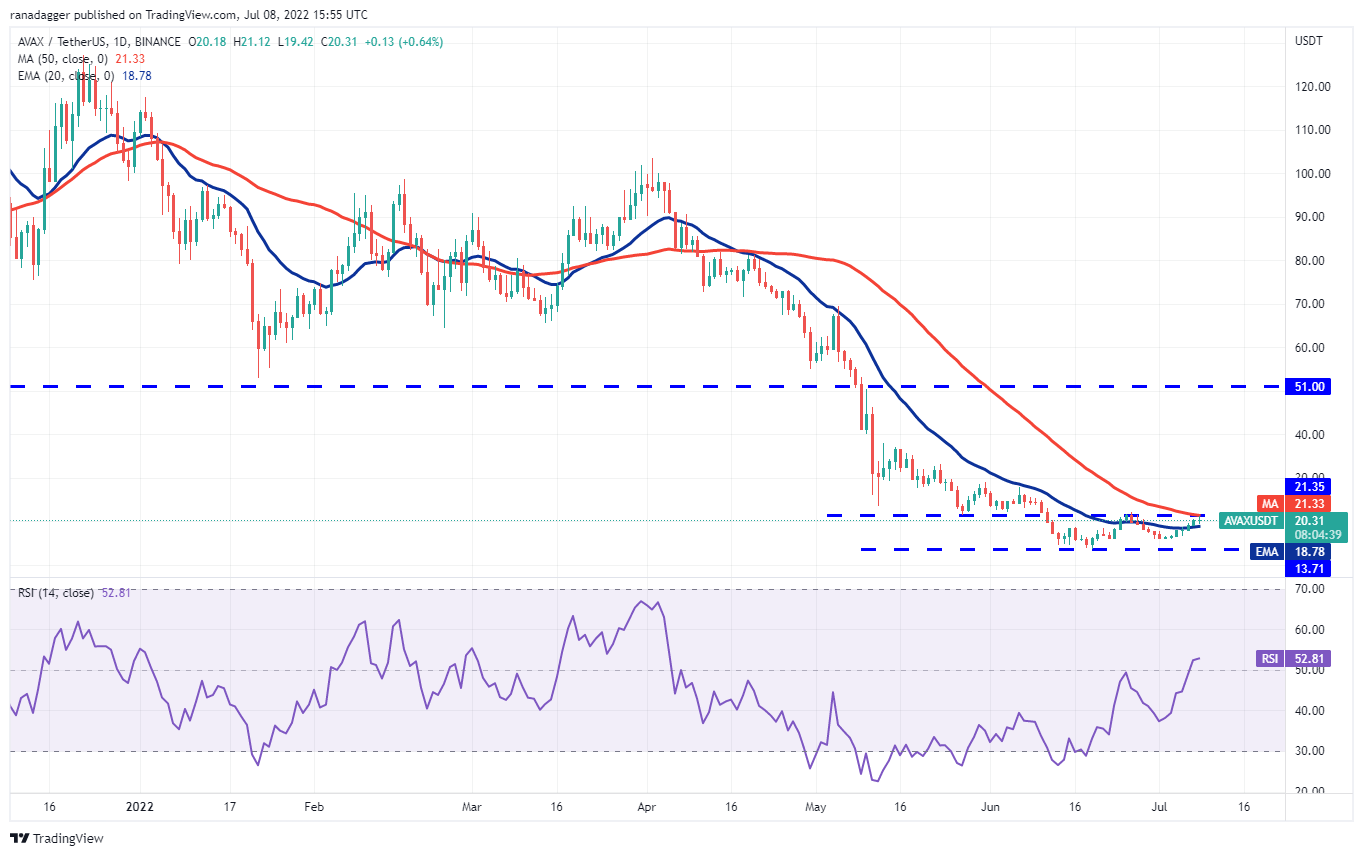
If buyers drive the price above the overhead resistance at $21.35, it will signal the start of a new up-move. The AVAX/USDT pair could rally to the pattern target of $29 where the bears may again mount a strong resistance. If the price turns down from this level but does not drop below $21.35, it will suggest that a bottom may have been made at $13.71.
Contrary to this assumption, if the price turns down from the current level and breaks below the 20-day EMA, it will indicate that the range-bound action may continue for a few more days.
The views and opinions expressed here are solely those of the author and do not necessarily reflect the views of Cointelegraph. Every investment and trading move involves risk. You should conduct your own research when making a decision.
Market data is provided by HitBTC exchange.
Source link
Avalanche
Can Ethereum’s First Mover Advantage Solidify the Smart Contract Space Dominance? – Blockchain News, Opinion, TV and Jobs

Ethereum has now become one of the most widely blockchains of crypto, and its upgrade, also know as ‘the Merge’ will transition the blockchain from a proof-of-work consensus mechanism to the more efficient, more secure and less energy-intensive proof-of-stake method. The method will also be better for implementing new scaling solutions.
The upgrade is badly needed now, as it will also be able to support Ethereum’s growing number of users. Is is meant to solve problems such as slower speeds and higher fees. So it makes sense to get this transition done sooner than later. but unfortunately its not that simple.
What is a difficulty bomb?
On a proof-of-work consensus mechanism, miners must solve complex math problems to earn a reward. The difficulty bomb, which is a special code that’s always been a part of Ethereum, increases the computing difficulty of mining, eventually making it impossible to do so. When this so called ‘bomb’ goes off and is running its course, it will be an indication that the days until the so-called merge are numbered, and it will mean that eventually the proof-of-work math problems will become impossible to solve. Miners will then lose profits trying to mine.
It would only make sense that miners would eventually abondon the proof-of-work model and migrate to a proof-of-stake method. But before this all happens, Ethereum developers must all agree that enough testing has been accomplished so that the Merge can be unveiled seamlessly. But so far that hasn’t happened, and the difficulty bomb has been delayed, not for the first, but for the fifth time now. More testing is still needed to ensure that the transition will be smooth, which hopefully will be done around the 15th of september 2022.
Experts believe that a succesful implementation of the Merge could become one of the greatest accomplishments in cryptocurrency history. A smooth transition would transform one of the most widely used blockchains be a more smooth running and affordable network that will be capable of supporting a multitude of applications in the crypto world.
But if Ethereum developers are not able to do this soon, it could mean trouble going forward. The longer it takes, then the more likely it becomes that other smart contract-capable blockchains such as Solana, Avalanche, or Cardano could be the ones who will grab the market share first.
The Sepolia testnet
But the good news is, the penultimate test environment network (the Sepolia testnet), a two-step process, has successfully been completed. This testnet merge takes the project one step closer to Ethereum’s mainnet upgrade later this year.
Currently, Ethereum is up by approximately 5.15% since yesterday, and the media is speculating this could be due to this succesful completion and the upcoming ‘Merge’.
Chris Terry, BPSAA Board Member and VP Enterprise Solutions at SmartFi, the US-based open lending platform, wants to share his ideas on the matter, he says:
“The bad news is the Ethereum developers have pushed back the difficultly bomb which was an essential step for the planned Merge at the end of the year. The good news is they did manage to get the Sepolia test net running. The Ethereum upgrade, now years behind, shows how difficult this business is. Each day that goes by opens the doors for projects like Cardano, Solana, Avalanche and others. But, just like Bitcoin, Ethereum has first mover advantage and that still is huge. If Ethereum can finally get to proof of stake it will solidify, without question, the smart contract space dominance. But they better move fast.”
Source link

US Treasury calls for public comment on digital asset policy, following Biden’s executive order

Experts Claim Cyber Attacks On Crypto Firms Will Rise, What’s Ahead?

Sri Lanka central bank reiterates crypto warning following protestors seizing president’s residence

Into Crab Mode, Bitcoin Bullish Potential Capped For The Coming Months?

How to build a passive income stream from cloud mining?
Successful Beta Service launch of SOMESING, ‘My Hand-Carry Studio Karaoke App’

List of TOP BTC Gambling Sites
US Treasury Delivers Crypto Framework to Biden as Directed in Executive Order

Bitcoin price indicator that marked 2015 and 2018 bottoms is flashing
Successful Beta Service launch of SOMESING, ‘My Hand-Carry Studio Karaoke App’

Tezos (XTZ) Nears 3-Week High
How a Presale Ethereum Wallet Containing 1000 ETH Was Recovered by KeychainX

Ethereum co-founder responds to PoS critics amid upcoming Merge

theBlock Research Pins Stacks as a Key Player in the BTC Network

Bitcoin price hits 7-day low as US warns of ‘highly elevated’ CPI data
BNM DAO Token Airdrop
New Minting Services

Could an Earnings Recession Lead to More Pain for Crypto? – Blockchain News, Opinion, TV and Jobs

‘Crypto is just like the end of the 90s with the internet bubble,’ says Hodl CEO Maurice Mureau

Virginia passes new crypto law whilst macro headwinds mount up – Blockchain News, Opinion, TV and Jobs

A Bear of Historic Proportions – Blockchain News, Opinion, TV and Jobs

Interview with Ruud Feltkamp, Owner of AI-driven Trading Bot Cryptohopper – Blockchain News, Opinion, TV and Jobs

High-profile BAYC collector denies allegations of wrongdoing brought by DeFi detective

BNM Live Stream

Are expiring copyrights the next goldmine for NFTs?

Tesla, Blockstream and Jack Dorsey’s Block Team-up to Mine Bitcoin Sustainably – Blockchain News, Opinion, TV and Jobs

Block News Media Live Stream

Live Stream Block News Media

Fintech-Ideas brings blockchain functionality to its range of platforms – Blockchain News, Opinion, TV and Jobs

Quant (QNT) Registers Gains In Past Days
-
Uncategorized6 months ago
BNM DAO Token Airdrop
-
Uncategorized8 months ago
New Minting Services
-
 bear market2 weeks ago
Could an Earnings Recession Lead to More Pain for Crypto? – Blockchain News, Opinion, TV and Jobs
-
 Blockchain2 weeks ago
‘Crypto is just like the end of the 90s with the internet bubble,’ says Hodl CEO Maurice Mureau
-
 Bitcoin2 weeks ago
Virginia passes new crypto law whilst macro headwinds mount up – Blockchain News, Opinion, TV and Jobs
-
 bear markets2 weeks ago
A Bear of Historic Proportions – Blockchain News, Opinion, TV and Jobs
-
 Blockchain2 weeks ago
Interview with Ruud Feltkamp, Owner of AI-driven Trading Bot Cryptohopper – Blockchain News, Opinion, TV and Jobs
-
 Blockchain Analytics2 weeks ago
High-profile BAYC collector denies allegations of wrongdoing brought by DeFi detective